Get Indexology® Blog updates via email.

In This List

Spot the Difference

S&P High Yield Dividend Aristocrats Expands with Eight New Members in the Latest Reconstitution

A New Generation of Buyback Indices: Introducing the S&P 500 Buyback Aristocrats Index

S&P 500 FC 7% Index: The Gold Standard of Indices Meet’s Today’s Technology

Tech Tantrums

Spot the Difference

Contributor Image
Joseph Nelesen

Head of Specialists, Index Investment Strategy

S&P Dow Jones Indices

From a U.S. equities perspective, the first month of 2026 started on a different trajectory compared to years past. S&P 500® performance trailed much of the rest of the world (as measured by the S&P World Ex-U.S. Index), and within the U.S., the performance of the S&P 500 Information Technology (“U.S. Tech”) ranked in the bottom half among all 11 GICS® sectors. Fears of trade tensions tied to geopolitics, rising worries of an AI bubble and tepid economic datapoints dragged on overall market performance, with The 500® falling for much of the month before finishing up 1.5%, while U.S. Tech fell 1.7%.

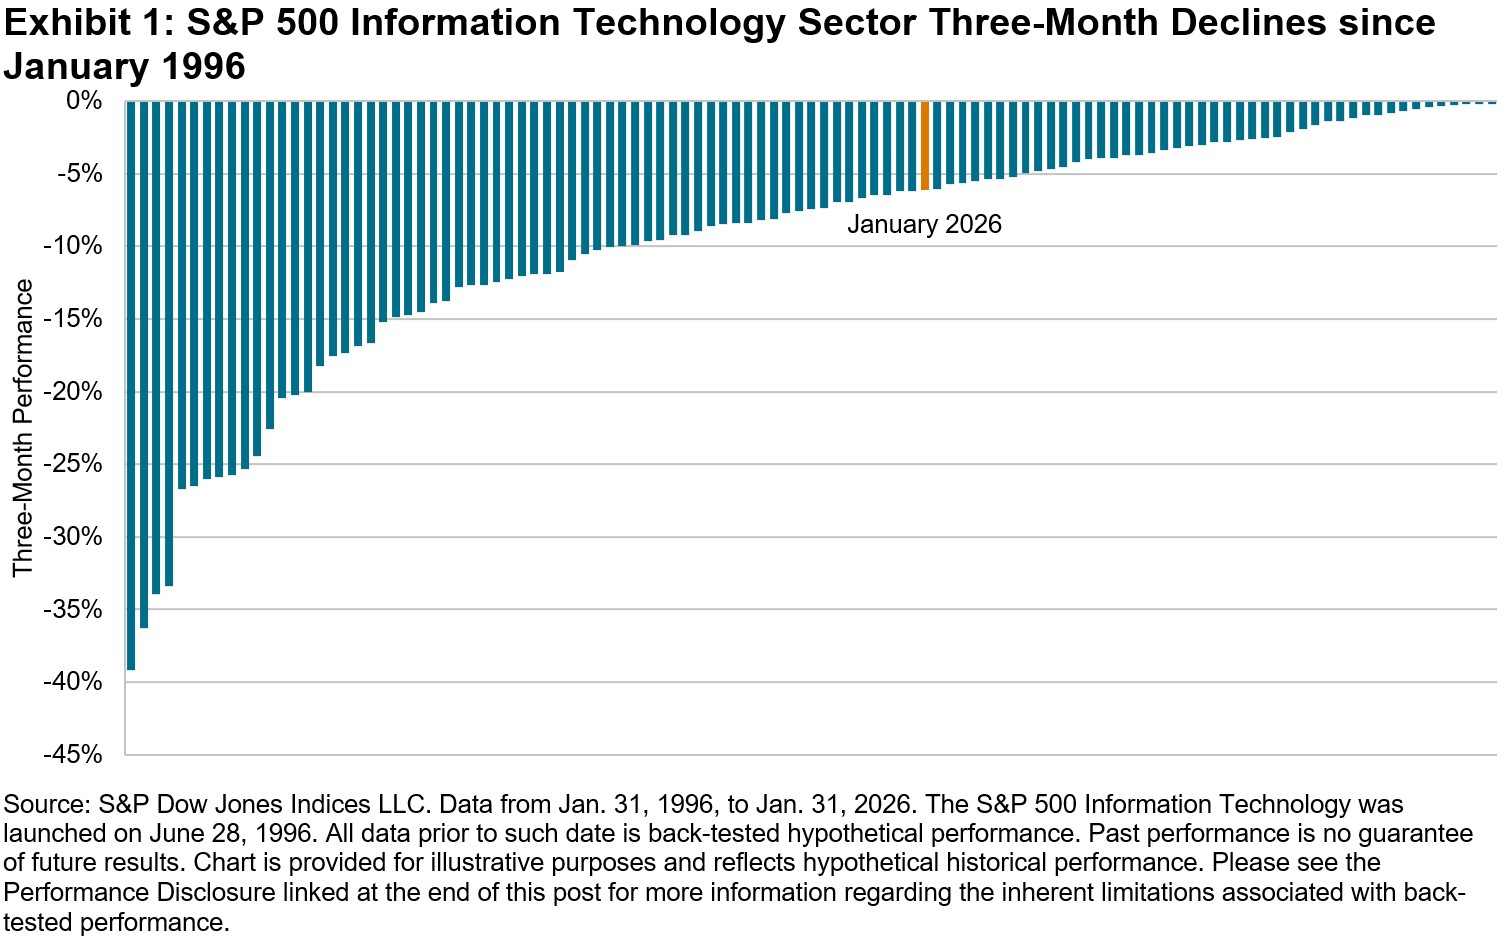
It was just over three months prior that U.S. Tech had reached an all-time high in October 2025, before sliding down 6.1% over the three months ending in January. U.S. Tech’s latest decline is noteworthy, but certainly not unprecedented, as the sector produced negative three-month performance 109 times over the last 30 years, with more than half of those periods even worse than January’s result, as shown in Exhibit 1.

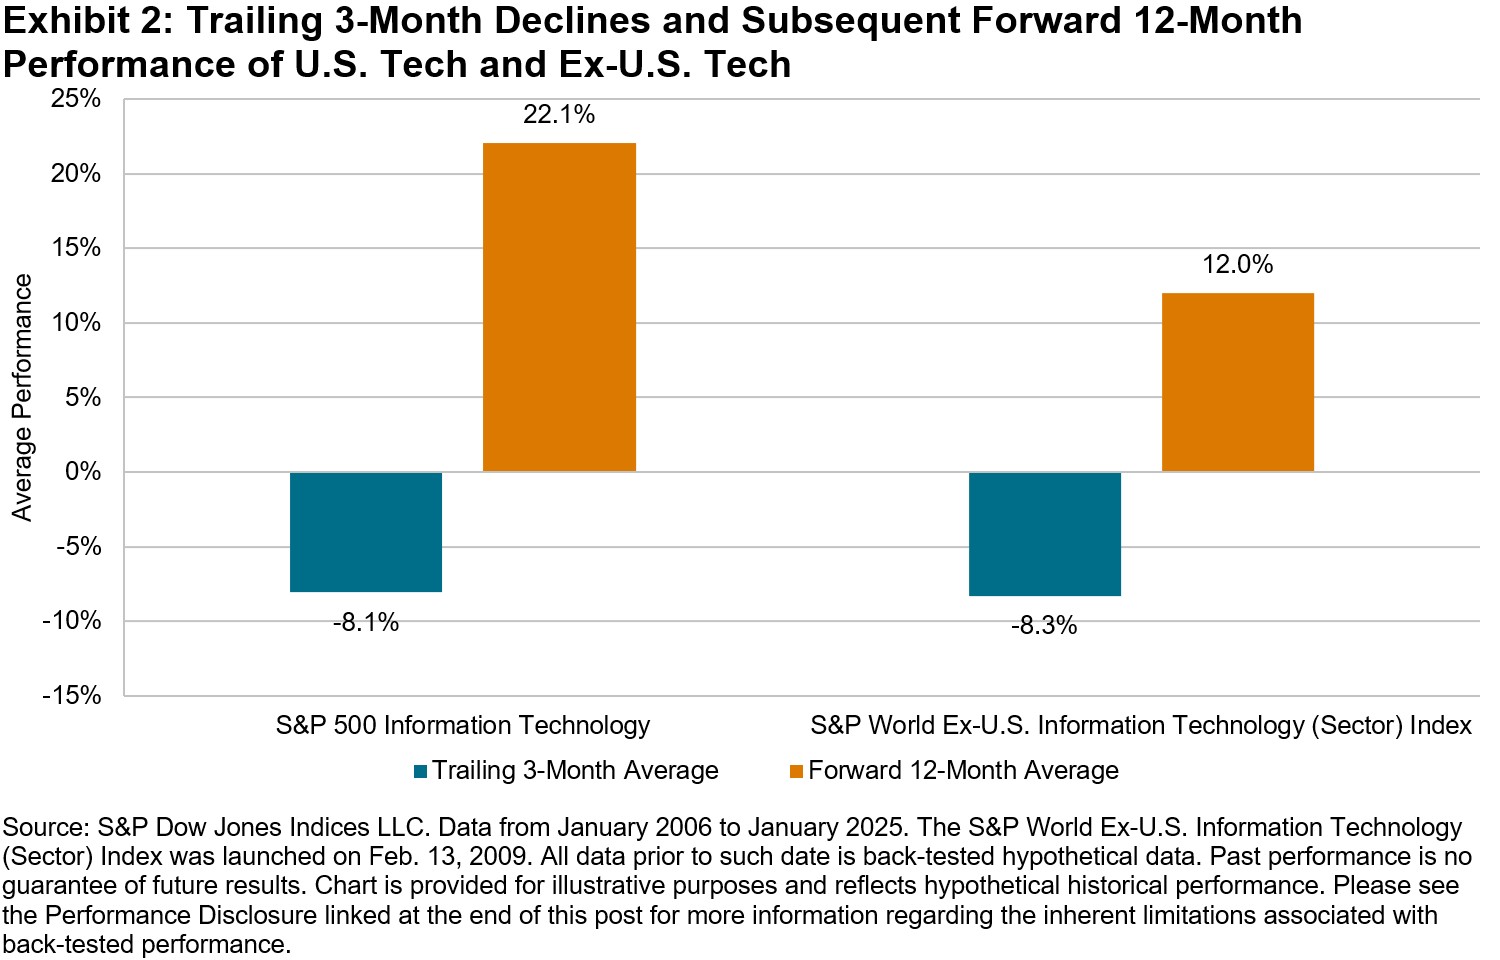
One might fairly ask what happened to U.S. Tech after previous three-month declines, and how its performance compared to the same sector around the rest of the world at those times. As it turns out, Information Technology showed resilience worldwide, but particularly so in the U.S. Exhibit 2 plots performance of two sector indices, the S&P 500 Information Technology and the S&P World Ex-U.S. Information Technology (Sector) Index (“Ex-U.S. Tech”) over 12-month periods after 3-month declines since January 2006. Following periods of three-month declines, U.S. Tech typically rebounded at a greater magnitude than did Ex-U.S. Tech, increasing an average of 22.1% over the subsequent 12 months and outperforming The 500 by 7.6%, while 3-month drops in Ex-U.S. Tech were followed by average total performance of 12.0% and 1.5% excess performance versus the S&P World Ex-U.S. Index.

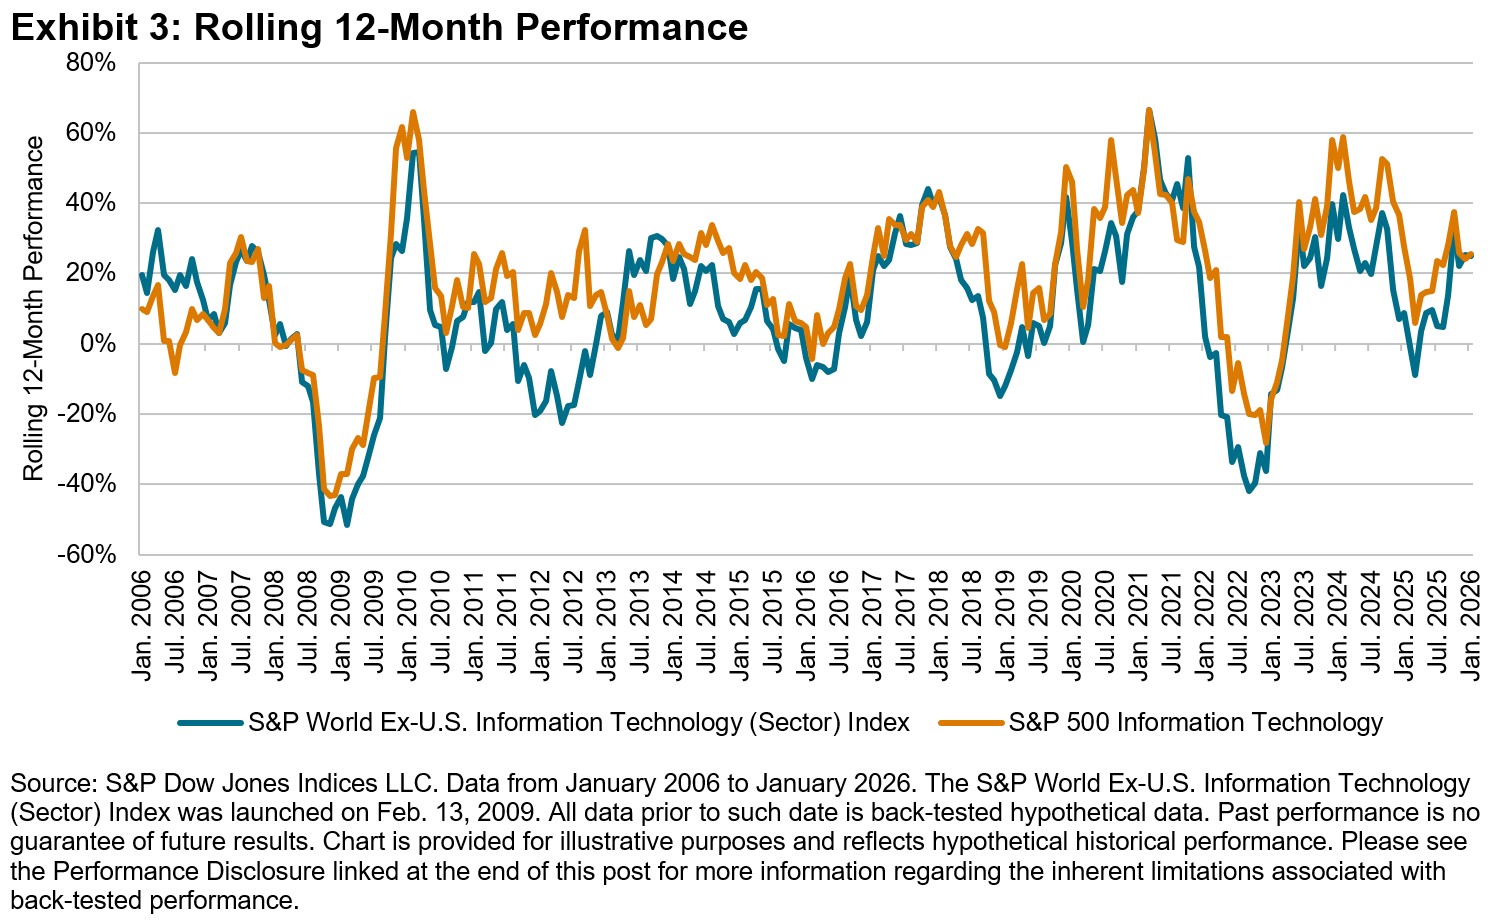
Shifting focus away from periods of decline and instead evaluating all periods in the last 20 years, we find that U.S. Tech often tended to lead its global counterparts. During 12-month periods when U.S. Tech was in an outperformance cycle relative to The 500, it simultaneously outperformed the rest of the world (as measured by the S&P World Ex-U.S. Index) 91% of the time, as shown in Exhibit 3. In such periods, U.S. Tech also generated higher performance than Ex-U.S. Tech 88% of the time.

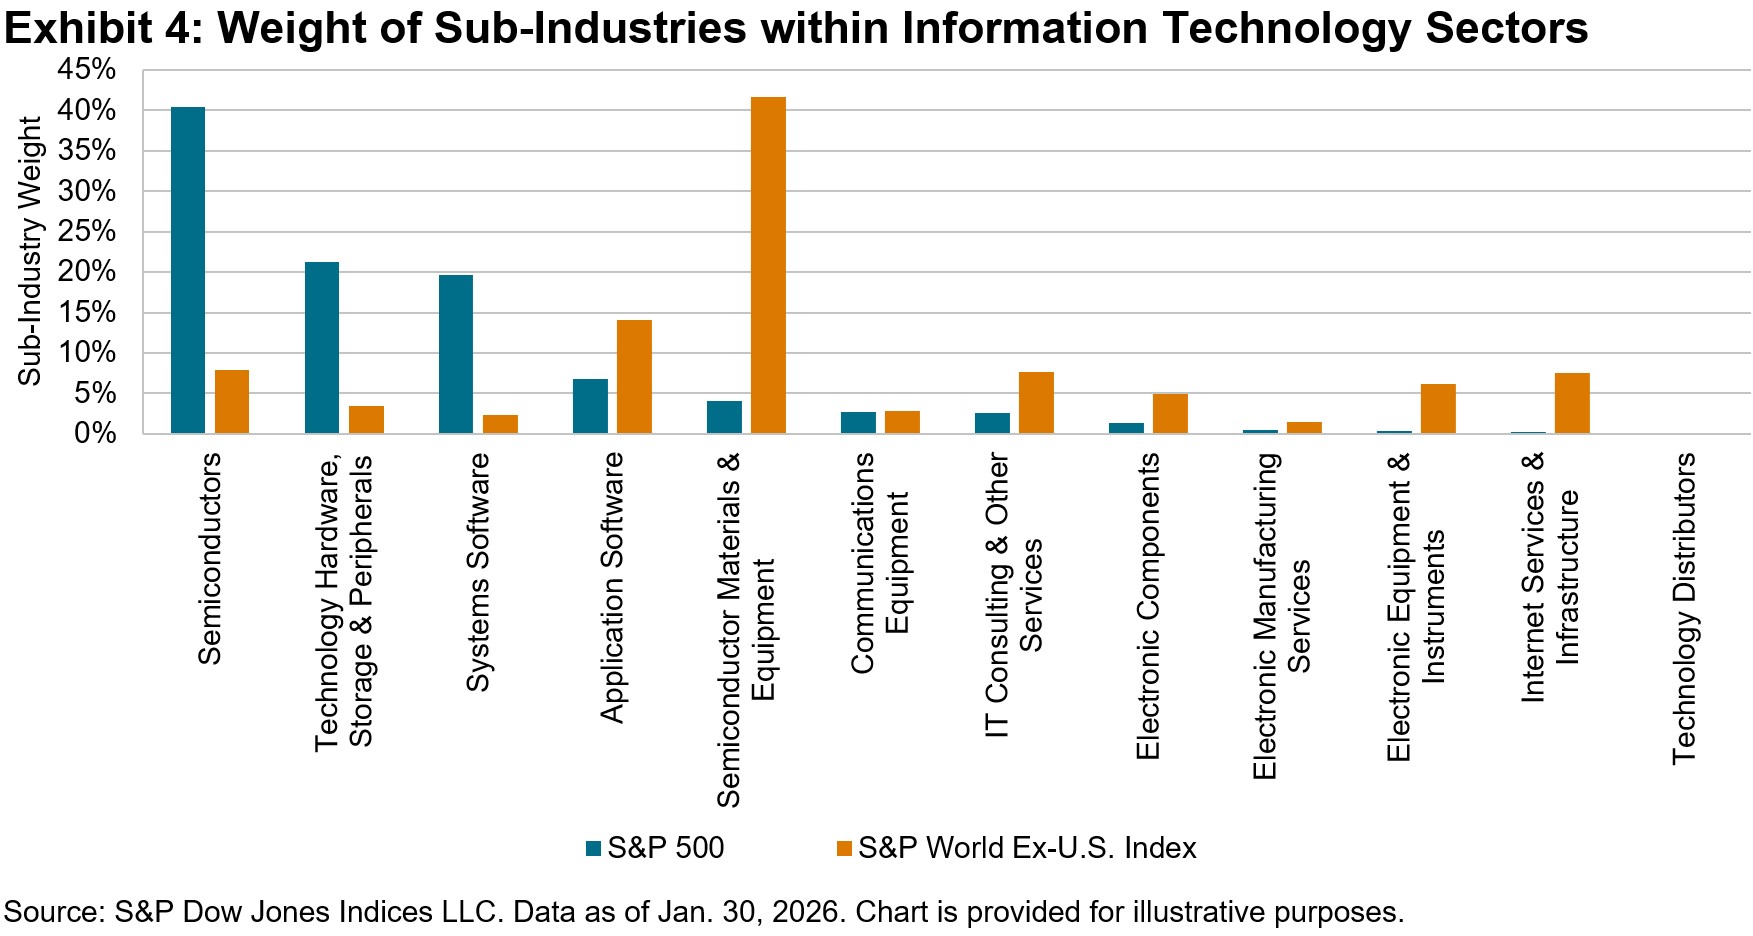
While sector membership explains a significant portion of constituent performance across different parts of the market and the economic cycle, variations in same-sector performance across geographies reveal the importance of understanding more granular constituent categorizations. In Exhibit 4, we begin to uncover potential drivers of U.S. Tech performance relative to its Ex-U.S. Tech counterpart, illustrating significant differences in GICS sub-industry weights. Specifically, the Semiconductors sub-industry comprised over 40% of U.S. Tech’s weight, yet only 8% of Ex-U.S. Tech’s, which held its largest weight (42%) in Semiconductor Materials & Equipment. Among the two sub-industries, Semiconductors significantly outperformed, aided by greater margins and pricing power for firms further down the AI chip value chain.

History has shown that periods of U.S. Tech underperformance have often been followed by periods of relative strength, and drivers of such sector resilience can be better understood through considering additional dimensions of geography and sub-industry composition. Like other sectors, Information Technology continues to evolve and reveal new clues that help to understand and navigate global markets.

Notes:

The S&P World Index comprises S&P World Ex-U.S. Index and S&P United States LargeMidCap.

The author thanks Tom Olins for his research contributions to this blog.

The posts on this blog are opinions, not advice. Please read our Disclaimers.

S&P High Yield Dividend Aristocrats Expands with Eight New Members in the Latest Reconstitution

Contributor Image
Wenli Bill Hao

Director, Factors and Dividends Indices, Product Management and Development

S&P Dow Jones Indices

The S&P High Yield Dividend Aristocrats® (S&P HYDA) includes large-, mid- and small-cap U.S. companies that have consistently raised their dividends for at least 20 consecutive years. This blog will examine the recent rebalance of the S&P HYDA, detailing the changes in its constituents and their distribution by size and sector. Additionally, we will highlight the dividend increase history of these constituents.

The index completed its annual reconstitution on Jan. 30, 2026, adding eight new members into this distinguished group (see Exhibit 1). With these additions and the removal of two constituents, the total number of index constituents increased from 149 to 155, further enhancing its diversification and liquidity.

Market-Cap Breakdown

As of the latest rebalance, the S&P HYDA comprises 155 constituents: 102 stocks from the S&P 500®, 38 from the S&P MidCap 400® and 15 from the S&P SmallCap 600®. Notably, the S&P HYDA has a greater weight in the mid- and small-cap segments compared to the S&P Composite 1500®, as illustrated in Exhibit 2.

Sector Breakdown

With 155 constituents, the S&P HYDA features representation from all 11 GICS® sectors: 35 constituents from Industrials, 29 from Financials, 21 from Utilities, 20 from Consumer Staples, 16 from Materials and 34 from the remaining 6 sectors.

As shown in Exhibit 3, the S&P HYDA is notably underweight in the Information Technology (-25.0%), Communications Services (-7.1%) and Consumer Discretionary (-6.1%) sectors. In contrast, the index is substantially overweight in Consumer Staples (12.3%), Utilities (11.9%) and Industrials (9.2%).

A Long History of Dividend Growth

Exhibit 4 presents the number of constituents that have increased their dividends in five-year increments. Roughly 33% of constituents have raised their dividends for 20 to 24 years, while 35% have done so for 25 to 44 years. Additionally, 32% of constituents have achieved this for 45 years or more. These track records highlight these companies’ longstanding ability and commitment to consistently increase dividends over multiple decades.

The posts on this blog are opinions, not advice. Please read our Disclaimers.

A New Generation of Buyback Indices: Introducing the S&P 500 Buyback Aristocrats Index

Contributor Image
Rupert Watts

Head of Factors and Dividends

S&P Dow Jones Indices

The latest addition to the S&P Aristocrats Index Series, the S&P 500® Buyback Aristocrats Index represents a new generation of buyback indices. This index tracks companies that have consistently reduced their common shares outstanding for at least 10 consecutive years—a rare achievement that signals disciplined capital management, financial strength and a steadfast commitment to shareholder interests.

Just as the S&P 500 Dividend Aristocrats® identifies companies with a proven history of growing dividend payments, the S&P 500 Buyback Aristocrats Index recognizes firms that demonstrate sustained dedication to share repurchases, with a particular emphasis on net share count reduction. This parallel underscores a core principle: quality is not defined by isolated actions, but by persistent behavior over time. By focusing on long-term buyback consistency, this index showcases companies focused on creating lasting value with a proven track record of enhancing shareholder returns.

A Differentiated Buyback Strategy

As of Dec. 31, 2025, the S&P 500 Buyback Aristocrats Index comprises 64 companies. Unlike traditional buyback strategies that rely on a single point-in-time assessment, this index emphasizes consistency across market cycles. This distinction is significant, as companies that regularly execute net buybacks tend to exhibit higher quality and more resilient earning power. Spreading buyback activity over multiple periods also helps address a common criticism of repurchases—that they are often poorly timed—thus resulting in a more balanced and reliable approach to capital return.

Long-Term Outperformance

Back-tested data shows that the S&P 500 Buyback Aristocrats Index has outpaced the S&P 500 by 2.46% on an annualized basis since June 30, 2000. This long-term outperformance makes sense: as companies reduce their shares outstanding, each remaining share represents a larger claim on future earnings. Moreover, a sustained decrease in shares outstanding often signals a company’s ability to consistently generate strong cash flow and management’s ongoing commitment to returning capital to shareholders.

Defensiveness over the Business Cycle

The defensive characteristics of the S&P 500 Buyback Aristocrats Index are particularly evident during periods of market stress. The index exhibited a lower downside capture than the S&P 500 and as shown in Exhibit 4, has demonstrated resilience during select drawdown events.

Like many factor-based strategies, performance relative to the benchmark may vary across macroeconomic regimes. Notably, across its back-tested history, the S&P 500 Buyback Aristocrats Index has outperformed during periods of rising inflation, as well as in environments characterized by slowing growth and declining inflation—conditions often associated with the later stages of the business cycle.

Conclusion

The S&P 500 Buyback Aristocrats Index stands out among buyback strategies by requiring constituents to demonstrate a reduction in shares outstanding for at least 10 consecutive years. This stringent requirement has historically driven outperformance and defensive qualities relative to its benchmark throughout its back-tested history.


1 For the full methodology, please refer to the S&P 500 Buyback Aristocrats Index Methodology.


The posts on this blog are opinions, not advice. Please read our Disclaimers.

S&P 500 FC 7% Index: The Gold Standard of Indices Meet’s Today’s Technology

Look inside the S&P 500 FC 7% Index, an innovative index that seeks to provide optimized exposure to the S&P 500 via BofA’s Fast Convergence technology by using intraday volatility signals to adjust component allocations to systematically increase stability and limit exposure to large drawdowns.

The posts on this blog are opinions, not advice. Please read our Disclaimers.

Tech Tantrums

Contributor Image
Anu Ganti

Head of U.S. Index Investment Strategy

S&P Dow Jones Indices

The past week has been turbulent for Big Tech, with disappointing reactions to earnings from Microsoft, Amazon and Alphabet, while Apple and Meta emerged relatively unscathed after announcing their results. Concerns about growing capital expenditures on AI1 among these giants have led to renewed bubble fears among market participants.

In an environment characterized by such jitters, we would expect performance among mega caps to suffer, and it indeed has, with the S&P 500® Top 10 Index down 5% relative to the S&P 500 YTD as of Feb. 6, 2026. What is more surprising though is that the realized volatility of the top 10 index, while still higher than The 500®, has declined in relative terms.

Volatility manifests itself in both dispersion and correlation, each of which we explore in Exhibit 2 for the S&P 500 Top 10 Index to offer some perspective. Although the dispersion of the top 10 index has risen so far this year, correlations have declined steadily, which has helped dampen the realized index volatility of the mega caps. This is in contrast to early April 2025, when correlations spiked to 0.8, while dispersion remained relatively low, as Tech titans were buffeted across the board by trade-related tensions.

Looking under the hood specifically at those mega-cap companies belonging to the famous Magnificent 7 moniker, which span across the Information Technology, Communication Services and Consumer Discretionary sectors, can help further disentangle these volatility dynamics. Exhibit 3 illustrates that performance among the group has diverged over the last year, leading to a 75% cumulative performance differential between outperforming Alphabet and underperforming Amazon since Dec. 31, 2024. Only Alphabet and NVIDIA managed to outperform The 500 during this time period.

Only two companies continued to beat the benchmark in January, but the composition of outperformers has shifted to include Alphabet and now Apple, while Amazon and especially Microsoft have been punished, with more than USD 800 billion in market cap erased in the past month from these two companies. These trends are consistent with the rise in dispersion and decline in correlations witnessed in Exhibit 2.

As the market looks ahead to NVIDIA earnings later this month, concerns over Big Tech spending do not appear to be abating. We observe in Exhibit 4 that the implied volatility of the Tech sector is higher relative to The 500 and has been rising. Meanwhile, the implied volatility of The 500 excluding Technology relative to the benchmark has declined sharply. Understanding Tech’s recent tantrums from a volatility lens might help investors navigate these uncertain times.

1 Big Tech’s ‘breathtaking’ $660bn spending spree reignites AI bubble fears – Financial Times

The posts on this blog are opinions, not advice. Please read our Disclaimers.