The past week has been turbulent for Big Tech, with disappointing reactions to earnings from Microsoft, Amazon and Alphabet, while Apple and Meta emerged relatively unscathed after announcing their results. Concerns about growing capital expenditures on AI1 among these giants have led to renewed bubble fears among market participants.
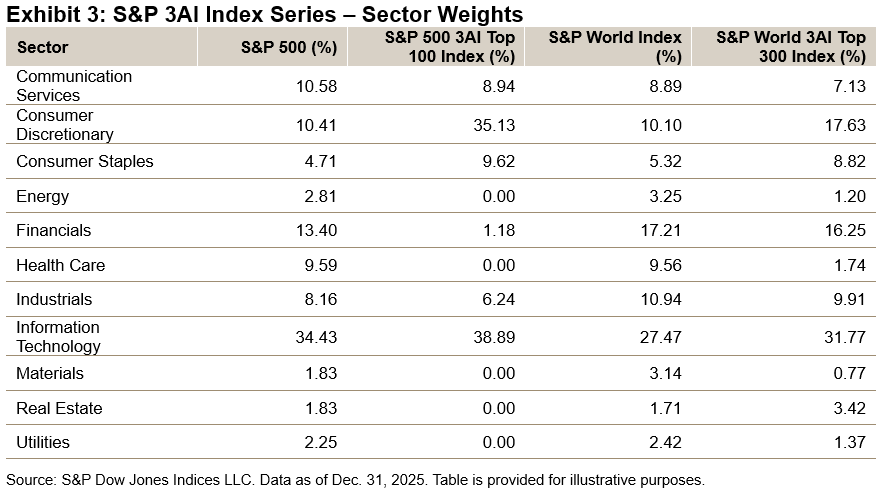
In an environment characterized by such jitters, we would expect performance among mega caps to suffer, and it indeed has, with the S&P 500® Top 10 Index down 5% relative to the S&P 500 YTD as of Feb. 6, 2026. What is more surprising though is that the realized volatility of the top 10 index, while still higher than The 500®, has declined in relative terms.
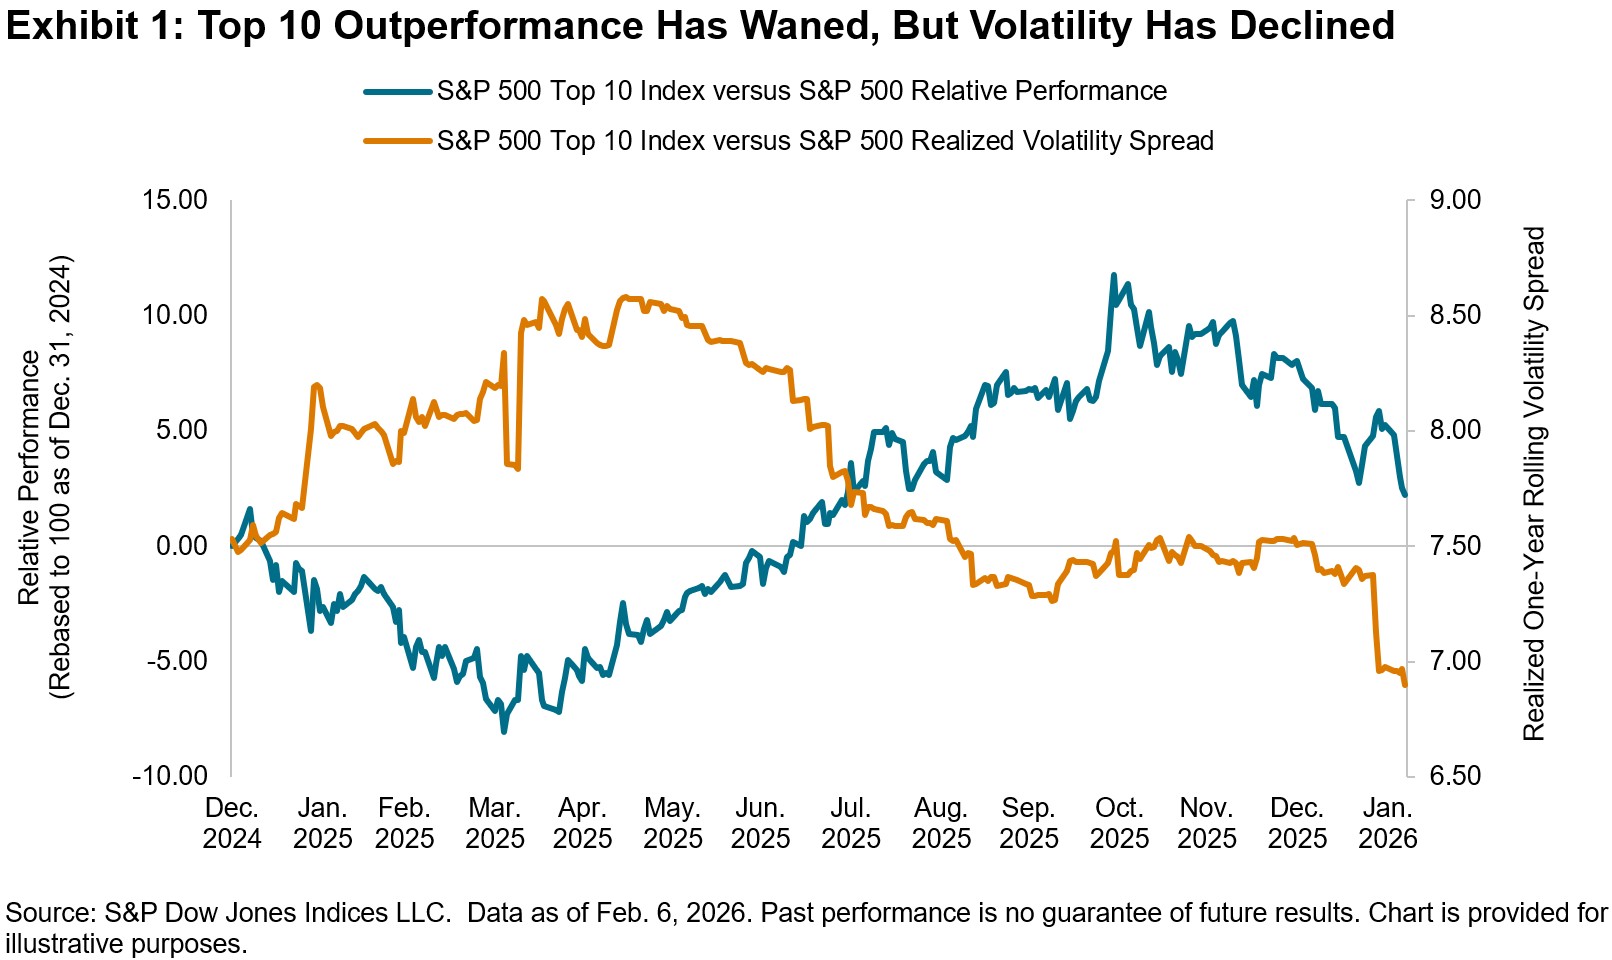
Volatility manifests itself in both dispersion and correlation, each of which we explore in Exhibit 2 for the S&P 500 Top 10 Index to offer some perspective. Although the dispersion of the top 10 index has risen so far this year, correlations have declined steadily, which has helped dampen the realized index volatility of the mega caps. This is in contrast to early April 2025, when correlations spiked to 0.8, while dispersion remained relatively low, as Tech titans were buffeted across the board by trade-related tensions.
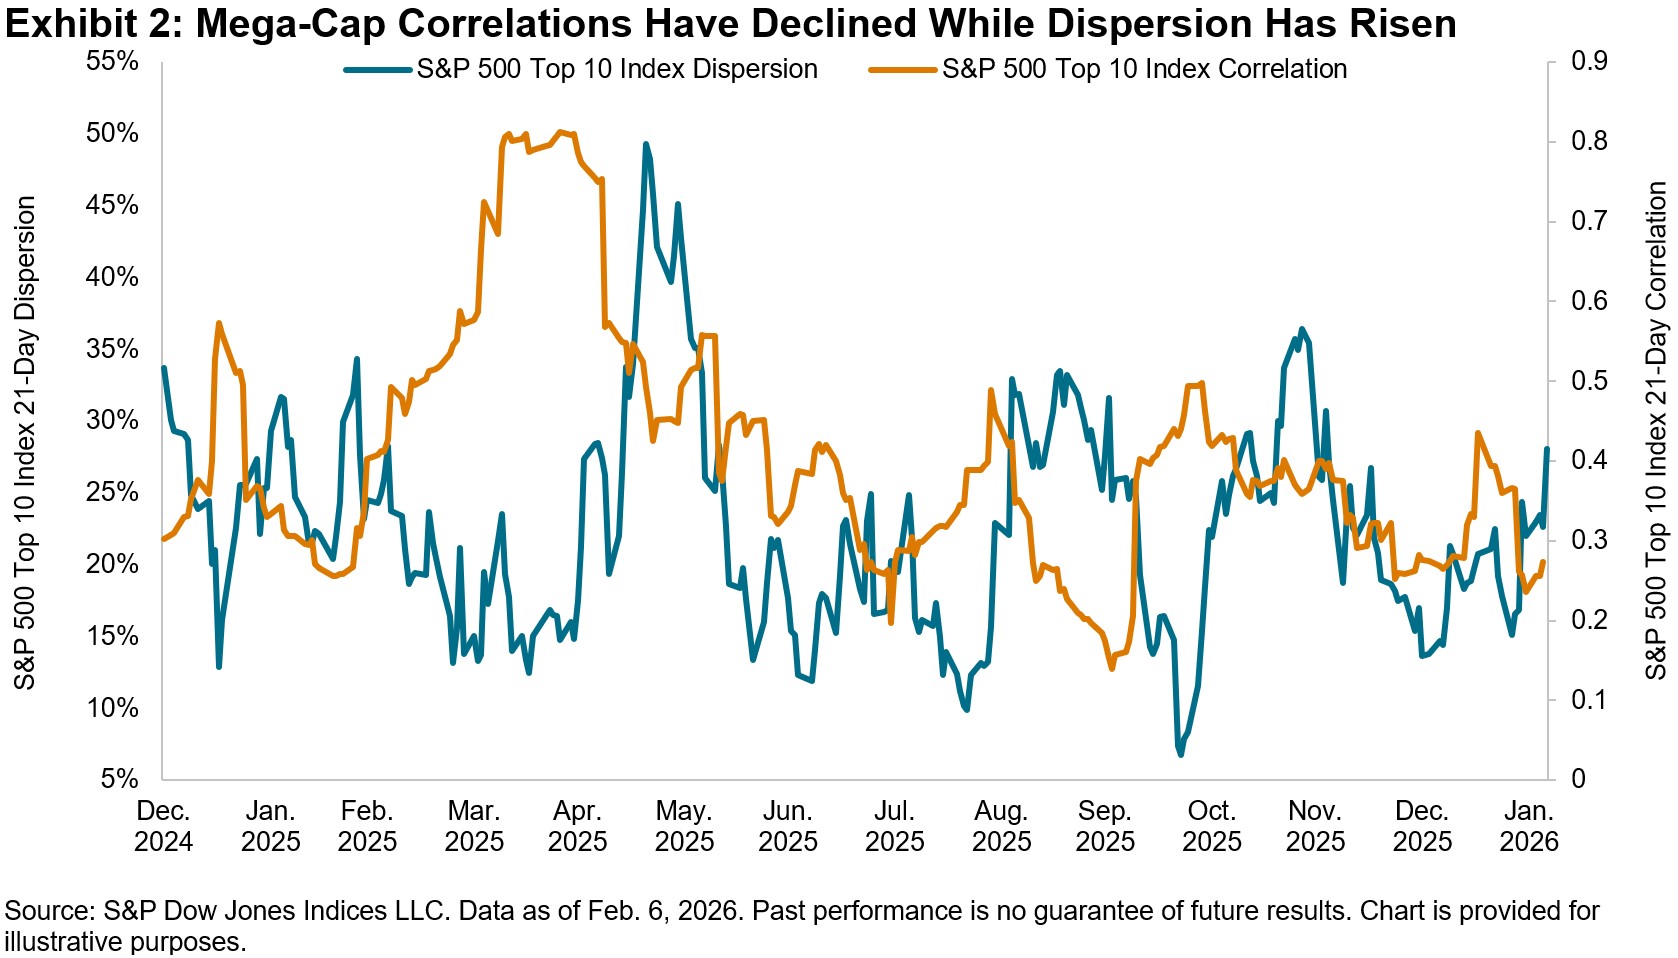
Looking under the hood specifically at those mega-cap companies belonging to the famous Magnificent 7 moniker, which span across the Information Technology, Communication Services and Consumer Discretionary sectors, can help further disentangle these volatility dynamics. Exhibit 3 illustrates that performance among the group has diverged over the last year, leading to a 75% cumulative performance differential between outperforming Alphabet and underperforming Amazon since Dec. 31, 2024. Only Alphabet and NVIDIA managed to outperform The 500 during this time period.
Only two companies continued to beat the benchmark in January, but the composition of outperformers has shifted to include Alphabet and now Apple, while Amazon and especially Microsoft have been punished, with more than USD 800 billion in market cap erased in the past month from these two companies. These trends are consistent with the rise in dispersion and decline in correlations witnessed in Exhibit 2.
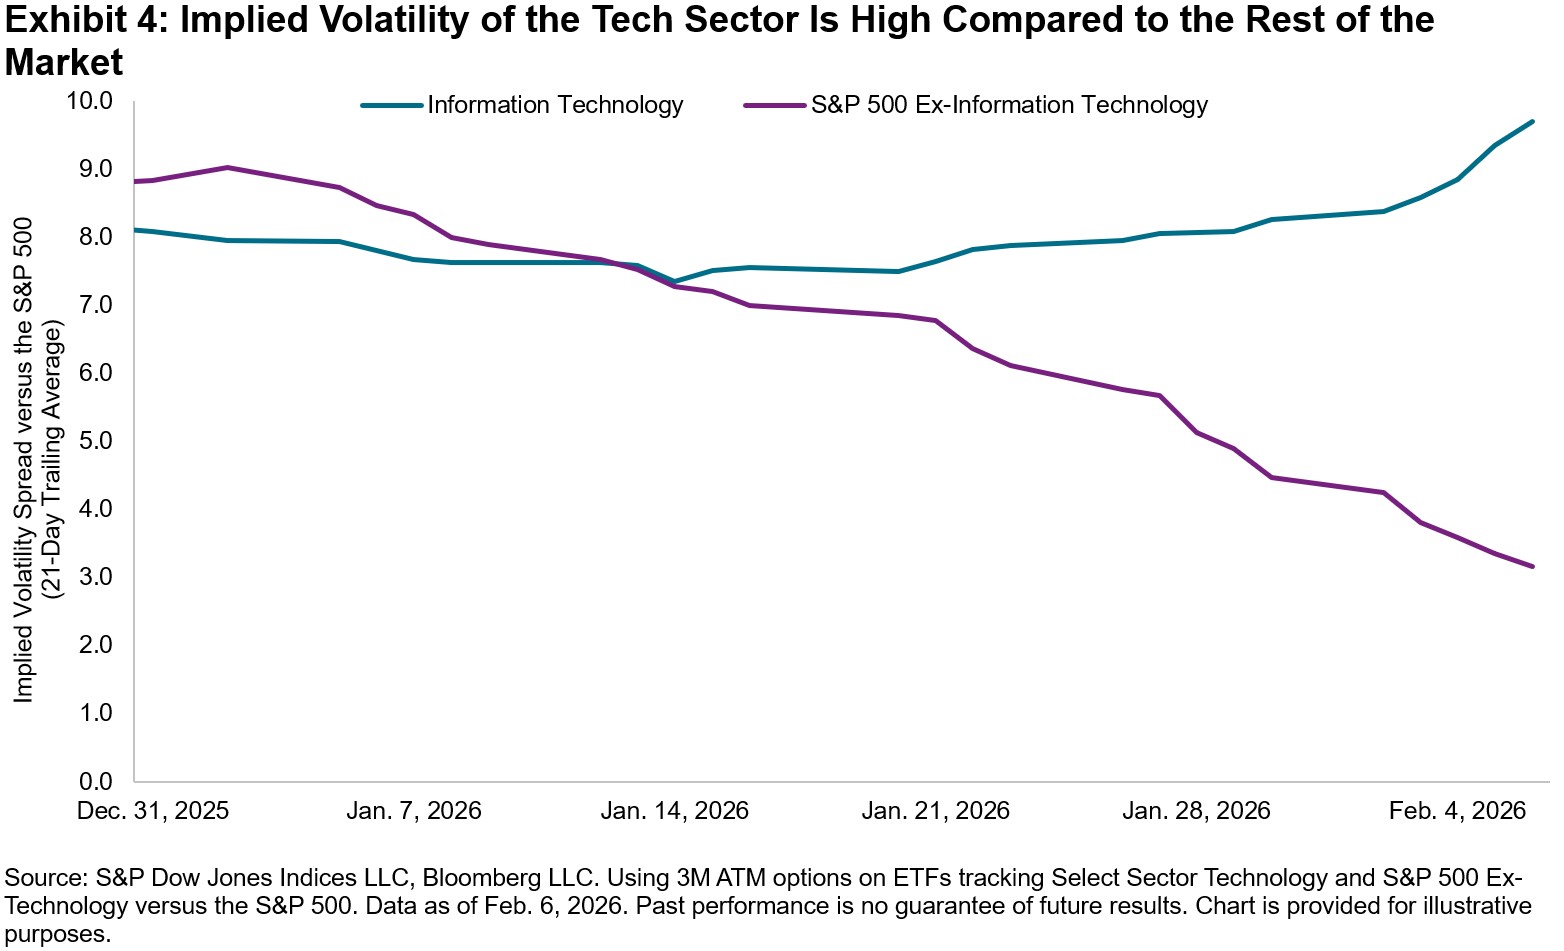
As the market looks ahead to NVIDIA earnings later this month, concerns over Big Tech spending do not appear to be abating. We observe in Exhibit 4 that the implied volatility of the Tech sector is higher relative to The 500 and has been rising. Meanwhile, the implied volatility of The 500 excluding Technology relative to the benchmark has declined sharply. Understanding Tech’s recent tantrums from a volatility lens might help investors navigate these uncertain times.
1 Big Tech’s ‘breathtaking’ $660bn spending spree reignites AI bubble fears – Financial Times
The posts on this blog are opinions, not advice. Please read our Disclaimers.