When selecting a high yield dividend strategy, headline yield matters—but so does the strength of the companies delivering it. The ability to sustain and grow dividends over time often depends on underlying business quality. Companies with strong profitability and resilient cash flows are typically better positioned to increase payouts and support long-term price performance.
To focus on this balance, the S&P Global Dividend 100 Index selects companies using a composite score that blends two dividend metrics with two measures of quality.
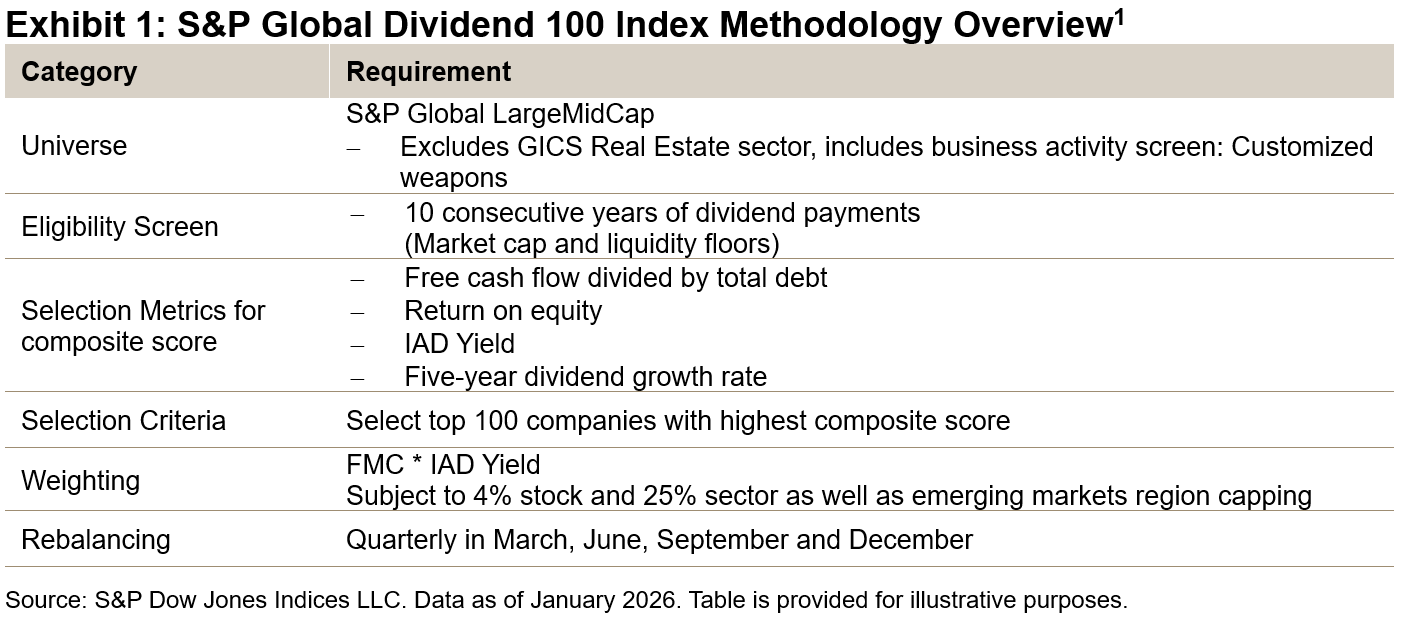
Methodology Overview
The methodology begins with the S&P Global LargeMidCap as the index universe, first screening to retain companies that have paid dividends for at least 10 consecutive years, then removing those with a below-median dividend yield. From the remaining subset, the top 100 companies are selected based on a composite score combining dividend yield, dividend growth, return on equity (ROE) and the ratio of free cash flow (FCF) to total debt.
Selected constituents are weighted by float market cap (FMC) times dividend yield, helping balance liquidity with enhanced income. To help reduce concentration risk and support diversification, individual stocks are capped at 4% and sector weights are limited to 25%.
Back-Tested Performance Overview
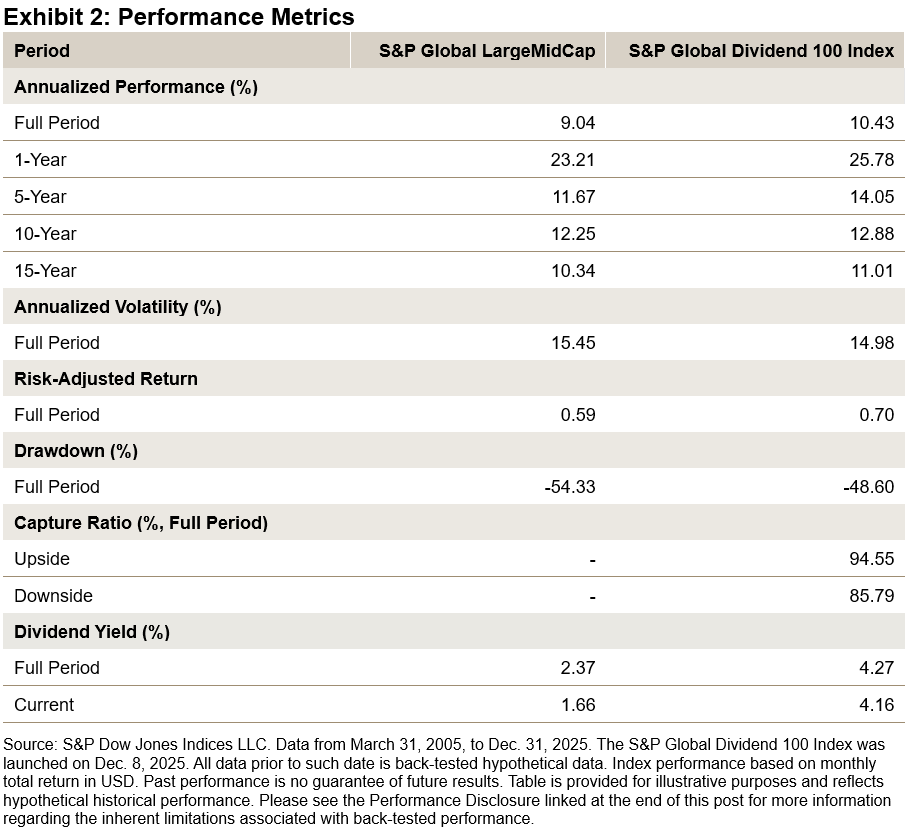
The S&P Global Dividend 100 Index has outperformed the benchmark over the long- and short-term back-tested period, with higher risk-adjusted returns and significantly higher long-term dividend yields. The defensiveness of the dividend index can be seen in the lower drawdown and downside capture, while still participating strongly in rising markets.
Dividend Yield
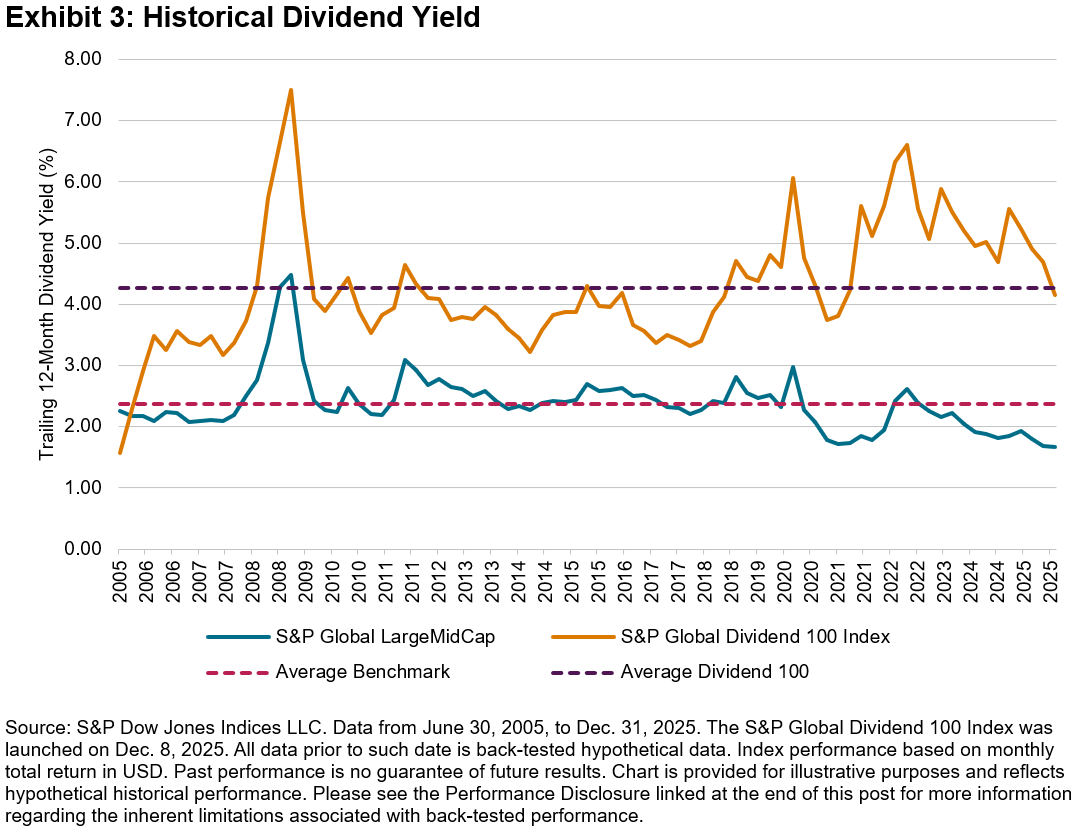
As of Dec. 31, 2025, the historical average long-term dividend yield for the S&P Global Dividend 100 Index was 4.27% versus 2.37% for the benchmark, a difference of 190 bps. Interestingly, the differential between the two current dividend yields was 250 bps as of Dec. 31, 2025, with the S&P Global Dividend 100 Index anticipating a dividend yield of 4.16%.
Dividend Growth
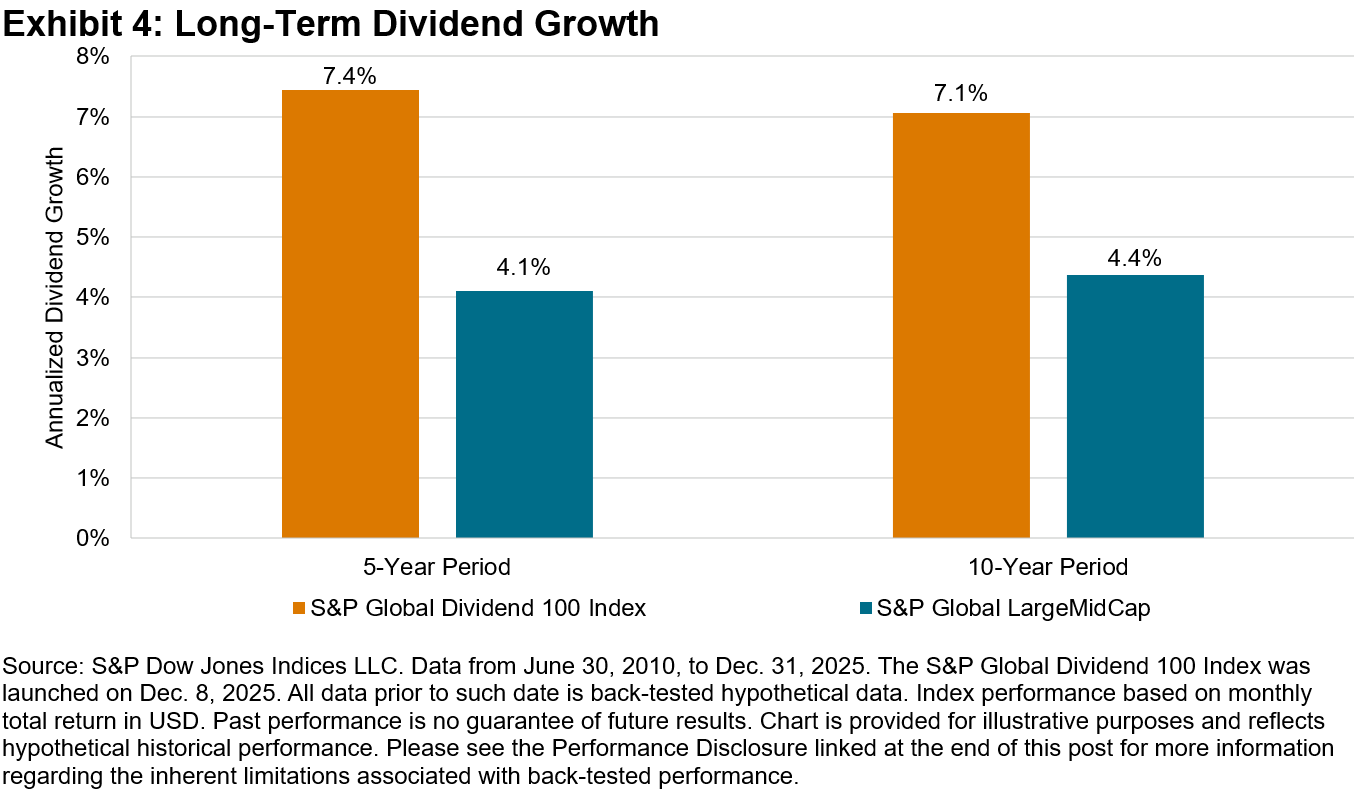
Growing dividends can help preserve purchasing power during periods of elevated inflation. During the back-tested period, the S&P Global Dividend 100 Index showed dividend growth of over 7% across both the 5- and 10-year periods (see Exhibit 5), compared with approximately 4% for the broader benchmark. This stronger growth profile suggests that income levels may have been more resilient during the higher inflation experienced in 2022 and 2023. These outcomes reflect the index’s methodology, which incorporates both dividend growth and quality fundamentals within the composite scoring framework.
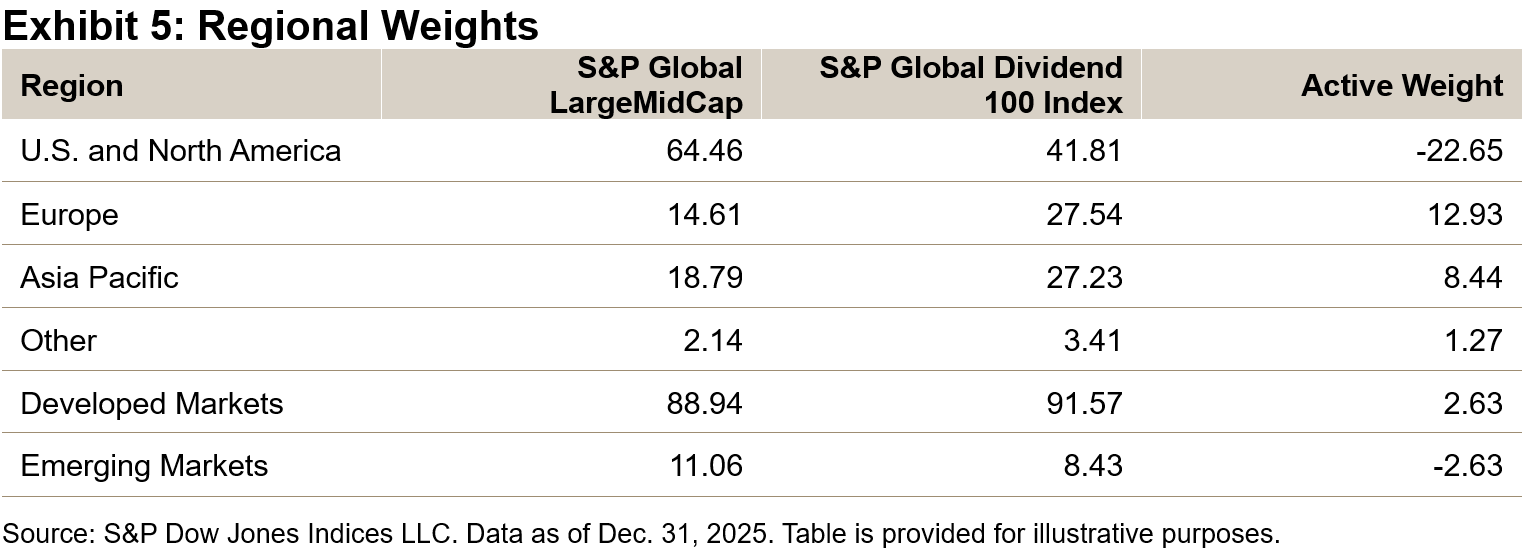
Country/Region Breakdown Insights
As of Dec. 31, 2025, the S&P Global Dividend 100 Index displayed a more balanced regional mix relative to the benchmark. Europe and the Asia‑Pacific region each accounted for roughly 27 % of the index, while the U.S. and North America represented about 41.8 %—approximately a 20 % underweight versus the benchmark.
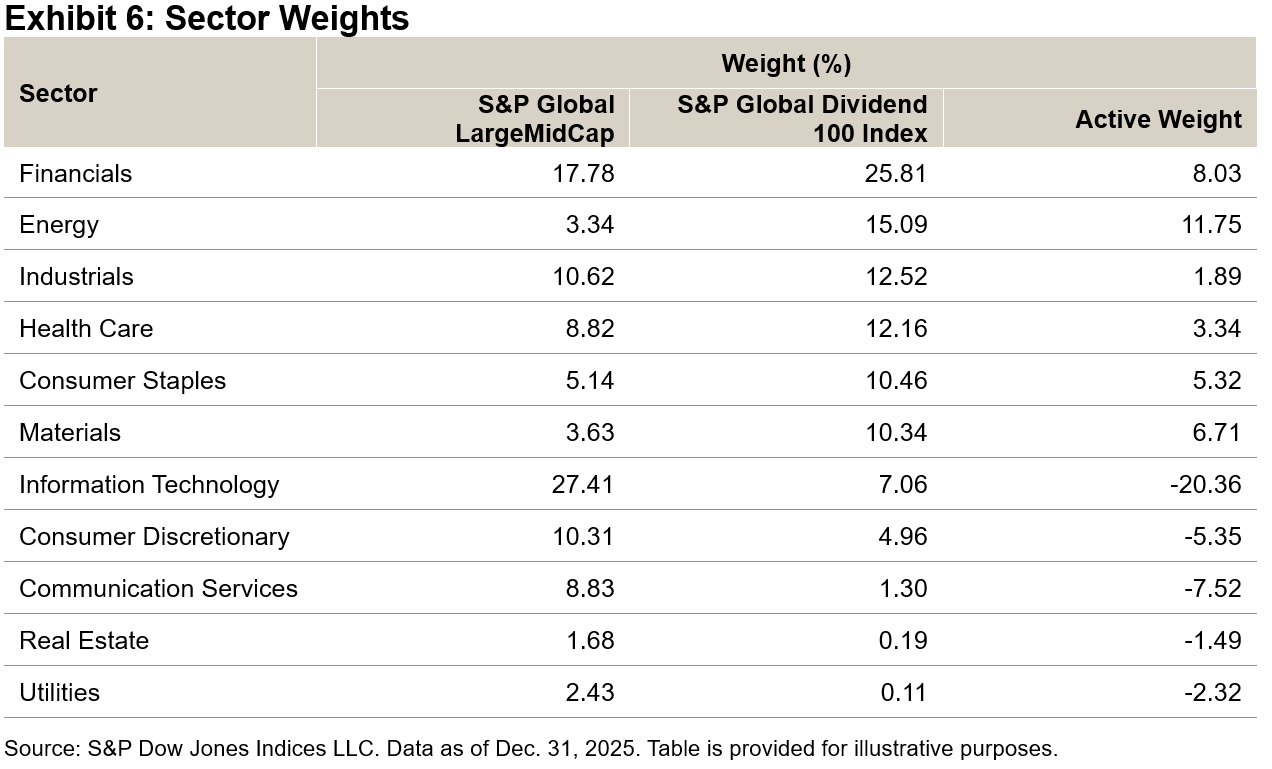
Sector Breakdown Insights
Exhibit 7 illustrates that the S&P Global Dividend 100 Index had the largest sector overweights in Energy and Financials as of Dec. 31, 2025. While still underweight in the Information Technology sector overall, the S&P Global Dividend 100 Index had a much higher weight in this sector than its global dividend index peers. This is due to the quality metric within the selection scoring, which screens for higher quality companies with dividend prospects within the sector.
Conclusion
The long-term back-tested performance of the S&P Global Dividend 100 Index highlights that the rules-based methodology prioritizes high dividend yield, consistent dividend growth and strong fundamentals. The index has historically shown relatively high risk-adjusted returns versus the benchmark, robust dividends and defensive qualities. By anchoring the selection of high yield stocks in the fundamental strength of companies, the index has also demonstrated robust dividend growth, which could help to preserve purchasing power.
1 For the full methodology, please refer to the Dow Jones Dividend Indices Methodology.
The posts on this blog are opinions, not advice. Please read our Disclaimers.