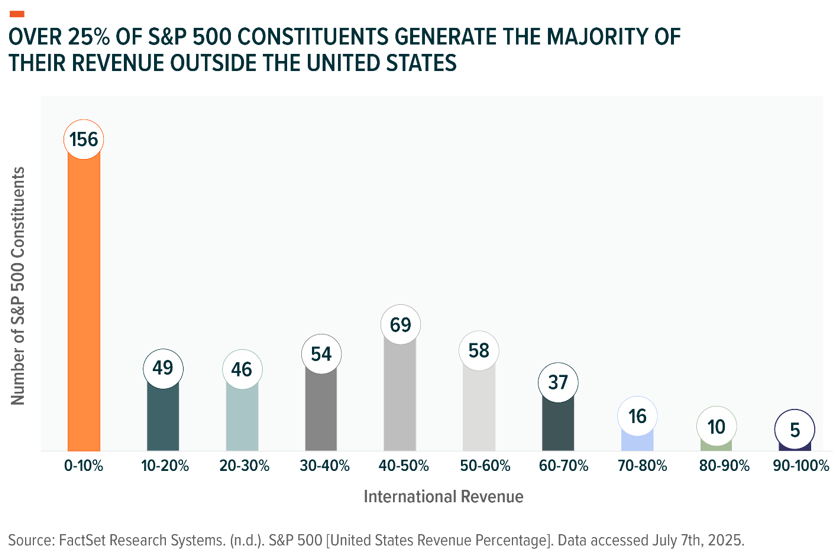
With global fragmentation accelerating and geopolitical risks rising, the traditional assumptions underpinning U.S. equity investing may be due for a fresh look. While the S&P 500® has long served as the cornerstone for broad-based U.S. market exposure, globalization has reshaped the revenue profile of many constituents. Today, more than a quarter of the companies in the index generate the majority of their revenue outside the U.S.1
In response, S&P Dow Jones Indices LLC (S&P DJI) has created two newly innovative benchmarks that aim to refine how S&P DJI measures U.S. equity large-cap companies: the S&P 500 U.S. Revenue Leaders Index and the S&P 500 U.S. Revenue Market Leaders 50 Index.
Reassessing Traditional Market Exposure
Globalization was once a tailwind. But increasingly, foreign revenue may introduce hidden risks that can complicate a U.S.-focused investment thesis. Companies with significant overseas exposure may face regulatory uncertainties, operational inefficiencies and currency translation losses that don’t always show up in domicile-based analyses. Moreover, in an environment of rising tariffs and shifting trade alliances, these risks are potentially more realizable.
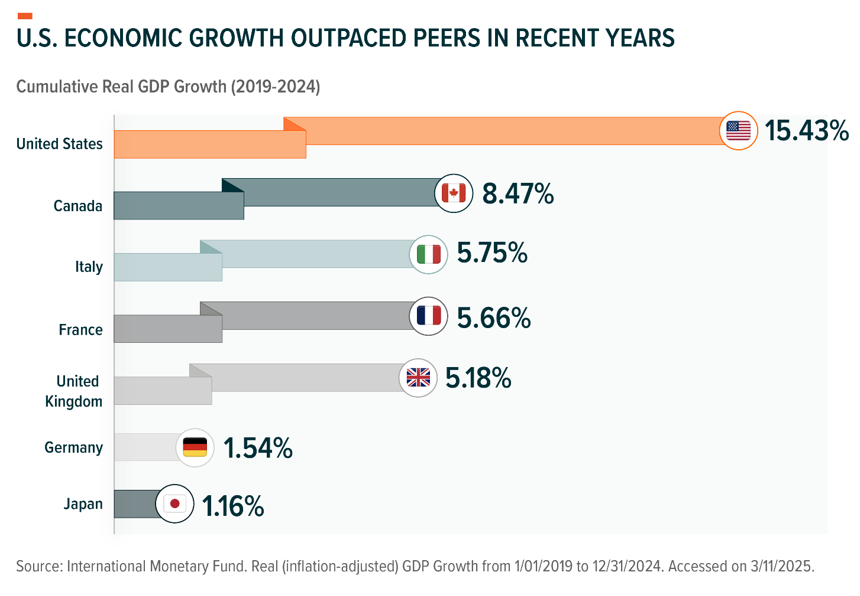
This factor is especially important today, as the U.S. continues to outpace peer economies. Between 2019 and 2024, the U.S. economy grew faster than every other G7 country, driven by a surge in technology investments, infrastructure spending and resilient consumer demand. Investors seeking to align portfolios with this growth may benefit from a more targeted lens.
Two Indices, One Goal: A Stronger U.S. Core
In response to this development, S&P DJI constructed indices that emphasize domestic economic alignment over global reach and licensed those indices to Global X for use with exchange-traded funds.
- The S&P 500 U.S. Revenue Leaders Index selects companies from the S&P 500 that derive the majority of their revenue from within the U.S. The result is a purer proxy for U.S. economic exposure that reduces the impact of foreign revenue streams.
- The S&P 500 U.S. Revenue Market Leaders 50 Index goes a step further. It filters for companies that not only have at least 50% U.S. revenue but also rank highly on a Market Leader Score. This score is based on sustained free cash flow margins, return on invested capital and market share. These three metrics are closely linked to quality and operational resilience, and they provide a factor-based approach to pure-play U.S. equity indexing.
Conclusion
The world of 2025 looks very different from the one in which the S&P 500 was incepted. In this new landscape, the licensing relationship between Global X and S&P DJI offers a timely new measure of U.S. equity investing. This approach recognizes the evolving realities of global markets and the potential strategic value of domestic focus.
These indices aren’t just alternatives; they represent a new framework for investors who want to be precise about what “U.S. exposure” means.
The author would like to thank Scott Helfstein for his contributions to this blog.
1FactSet Research Systems. (n.d.). S&P 500 [United States Revenue Percentage]. Data accessed July 7th, 2025.
Disclosures:
Information provided by Global X Management Company LLC.
Investing involves risk, including the possible loss of principal. Diversification does not ensure a profit nor guarantee against a loss.
The Indexes’ focus on companies that earn the majority of their revenue in the United States may increase sector concentration and reduce exposure to internationally diversified firms, which could cause the Indexes to underperform the broader S&P 500 when foreign-revenue companies outperform. In addition, the Market Leader Score is derived from historical quantitative factors (free cash-flow margins, return on invested capital and market share) that may not predict future performance and can lead to higher turnover and associated costs.
This material represents an assessment of the market environment at a specific point in time and is not intended to be a forecast of future events, or a guarantee of future results. This information is not intended to be individual or personalized investment or tax advice and should not be used for trading purposes. Please consult a financial advisor or tax professional for more information regarding your investment and/or tax situation.
Past performance does not guarantee future results.
The S&P 500 U.S. Revenue Leaders and S&P 500 U.S. Revenue Market Leaders 50 Indices (the “Indices”) are products of S&P Dow Jones Indices LLC or (“S&P DJI”). S&P®, S&P 500®, US 500™, The 500™ are trademarks of Standard & Poor’s Financial Services LLC or its affiliates (“S&P”); Dow Jones® is a registered trademark of Dow Jones Trademark Holdings LLC (“Dow Jones”). These marks have been licensed by S&P DJI and sublicensed for use by Global X for certain purposes. Exchange-traded funds based on the Indices are not sponsored or sold by S&P DJI, Dow Jones, S&P or their respective affiliates and none of such parties make any representation regarding the advisability of investing in any such funds nor do they have any liability for any errors, omissions, or interruptions of the Indices.
The posts on this blog are opinions, not advice. Please read our Disclaimers.