


What do duration, the yield curve and credit trends tell us about the evolving fixed income landscape? S&P DJI’s Anu Ganti and Ben Vörös explore the recent performance of S&P DJI’s iBoxx indices in Europe and highlight the latest innovations in the fixed income indexing toolkit.
The posts on this blog are opinions, not advice. Please read our Disclaimers.Tracking Fixed Income Performance and Innovation
What’s the Role of Sectors and Factors in Concentrated Markets?
Sukuk Market Hits USD 1 Trillion This Summer: What You Should Know
Free Cash Flow as a Proxy for Quality in Europe: Introducing the S&P Europe Quality FCF Aristocrats Index
Advisor Profile: The Rise of the Index-Based Product Power User
Tracking Fixed Income Performance and Innovation
What’s the Role of Sectors and Factors in Concentrated Markets?
Which sectors and factors have shown the strongest performance trends through recent market shifts? S&P DJI’s Ben Vörös joins Anu Ganti to explore the potential of indices to help market participants address concerns around concentration and unpack performance highlights from the first half of 2025.
The posts on this blog are opinions, not advice. Please read our Disclaimers.Sukuk Market Hits USD 1 Trillion This Summer: What You Should Know

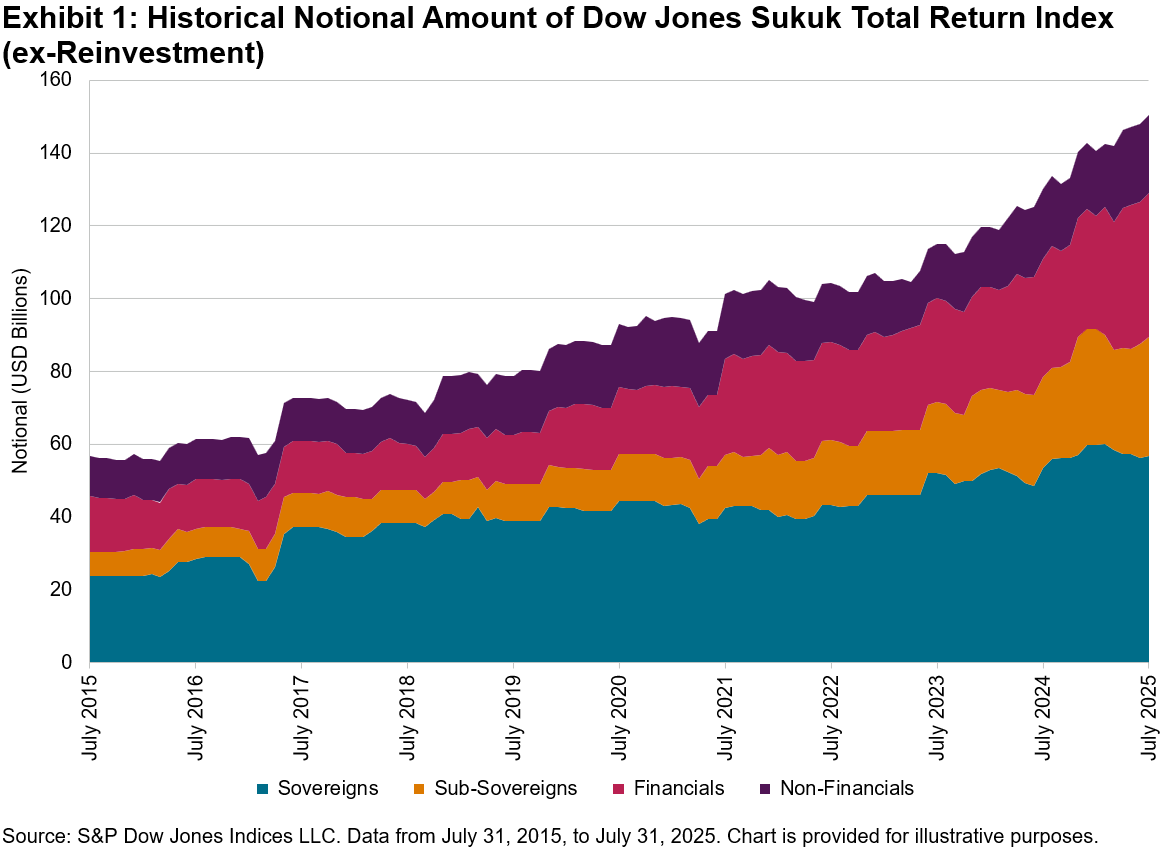
The global sukuk market has surpassed the USD 1 trillion mark in outstanding issuances, achieving a significant milestone that affirms its role within the fixed income sector. The Dow Jones Sukuk Total Return Index (ex-Reinvestment), launched in April 2006, has served as a benchmark for measuring the global investment grade (IG) USD-denominated sukuk market during this journey.
Over the past decade, the notional amount of sukuk included in the index increased by 165%, increasing from USD 57 billion to USD 150 billion. Sub-sovereign issuances surged by 392%, almost doubling their weight in the index from 12% to 22%. Additionally, sovereigns from non-Muslim majority regions, such as Hong Kong and the Philippines, are also tapping into the market, reflecting a growing global interest in sukuk as a financing option.
What Sets Sukuk Apart?
The appeal of sukuk lies primarily in their Shariah compliance, which acts as a catalyst for increased demand and reduced volatility. Most sukuk investors are long-term, buy-and-hold Islamic institutions, including Islamic banks, insurers and pension funds, which are often required to hold sukuk for regulatory or Shariah compliance. This lowers speculative trading, resulting in sustained demand and lower volatility.
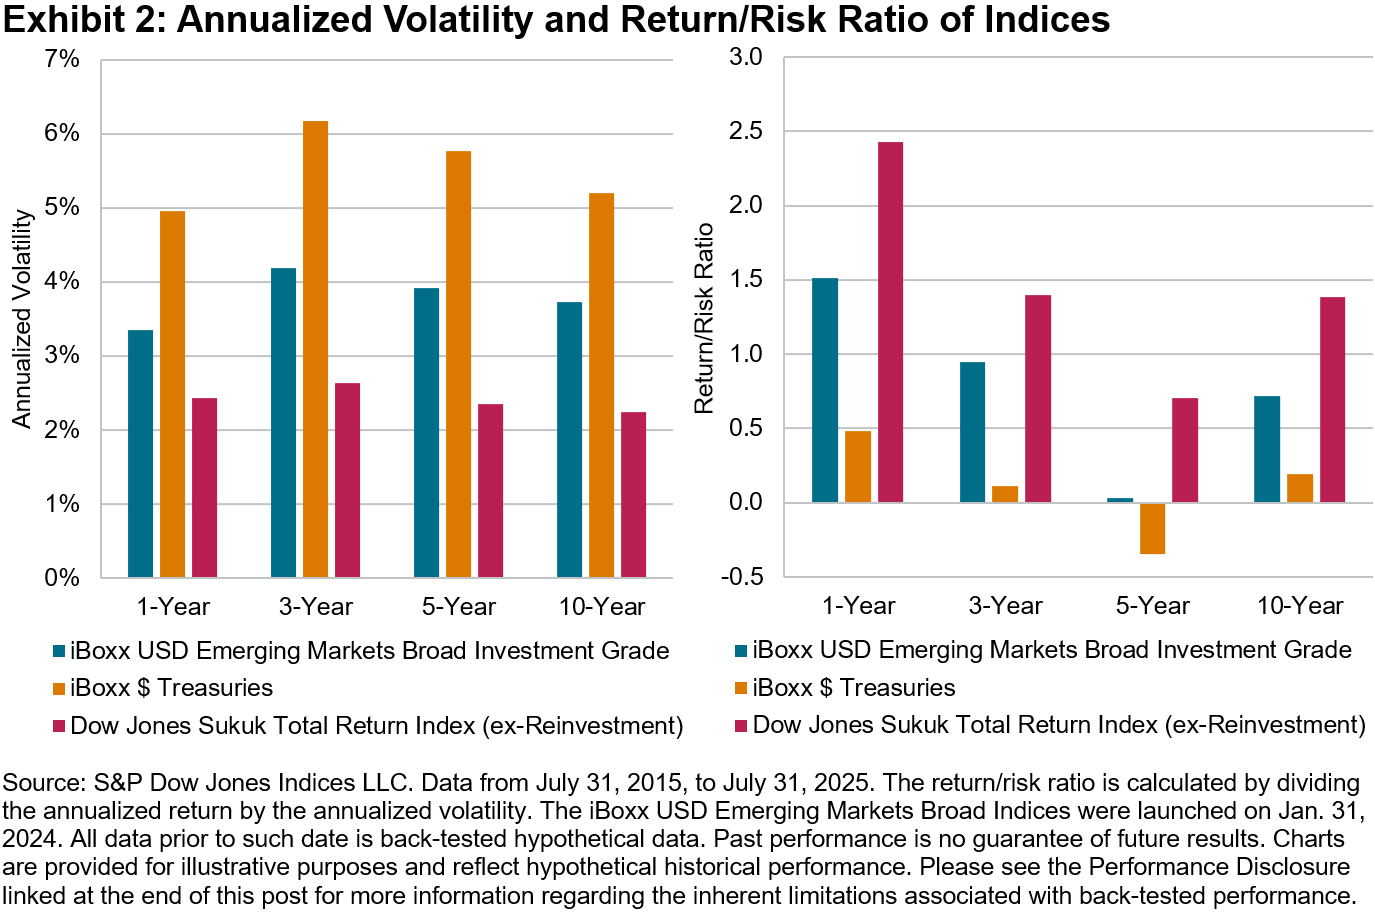
Exhibit 2 compares USD IG Sukuk (the Dow Jones Sukuk Total Return Index (ex-Reinvestment)) with conventional emerging markets debt (the iBoxx USD Emerging Markets Broad Investment Grade) and U.S. Treasuries (the iBoxx $ Treasuries). The sukuk index consistently demonstrated lower volatility and a higher return/risk ratio across all analyzed periods.
A Sovereign-Heavy Market Certified by Shariah Boards with Low Default Rates
Sukuk are typically structured and arranged by Islamic banks or financial institutions with their own Shariah boards to ensure compliance with Islamic principles. The issuance prospectus includes a section detailing the sukuk’s Shariah compliance.
The requirement for Shariah Board certification at issuance, along with the structuring, legal and compliance costs, creates a barrier to entry that tends to favor larger, higher credit-quality entities (such as sovereigns, sub-sovereigns and major corporates) in the sukuk market. Within the Dow Jones Sukuk Total Return Index (ex-Reinvestment), nearly 60% of the IG sukuk were issued by sovereigns and sub-sovereigns. Additionally, S&P Global Ratings reported that only 0.2% of sukuk defaulted between 2000 and 2024.1
The Kingdom of Saudi Arabia Is the Largest Dollar and Local Currency Sovereign Sukuk Issuer
To support economic diversification projects under Saudi Vision 2030, the Kingdom of Saudi Arabia (KSA) has been actively issuing sukuk for financing while developing its local currency debt market. The iBoxx Tadawul SAR Government Sukuk Index tracks SAR-denominated sukuk issued by the KSA, with an outstanding amount of SAR 615 billion (USD 164 billion). As of July 31, 2025, the notional value of USD KSA sukuk in the Dow Jones Sukuk Total Return Index (ex-Reinvestment) was USD 23.7 billion, making the KSA the largest sovereign sukuk issuer in both USD and local currency markets.
Conclusion
In conclusion, the global sukuk market has reached a significant milestone of USD 1 trillion, with robust supply and demand dynamics. Historically, it has exhibited lower volatility and default rates, with Saudi Arabia playing a pivotal role in driving sukuk issuances. As the market grows and more non-Islamic issuers and market participants enter the space, liquidity and credit conditions may change. Evolving regulations and standards (e.g. the potential shift toward asset-backed sukuk under AAOIFI Standard 62) could reshape the market and influence how participants may adapt.
1 Damak, Mohamed. “Your Three Minutes In Capital Markets: The Effects Of Sukuk Defaults,” S&P Global Ratings, Aug. 27, 2024.
The posts on this blog are opinions, not advice. Please read our Disclaimers.Free Cash Flow as a Proxy for Quality in Europe: Introducing the S&P Europe Quality FCF Aristocrats Index

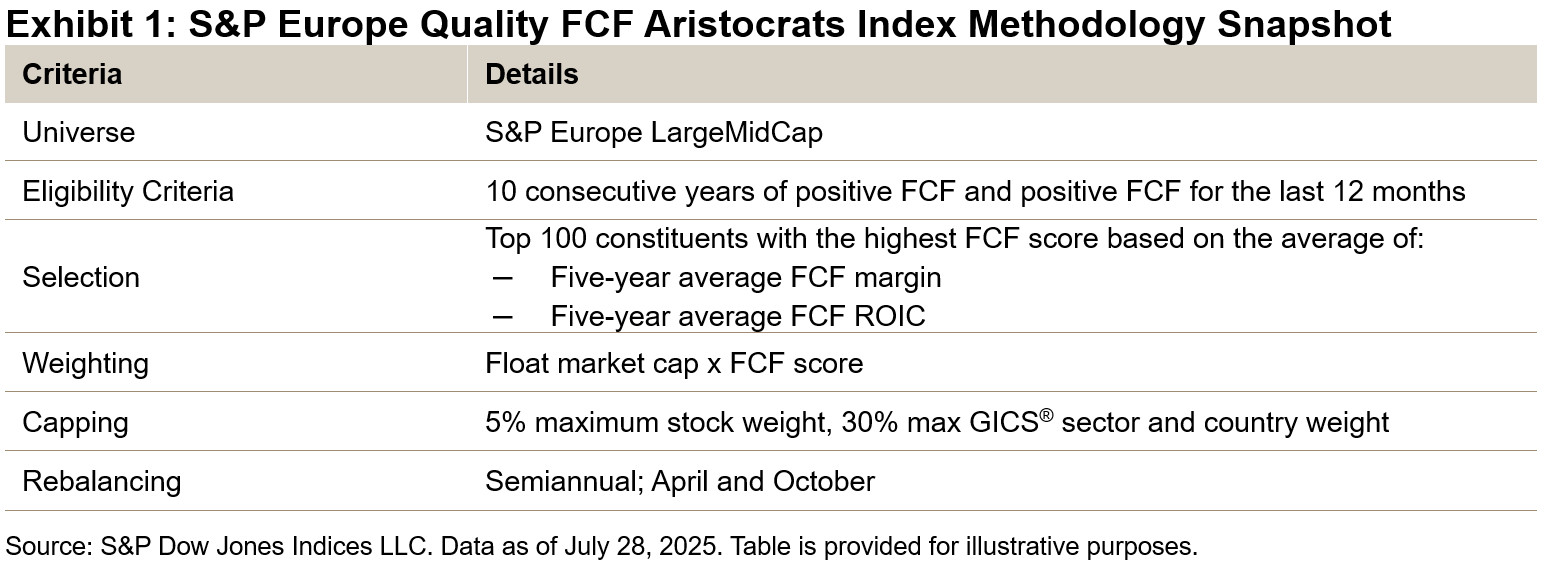
The S&P Europe Quality FCF Aristocrats® Index introduces the quality free cash flow (FCF) methodology to the European region. The index methodology selects high quality companies in the S&P Europe LargeMidCap universe that emphasize consistent and efficient free cash flow (FCF) generation.1 Our recent education paper explores the use of FCF metrics in creating indices with quality factor characteristics.
As with the existing S&P Quality FCF Aristocrats Indices, the new European index starts by selecting those companies that have 10 years of positive FCF generation, including positive FCF for the last 12 months. The constituents are then selected using the FCF score metrics, FCF ROIC and FCF margin, and weighted by float market cap multiplied by FCF score.
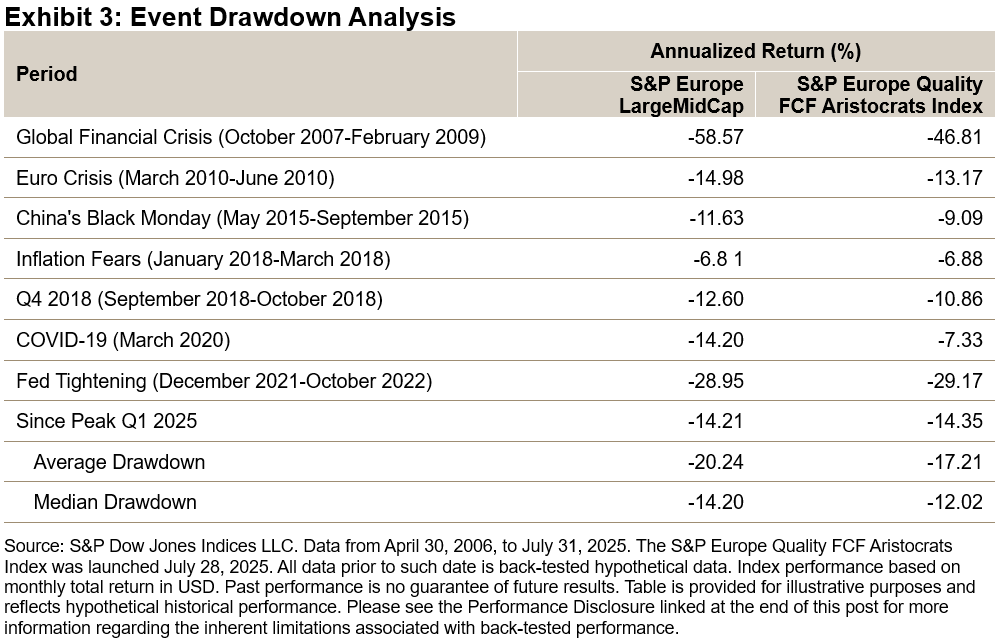
Over the long term back-tested period, the index outperformed its benchmark by 150 bps since April 30, 2006, while also demonstrating lower volatility with reduced drawdowns. The historical capture ratio also demonstrates the index’s upside potential with defensiveness against downside risk.
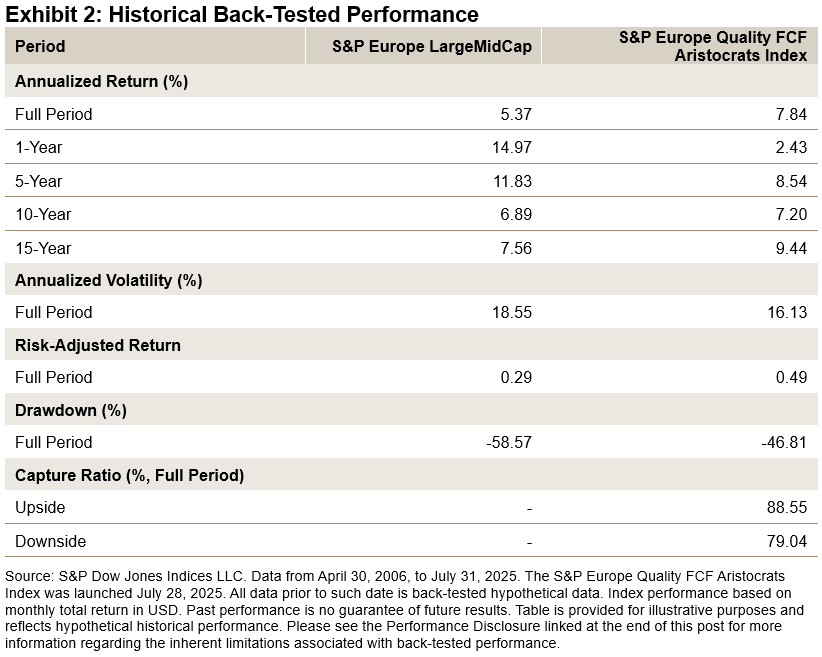
Over the period studied, in the majority of cases when the market saw large drawdowns, the S&P Europe Quality FCF Aristocrats Index saw a lower drawdown than the benchmark. The most noticeable of these was during the onset of COVID-19 when the index only matched approximately 50% of the market fall realized by the benchmark.
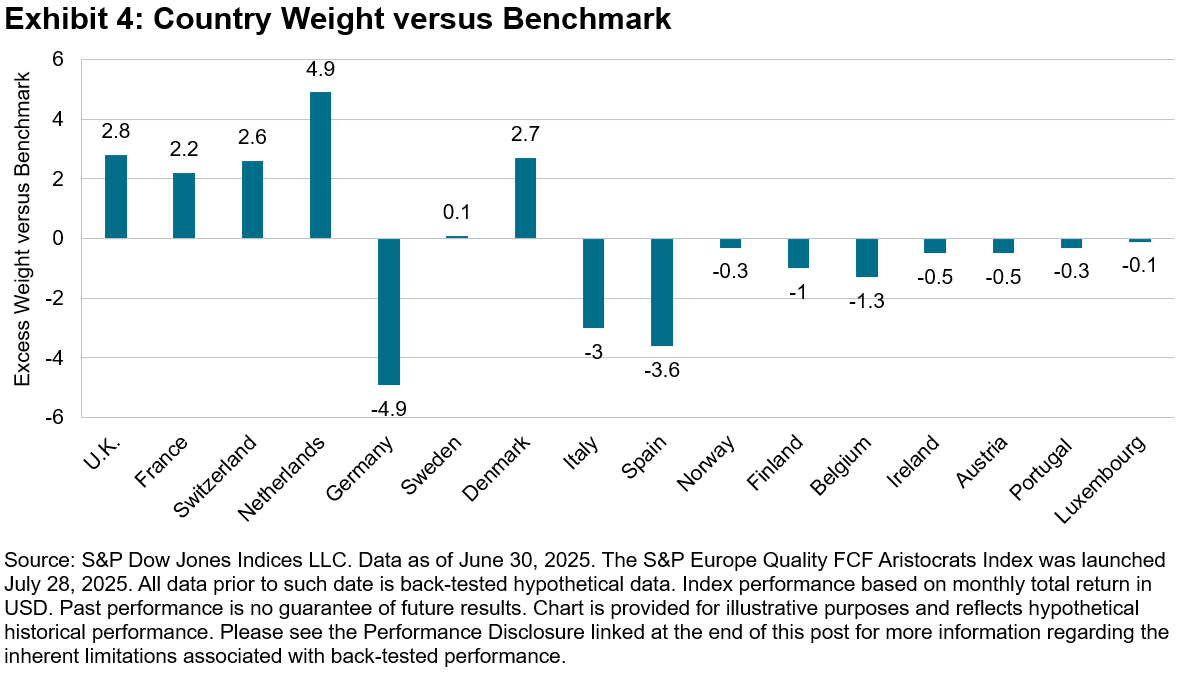
As of the most recent rebalance, the index had higher tilts toward the U.K., Switzerland, Denmark and the Netherlands compared to the benchmark, which has more weight in Germany and Southern European markets.
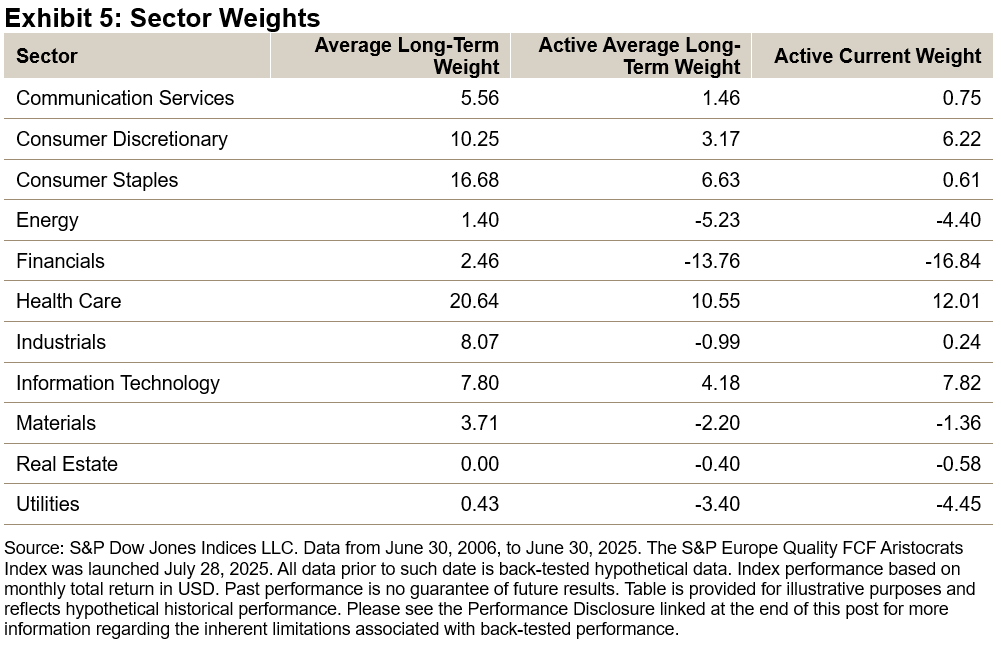
Active sector weights are shown in Exhibit 5. Historically, there were higher allocations on average to Health Care, Consumer Staples, Consumer Discretionary and Information Technology, with a significant tilt away from Financials and Energy.
More recently, the weights in Consumer Discretionary and Information Technology increased significantly, showing higher weights compared to the benchmark. Meanwhile, the weights to the Consumer Staples and Health Care sectors decreased. Underweights in Financials2 and Energy remained significant.
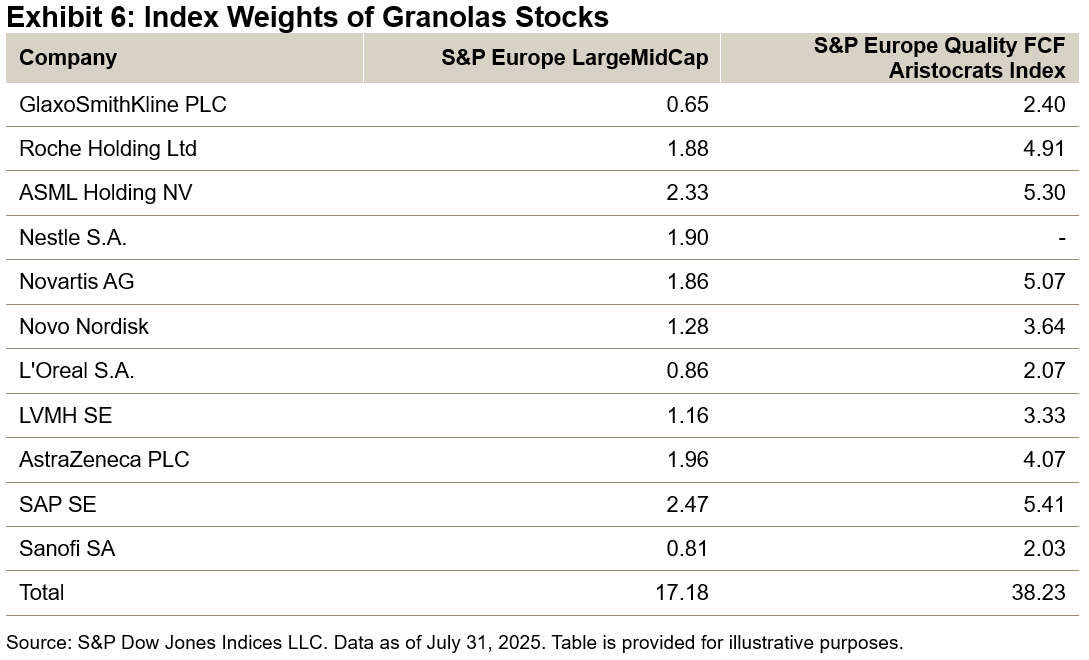
The Magnificent 7 stocks have been the topic of much discussion for their impact on the S&P 500. In Europe, the 11 companies that have led market performance are known as the “Granolas.” The index has representation in almost all these companies (excluding Nestlé) and has more than double the weight of the underlying benchmark, recognizing the high FCF scores and quality of these companies over the long term (see Exhibit 6).
The S&P Europe Quality FCF Aristocrats Index is the newest addition to the S&P Aristocrats Index Suite. This regional index has demonstrated a strong quality tilt across its back-tested history, providing a benchmark that uses FCF as proxy for long-term quality in the European market.
1 The S&P 500® Quality FCF Aristocrats Index and S&P Developed Quality FCF Aristocrats Index were both launched in December 2024.
2 Some Financials stocks are excluded due to the availability of metrics (see methodology). All Real Estate sector constituents are excluded.
The posts on this blog are opinions, not advice. Please read our Disclaimers.Advisor Profile: The Rise of the Index-Based Product Power User

Brandon Hass
Global Head of Client Solutions Group, Direct Indexing and Model Portfolios
S&P Dow Jones Indices
Growing demand for index-based strategies has been driven by financial advisors seeking low-cost solutions as they reallocate their time from investment management to financial planning. While index adoption is gaining momentum across advisor types, a distinct segment is setting the pace for deeper engagement, in-depth evaluation and sophisticated implementation of passive solutions: the index-based product “power user.”
A recent whitepaper1 published by Cerulli Associates examines how this group, defined as financial advisors who allocate at least 75% of client assets to index-based products, is creating a blueprint for other advisors looking to boost their usage of index-based strategies and get more value from their relationships with index providers.
What Sets Power Users Apart
Cerulli’s research found that power users stand out in several ways. Most are younger than 45 years old, work in independent or hybrid RIA channels and often build their own model portfolios.2 Nearly one-third have an average client size of USD 2 million or more in investable assets, and this group leans heavily on index-based strategies across asset classes, including U.S. large-cap equity, international equity and U.S. taxable fixed income.2
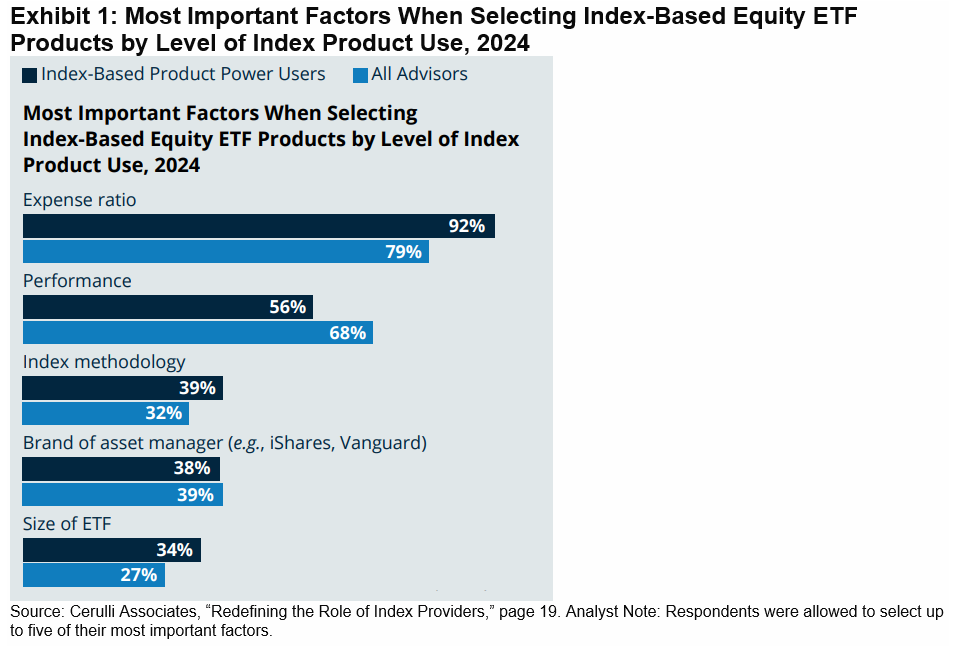
Exchange-traded funds (ETFs) are power users’ preferred vehicle for passive strategies, which isn’t surprising given ETFs’ typical low cost, ease of use and tax efficiency characteristics. In fact, 92% of power users report a high use of the ETF vehicle to access index-based products, compared to 77% of all advisors surveyed by Cerulli.2
Diving deeper into how power users evaluate ETFs, Cerulli found that they are more likely than other advisors to prioritize index methodology and expense ratio when selecting index-based equity ETFs, as shown in Exhibit 1—a testament to their desire for low-cost product exposures.3
What Power Users Want in Indices
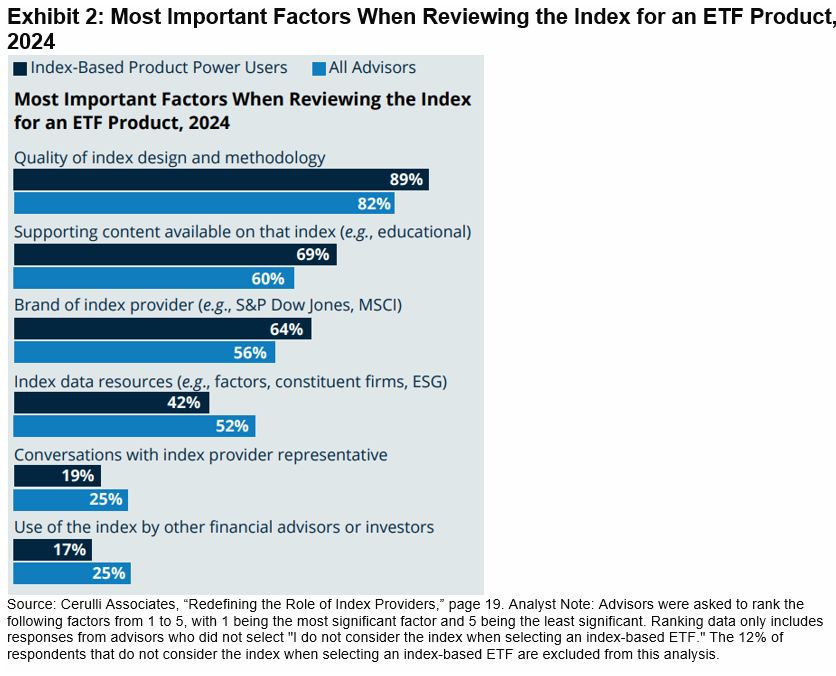
Power users are more likely than other advisors to scrutinize the design and methodology of the index that underlies any passive ETF—not just those ETFs that are designed to track equities.
As shown in Exhibit 2, 89% of power users rank quality of index design and methodology in their top three considerations when reviewing an index for use with an ETF, compared to 82% of all advisors.2
Power users often want to understand the nuances of an index, including its constituents, rules and rebalancing frequency to clearly articulate why—and how—index-based strategies work. As one RIA noted, “I think it’s important. If I’m going to be investing people largely in index funds, I should be explaining why I’m doing that.”2
These advisors are more inclined to use supporting educational content available on an index (69% versus 60% for all advisors) and consider the underlying index provider’s brand (64% versus 56%) to support their client conversations.2
Using Index Provider Resources in Their Practices
When considering passive products, power users look to index providers to help them better understand and evaluate the underlying indices. Index providers offer a wide range of resources—from thought leadership to data and tools—designed to help power users and other advisors’ use of index-based offerings.
Discover more insights on index-based strategy usage and ways index providers can support advisors in the Cerulli Associates whitepaper “Redefining the Role of Index Providers.”
1 The Cerulli Associates whitepaper “Redefining the Role of Index Providers” was sponsored by S&P Dow Jones Indices.
2 Please see page 19 of Cerulli Associates’ “Redefining the Role of Index Providers.”
3 Please see pages 17 and 19 of Cerulli Associates’ “Redefining the Role of Index Providers.”
The posts on this blog are opinions, not advice. Please read our Disclaimers.