Get Indexology® Blog updates via email.

In This List

Free Cash Flow as a Proxy for Quality in Europe: Introducing the S&P Europe Quality FCF Aristocrats Index

Advisor Profile: The Rise of the Index-Based Product Power User

An ESG Score Odyssey: Through the Lens of the S&P 500

Introducing the S&P MidCap 400 Scored & Screened Leaders Index

Salsa, Cumbia, Bossa Nova: Global Markets Dancing to Latin Rhythms

Free Cash Flow as a Proxy for Quality in Europe: Introducing the S&P Europe Quality FCF Aristocrats Index

Contributor Image
Elizabeth Bebb

Director, Factor & Dividend Indices

S&P Dow Jones Indices

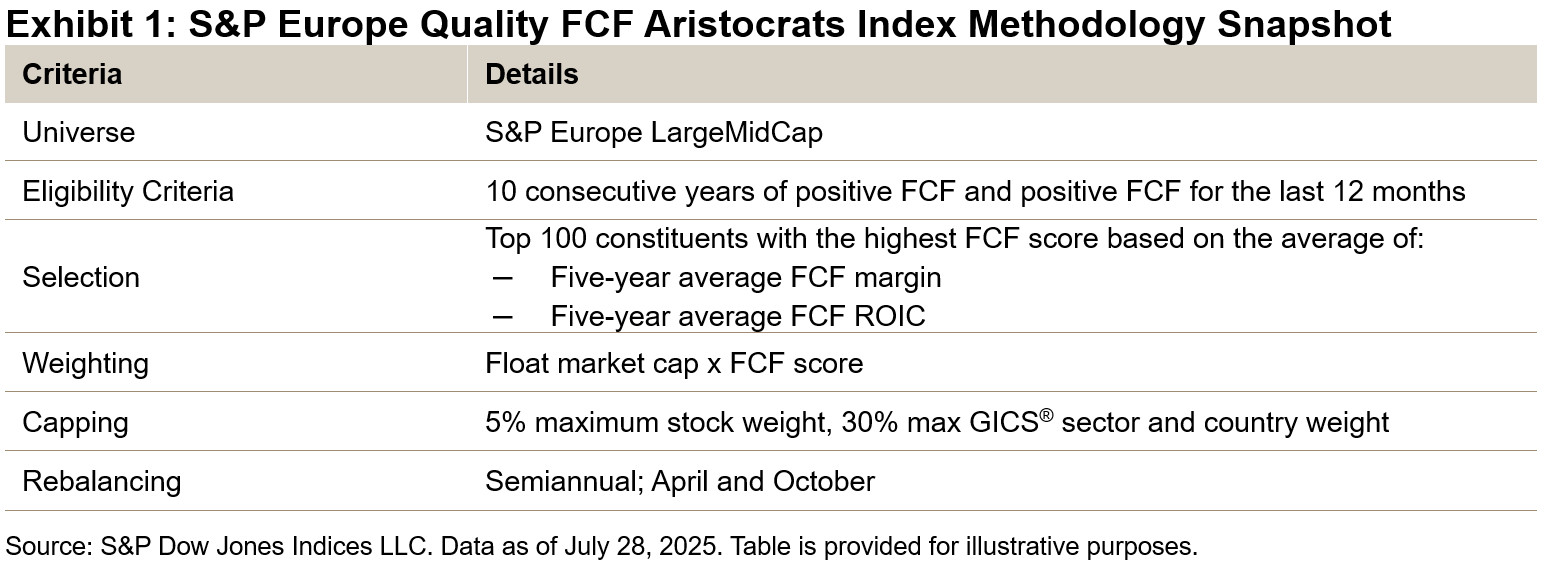
The S&P Europe Quality FCF Aristocrats® Index introduces the quality free cash flow (FCF) methodology to the European region. The index methodology selects high quality companies in the S&P Europe LargeMidCap universe that emphasize consistent and efficient free cash flow (FCF) generation.1 Our recent education paper explores the use of FCF metrics in creating indices with quality factor characteristics.

As with the existing S&P Quality FCF Aristocrats Indices, the new European index starts by selecting those companies that have 10 years of positive FCF generation, including positive FCF for the last 12 months. The constituents are then selected using the FCF score metrics, FCF ROIC and FCF margin, and weighted by float market cap multiplied by FCF score.

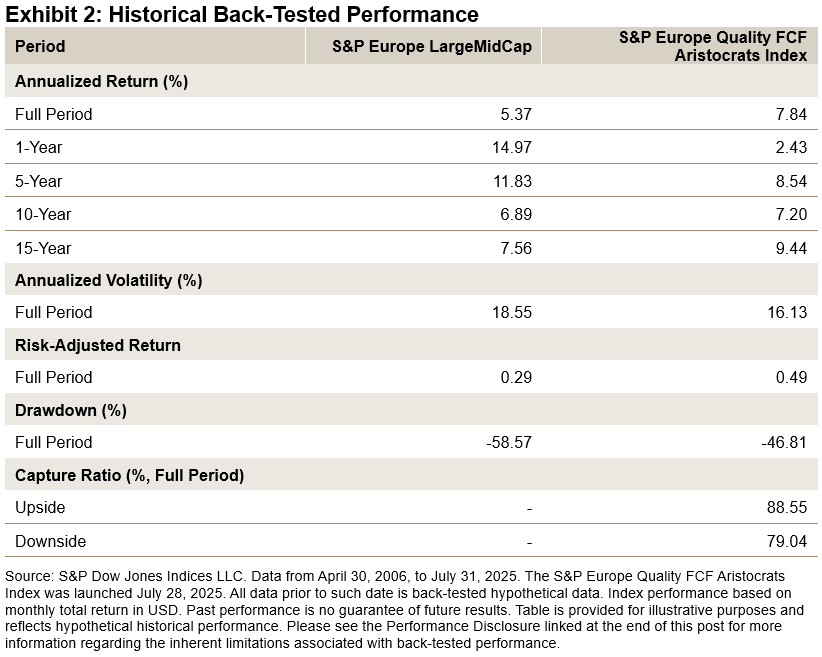
Over the long term back-tested period, the index outperformed its benchmark by 150 bps since April 30, 2006, while also demonstrating lower volatility with reduced drawdowns. The historical capture ratio also demonstrates the index’s upside potential with defensiveness against downside risk.

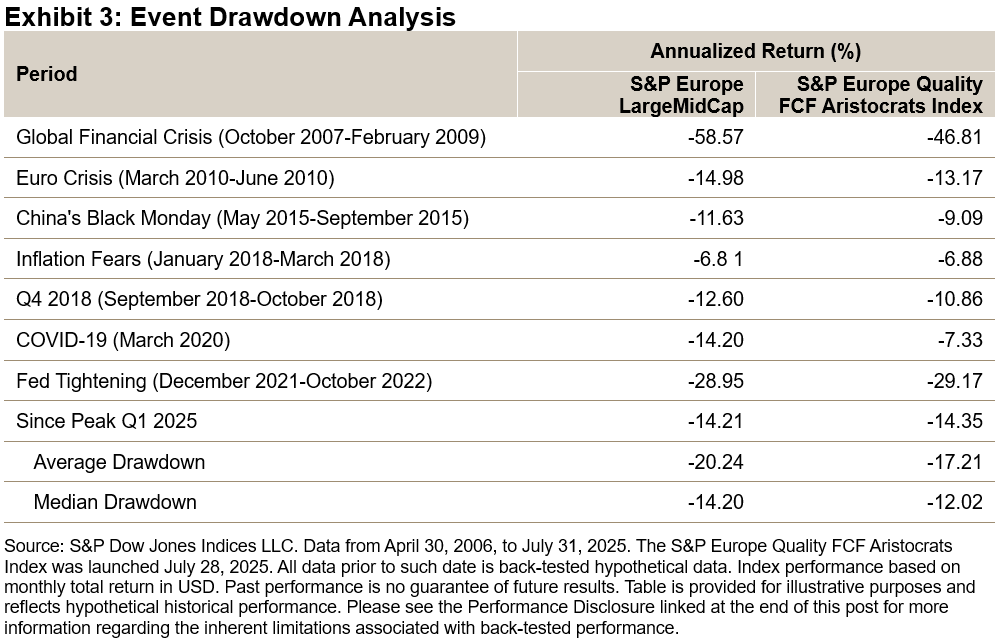
Over the period studied, in the majority of cases when the market saw large drawdowns, the S&P Europe Quality FCF Aristocrats Index saw a lower drawdown than the benchmark. The most noticeable of these was during the onset of COVID-19 when the index only matched approximately 50% of the market fall realized by the benchmark.

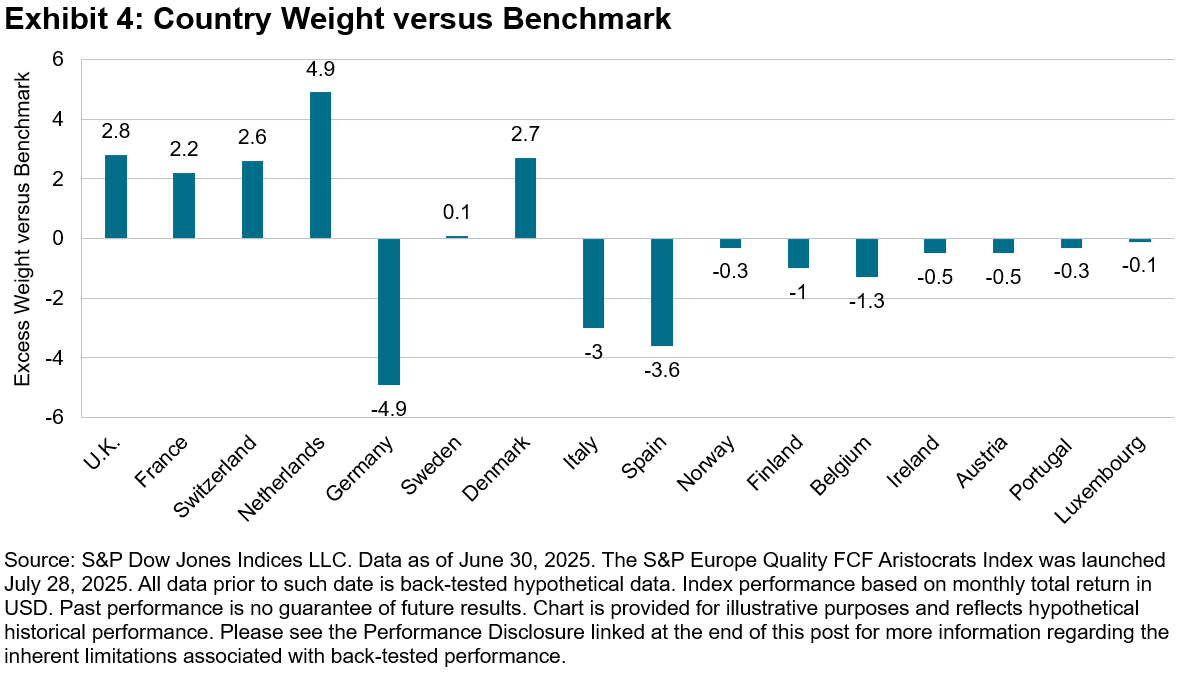
As of the most recent rebalance, the index had higher tilts toward the U.K., Switzerland, Denmark and the Netherlands compared to the benchmark, which has more weight in Germany and Southern European markets.

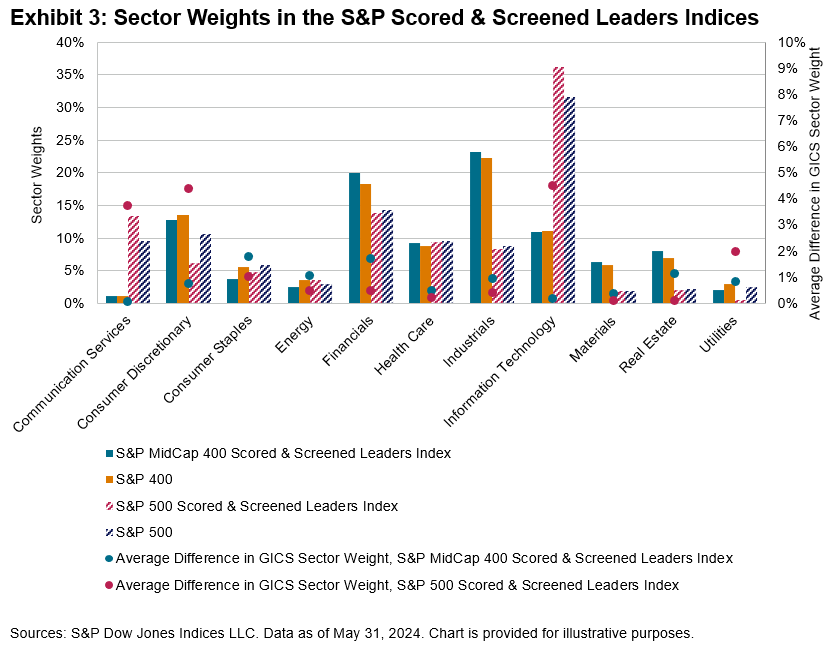
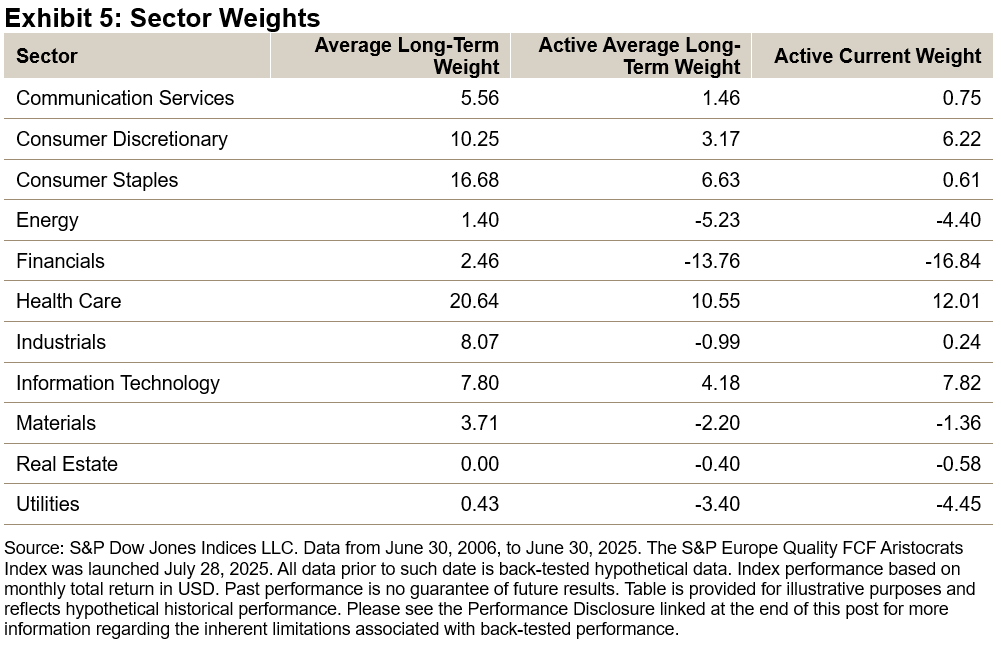
Active sector weights are shown in Exhibit 5. Historically, there were higher allocations on average to Health Care, Consumer Staples, Consumer Discretionary and Information Technology, with a significant tilt away from Financials and Energy.

More recently, the weights in Consumer Discretionary and Information Technology increased significantly, showing higher weights compared to the benchmark. Meanwhile, the weights to the Consumer Staples and Health Care sectors decreased. Underweights in Financials2 and Energy remained significant.

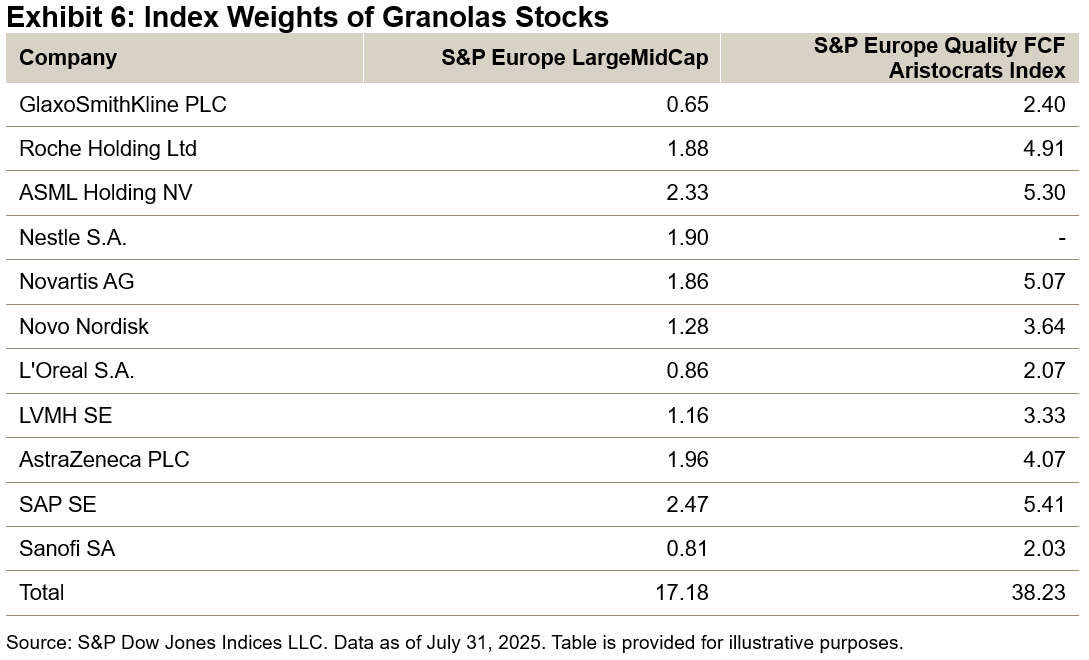
The Magnificent 7 stocks have been the topic of much discussion for their impact on the S&P 500. In Europe, the 11 companies that have led market performance are known as the “Granolas.” The index has representation in almost all these companies (excluding Nestlé) and has more than double the weight of the underlying benchmark, recognizing the high FCF scores and quality of these companies over the long term (see Exhibit 6).

The S&P Europe Quality FCF Aristocrats Index is the newest addition to the S&P Aristocrats Index Suite. This regional index has demonstrated a strong quality tilt across its back-tested history, providing a benchmark that uses FCF as proxy for long-term quality in the European market.

1 The S&P 500® Quality FCF Aristocrats Index and S&P Developed Quality FCF Aristocrats Index were both launched in December 2024.

2 Some Financials stocks are excluded due to the availability of metrics (see methodology). All Real Estate sector constituents are excluded.

The posts on this blog are opinions, not advice. Please read our Disclaimers.

Advisor Profile: The Rise of the Index-Based Product Power User

Contributor Image
Brandon Hass

Global Head of Client Solutions Group, Direct Indexing and Model Portfolios

S&P Dow Jones Indices

Growing demand for index-based strategies has been driven by financial advisors seeking low-cost solutions as they reallocate their time from investment management to financial planning. While index adoption is gaining momentum across advisor types, a distinct segment is setting the pace for deeper engagement, in-depth evaluation and sophisticated implementation of passive solutions: the index-based product “power user.”

A recent whitepaper1 published by Cerulli Associates examines how this group, defined as financial advisors who allocate at least 75% of client assets to index-based products, is creating a blueprint for other advisors looking to boost their usage of index-based strategies and get more value from their relationships with index providers.

What Sets Power Users Apart

Cerulli’s research found that power users stand out in several ways. Most are younger than 45 years old, work in independent or hybrid RIA channels and often build their own model portfolios.2 Nearly one-third have an average client size of USD 2 million or more in investable assets, and this group leans heavily on index-based strategies across asset classes, including U.S. large-cap equity, international equity and U.S. taxable fixed income.2

Exchange-traded funds (ETFs) are power users’ preferred vehicle for passive strategies, which isn’t surprising given ETFs’ typical low cost, ease of use and tax efficiency characteristics. In fact, 92% of power users report a high use of the ETF vehicle to access index-based products, compared to 77% of all advisors surveyed by Cerulli.2

Diving deeper into how power users evaluate ETFs, Cerulli found that they are more likely than other advisors to prioritize index methodology and expense ratio when selecting index-based equity ETFs, as shown in Exhibit 1—a testament to their desire for low-cost product exposures.3

What Power Users Want in Indices

Power users are more likely than other advisors to scrutinize the design and methodology of the index that underlies any passive ETF—not just those ETFs that are designed to track equities.

As shown in Exhibit 2, 89% of power users rank quality of index design and methodology in their top three considerations when reviewing an index for use with an ETF, compared to 82% of all advisors.2

Power users often want to understand the nuances of an index, including its constituents, rules and rebalancing frequency to clearly articulate why—and how—index-based strategies work. As one RIA noted, “I think it’s important. If I’m going to be investing people largely in index funds, I should be explaining why I’m doing that.”2

These advisors are more inclined to use supporting educational content available on an index (69% versus 60% for all advisors) and consider the underlying index provider’s brand (64% versus 56%) to support their client conversations.2

Using Index Provider Resources in Their Practices

When considering passive products, power users look to index providers to help them better understand and evaluate the underlying indices. Index providers offer a wide range of resources—from thought leadership to data and tools—designed to  help power users and other advisors’ use of index-based offerings.

Discover more insights on index-based strategy usage and ways index providers can support advisors in the Cerulli Associates whitepaper “Redefining the Role of Index Providers.”


1 The Cerulli Associates whitepaper “Redefining the Role of Index Providers” was sponsored by S&P Dow Jones Indices.

2 Please see page 19 of Cerulli Associates’ “Redefining the Role of Index Providers.”

3 Please see pages 17 and 19 of Cerulli Associates’ “Redefining the Role of Index Providers.”

The posts on this blog are opinions, not advice. Please read our Disclaimers.

An ESG Score Odyssey: Through the Lens of the S&P 500

Contributor Image
Oscar Letch

Summer Intern, Index Investment Strategy

S&P Dow Jones Indices

This study examines the performance of S&P 500® constituents over the past 10 years through the lens of their S&P Global ESG Scores. A key question for market participants has been whether companies with high or low ESG scores outperform or underperform relative to their peers and the broader market benchmarks. Building on our prior analysis that investigated the ESG score-related drivers behind the excess return in the S&P 500 Scored & Screened Index versus The 500™ over a five-year period, this analysis offers a broader perspective through a decade-long lens.

To assess the relation between ESG scores and performance, we created hypothetical ESG score quintile compositions by count, and we reconstituted them annually by ranking The 500’s constituents based on their S&P Global ESG Scores and assigning them to one of the five compositions, from highest to lowest ESG scores. The hypothetical market-cap-weighted cumulative performance of these compositions was then calculated and compared against the performance of The 500. The findings summarized in Exhibit 1 reveal a notable trend: companies in the second-highest ESG-scoring quintile outperformed The 500 by a cumulative 48.0%, while those in the lowest-scoring quintile underperformed by 27.1%.

Exhibits 2 and 3 present a sectoral analysis of contributions from both the second-highest and lowest ESG-scoring companies, uncovering distinct performance patterns. The second-highest ESG-scoring quintile achieved a cumulative gain of 89.6%, with a substantial portion—47.9%—of this attributable to the Information Technology sector. In contrast, performance among the lowest ESG-scoring companies was more evenly distributed across multiple sectors, with no single sector showing a significantly stronger contribution.

In addition to our overall S&P Global ESG Score evaluation, we also explored the social dimension of the ESG scores, motivated by growing interest among market participants in social criteria such as human capital management. In Exhibit 4, we used the same quintile approach as in Exhibit 1, applying it to S&P Global Social Scores to analyze cumulative returns. The results highlighted that the highest social-scoring companies outperformed The 500 by 68.6%, while those with the lowest social scores underperformed by 0.7%.

In summary, our findings indicate that over the past decade, companies rated with the second-highest S&P Global ESG Scores outperformed The 500 cumulatively, largely driven by performance in the Information Technology sector, while those with the lowest ESG scores underperformed, with their returns distributed more evenly across various sectors. Additionally, our analysis of S&P Global Social Scores further revealed that the highest social-scoring companies also outperformed, emphasizing the potential significance of social criteria in ESG scores.

The author would like to thank Maya Beyhan for her continued mentorship and contributions to this blog.

The posts on this blog are opinions, not advice. Please read our Disclaimers.

Introducing the S&P MidCap 400 Scored & Screened Leaders Index

Contributor Image
Florence Chapman

Senior Analyst, U.S. Equities

S&P Dow Jones Indices

Launched in April 2025, the S&P MidCap 400® Scored & Screened Leaders Index provides a new benchmark for measuring the performance of companies with higher-than-average ESG scores while excluding companies that derive revenue from specified business activities, or are non-compliant with the United Nations Global Compact.

A Sizeable Market Segment

With a market capitalization larger than entire countries’ equity markets (see Exhibit 1), the S&P 400® highlights the global relevance of U.S. mid caps. The S&P 400 may also offer distinct characteristics when compared to the S&P 500, including diversification from mega-cap companies and an emphasis on more domestically oriented sectors.1

Exclusions Follow a Rules-Based Methodology

The S&P MidCap 400 Scored & Screened Leaders Index is designed to maintain similar industry group weights to the S&P 400. As outlined in its methodology, companies are selected to target 50% of uncapped free-float market capitalization from each GICS® industry group within the S&P 400 (see Exhibit 2). Selection is then based on the descending order of S&P Global ESG Scores, while excluding companies:

  • In either the lowest 25% of ESG scores within the S&P MidCap 400 GICS industry group, or the lowest 10% of all ESG scores within the S&P MidCap 400.
  • Involved in specific business activities deemed incompatible with sustainability goals (such as weapons, tobacco, coal and others).
  • Failing to meet UNGC principles.
  • Associated with significant ESG controversies.

If exclusions prevent an industry group from meeting the 50% target, excess industry weight is distributed proportionately among remaining constituents. To mitigate single-stock concentration, a constituent cap is implemented according to the S&P Scored & Screened Leaders Indices methodology.

Industry Group Neutrality by Design

Exhibit 3 compares the GICS sector weights for the S&P MidCap 400 Scored & Screened Leaders Index with those of the S&P MidCap 400 as of May 31, 2025. The exhibit shows how the construction of the former resulted in similar sector weights to the latter, as demonstrated by an average sector weight difference of under 1.8%.

Although not an objective of the S&P MidCap 400 Scored & Screened Leaders Index, the similarity in sector weights compared to the S&P MidCap 400 helps explain the similarity in their performance, with a 0.6% difference in annualized total return over the one-year period ending May 2025 (see Exhibit 4). Similar results were also observed over longer horizons. These metrics reflect a balance between diversified sector weights and selective ESG criteria, highlighting the index’s objective to measure aspects of sustainability and market representation.

Conclusion

The S&P MidCap 400 Scored & Screened Leaders Index offers a fresh perspective on mid-cap equities by combining specific sustainability criteria with the core characteristics of the S&P MidCap 400, and it presents a tool for the U.S. mid-cap segment with sustainability features.


1See Anguiano, Cristopher, “Beyond Large Caps: Exploring the S&P MidCap 400 and S&P SmallCap 600,” S&P Dow Jones Indices’ Indexology® Blog, Feb. 18, 2025.

2For more information, see the S&P MidCap 400 Brochure here.

3For more information on S&P Global ESG Scores, please see here. For a more comprehensive understanding of the S&P Global ESG Scores methodology, please refer to the S&P Global ESG Scores Methodology.

4United Nations Global Compact. For more information on UNGC Principles, please see here.

The posts on this blog are opinions, not advice. Please read our Disclaimers.

Salsa, Cumbia, Bossa Nova: Global Markets Dancing to Latin Rhythms

Contributor Image
Diego Zurita

Analyst, Global Equities & Thematics

S&P Dow Jones Indices

This year, Latin America has been the loudest music in the stock market disco. As Exhibit 1 shows, the S&P Latin America BMI (up 24.7%YTD) has outperformed other regions for most of the year.

Notably, the S&P Latin America BMI is bouncing back from being the worst-performing region last year, when it closed down 24.4%. As Exhibit 2 shows, since 2019, the region has had periods of both significant outperformance and underperformance.

As of the end of July, all constituent countries of the S&P Latin America BMI were up more than 20% YTD, with Colombia leading at 46.5% (see Exhibit 3).Brazil and Mexico with the largest weights in the S&P Latin America BMI, contributed 13.2% and 7.7% to the overall index return, respectively.

The best-performing sectors in the region YTD were Information Technology, Consumer Discretionary and Communication Services (see Exhibit 4). However, the Financials sector, which has a weight of 32.0% on the index, was the major contributor to the S&P Latin America BMI’s performance. Brazilian banks were the main supporters of this increase, as they benefited from growth in earnings (e.g., Itau, Nu Bank) and positive economic surprises.

Tariff negotations have been one of the major developments driving market performance, but the region is considered to be insulated from trade tensions. As illustrated by Exhibit 5, most Latin American countries have a trade deficit with the U.S., thus, haven’t been a target of high increases in tariffs. While Mexico is one of the few Latin American countries that has more exports than imports to the U.S., the USMCA trade agreement helps to maintain a stable trade relationship in the short term.

On top of that, the valuation of Latin American equities is below its 10-year average price-to-earnings (P/E) ratio (see Exhibit 6). Additionally, based on the P/E ratio, equities from this region can be considered to be priced at a discount compared to those from other regions.

Despite the strong performance this year, it’s important to consider that Latin America equities have historically tended to be more volatile than others, as seen in the past 1-, 3-, 5- and 10-year periods (see Exhibit 7).

Relative low valuations and stability amid global trade tensions have brought attention to Latin American equities, but it is also worth acknowledging the volatility associated with these emerging markets. Latin music may sound good for dancing, but don’t fall on the dancefloor!

The posts on this blog are opinions, not advice. Please read our Disclaimers.