Get Indexology® Blog updates via email.

In This List

Scoring & Screening Mid-Cap Leaders

Upcoming Enhancements to Modernize the S&P/ASX Index Series

Tracking Fixed Income Performance and Innovation

What’s the Role of Sectors and Factors in Concentrated Markets?

Sukuk Market Hits USD 1 Trillion This Summer: What You Should Know

Scoring & Screening Mid-Cap Leaders

Contributor Image
Maya Beyhan

Global Head of Sustainability, Index Investment Strategy

S&P Dow Jones Indices

In a previous analysis, we examined the S&P MidCap 400® Scored & Screened Index, derived from the S&P MidCap 400 broad market benchmark. The S&P MidCap 400 Scored & Screened Index showed key characteristics such as lower concentration compared to the S&P 500®, as well as similar industry weights to the S&P MidCap 400.

In this analysis, we turn our attention to a new sustainability benchmark for the mid-cap segment—the S&P MidCap 400 Scored & Screened Leaders Index—and highlight its key features.

Launched on April 9, 2025, the S&P MidCap 400 Scored & Screened Leaders Index measures the performance of securities with higher-than-average ESG scores, while excluding companies deriving revenue from specified business activities or that are non-compliant with United Nations Global Compact.1

Exhibit 1 summarizes the relationship between the usage of ESG scores, concentration and market-capitalization coverage for various indices in the mid- and large-cap segments, as of May 30, 2025. References to “Scored” below and in the index name indicate the use of S&P Global ESG Scores to select index constituents, while concentration (measured on the x-axis) is based on the total weight of the top 10 largest stocks in each index. The size of the bubbles reflects the market-capitalization coverage.

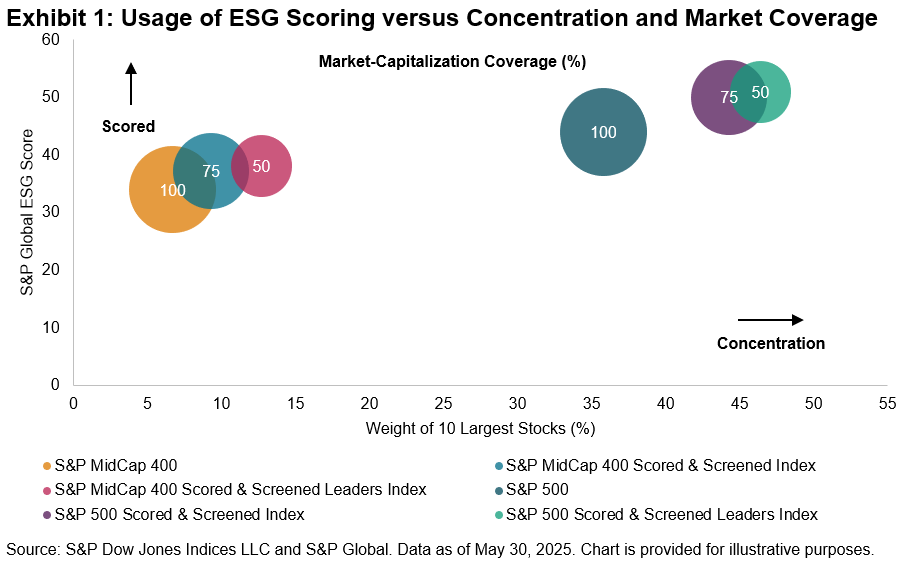
From Exhibit 1, we observe that the mid-cap indices showed relatively lower concentration compared to the S&P 500®-based indices—this pattern was also identified in our previous analysis. Specifically, the S&P MidCap 400 Scored & Screened Leaders Index had a concentration of 12.7% for its 10 largest stocks, the highest among the mid-cap indices, but also distinctly lower than the 46.4% concentration of the S&P 500 Scored & Screened Leaders Index.

Furthermore, the exhibit reveals that as concentration increased, ESG scores tended to rise, while market-capitalization coverage decreased.

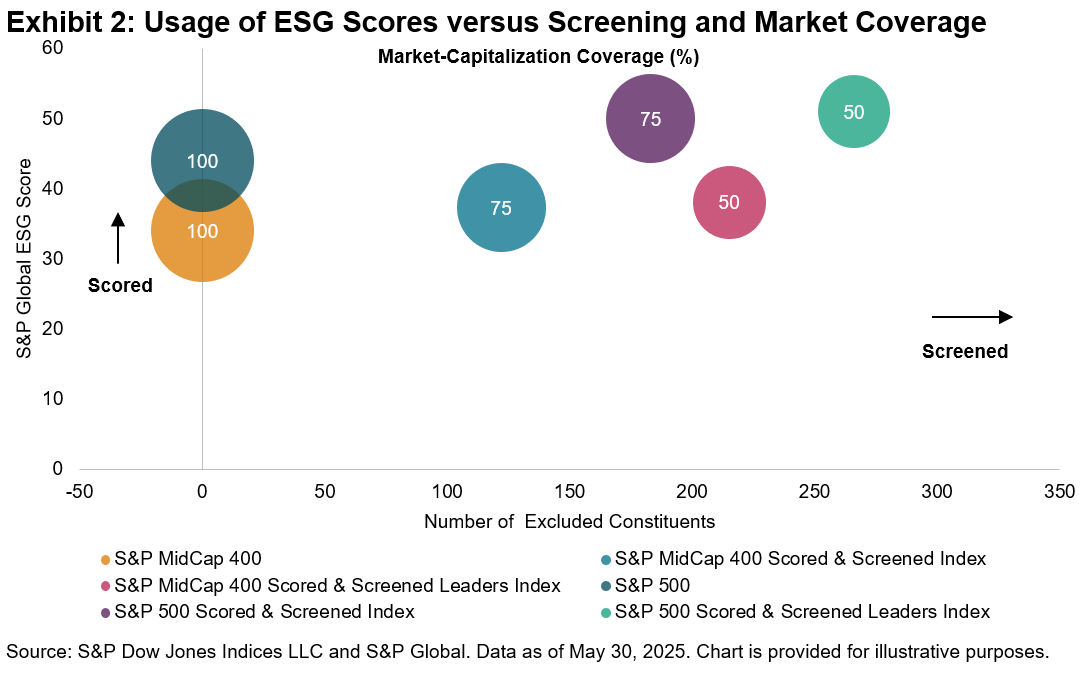
The S&P MidCap 400 Scored & Screened Leaders Index achieved the highest ESG score among the mid-cap indices at 38.1, compared to the S&P MidCap 400’s score of 34.0. However, it also exhibited the lowest market-capitalization coverage of 50%.

Exhibit 2 further explores this relationship by analyzing the connection between ESG scores, market-capitalization coverage and the number of excluded constituents for each index. References to “Screened” below and in the index name refer to those constituents excluded based on specific eligibility criteria. In this case, the S&P MidCap 400 Scored & Screened Leaders Index stood out among the mid-cap indices with the highest number of exclusions, at 215, in contrast to just 122 for the S&P MidCap 400 Scored & Screened Index. This large number of exclusions aligns with its construction methodology, which aims to measure the performance of securities that meet stricter ESG criteria.

In summary, Exhibits 1 and 2 together show that the S&P MidCap 400 Scored & Screened Leaders Index not only aligns with key characteristics of the S&P MidCap 400—like maintaining lower concentration compared to the S&P 500—but also includes constituents that exhibit stronger-than-average ESG characteristics as measured by S&P Global ESG Scores.


1See the S&P Scored & Screened Leaders Indices Methodology.

The posts on this blog are opinions, not advice. Please read our Disclaimers.

Upcoming Enhancements to Modernize the S&P/ASX Index Series

Contributor Image
Sean Freer

Director, Global Exchange Indices

S&P Dow Jones Indices

Since the launch of the S&P/ASX Index Series, the Australian capital market has evolved considerably. Instead of calling or faxing a stockbroker, market participants today can instantly trade stocks, ETFs, options and futures contracts with much shorter settlement times by tapping a screen in the palm of their hand. As financial markets develop, index methodologies must also evolve to ensure they continue to meet their objective and effectively represent the markets they intend to measure.

As stewards of the most widely followed Australian benchmarks, S&P Dow Jones Indices (S&P DJI), in partnership with the ASX, take a prudent approach by conducting extensive research on impact and incorporating feedback from a wide range of market participants before a decision is made to modify an index methodology.

Following a market consultation in July and August, the S&P/ASX index committee reviewed the feedback and approved three changes to the wider S&P/ASX Index series.

What Are the Changes?

Three modifications to the S&P/ASX Index Series have been approved and will be implemented in the upcoming September rebalance.

  1. Reduce calculation period. Currently, the S&P/ASX 200 and S&P/ASX 300 consider companies for index inclusion based on a six-month average of their float-adjusted market capitalization and daily liquidity. This calculation period will be reduced to three months.
  2. Apply two-way turnover. Currently, stocks are added to an index once an existing constituent has exited the index due to a sufficiently low rank below an exit buffer. Going forward, once a company ranks above an index entry buffer, it can be added regardless of the ranking of other existing index constituents.
  3. Lower Investable Weight Factor (IWF). The IWF is the ratio of available free float shares to total shares outstanding. It reflects the proportion of shares available for trading in the market. The current minimum IWF for index inclusion is 0.3 and will be reduced to 0.15.

The approved changes will impact the S&P/ASX 300, S&P/ASX 200, S&P/ASX 100, S&P/ASX 50, S&P/ASX 20, S&P/ASX MidCap 50 and S&P/ASX Small Ordinaries, as well as any other index derived from these indices within the series, such as GICS® sector indices.

Why Are These Changes Being Proposed?

Today’s market environment is faster paced with regard to information flow, trading execution, holding periods, settlement and other factors. Reducing the calculation period on index eligibility criteria to three months will allow the indices to react more quickly to market changes.

The introduction of a two-way buffer will also allow more timely adjustments to index constituents. A two-way buffer is also the more common approach used among other benchmarks operated by S&P DJI.

The current IWF of 0.3 is higher than most other benchmarks operated by S&P DJI and can prevent some companies being included in the index series despite meeting minimum liquidity requirements. Furthermore, the minimum free float threshold is higher than the ASX minimum float requirement of 20% at listing.

Impacts of Proposed Changes

Based on back-testing analysis of the approved changes, we anticipate faster-growing companies being added to and represented in indices earlier; conversely poorer-performing companies can exit more quickly.

Our modeled analysis, which was included in the market consultation, resulted in a modest performance benefit to the S&P/ASX 200 and S&P/ASX 300, while not materially affecting turnover or creating a “yo-yo effect” of companies entering and exiting indices within one or two rebalances.

Modeling of the three approved enhancements to the S&P/ASX Index Series resulted in a tracking error of less than 0.2% across all periods for the S&P/ASX 200 and S&P/ASX 300.

Conclusion

The upcoming modifications to the S&P/ASX Index Series are intended to enhance the indices’ representativeness by allowing them to more quickly reflect changing market conditions while further aligning with S&P DJI index conventions.

The three index changes outlined in this paper will be implemented in conjunction with the September 2025 rebalancing, which is effective after the close on Friday, Sept. 19, 2025.

The posts on this blog are opinions, not advice. Please read our Disclaimers.

Tracking Fixed Income Performance and Innovation

What do duration, the yield curve and credit trends tell us about the evolving fixed income landscape? S&P DJI’s Anu Ganti and Ben Vörös explore the recent performance of S&P DJI’s iBoxx indices in Europe and highlight the latest innovations in the fixed income indexing toolkit.

The posts on this blog are opinions, not advice. Please read our Disclaimers.

What’s the Role of Sectors and Factors in Concentrated Markets?

Which sectors and factors have shown the strongest performance trends through recent market shifts? S&P DJI’s Ben Vörös joins Anu Ganti to explore the potential of indices to help market participants address concerns around concentration and unpack performance highlights from the first half of 2025.

The posts on this blog are opinions, not advice. Please read our Disclaimers.

Sukuk Market Hits USD 1 Trillion This Summer: What You Should Know

Contributor Image
Jessica Tan

Principal, Fixed Income Indices

S&P Dow Jones Indices

The global sukuk market has surpassed the USD 1 trillion mark in outstanding issuances, achieving a significant milestone that affirms its role within the fixed income sector. The Dow Jones Sukuk Total Return Index (ex-Reinvestment), launched in April 2006, has served as a benchmark for measuring the global investment grade (IG) USD-denominated sukuk market during this journey.

Over the past decade, the notional amount of sukuk included in the index increased by 165%, increasing from USD 57 billion to USD 150 billion. Sub-sovereign issuances surged by 392%, almost doubling their weight in the index from 12% to 22%. Additionally, sovereigns from non-Muslim majority regions, such as Hong Kong and the Philippines, are also tapping into the market, reflecting a growing global interest in sukuk as a financing option.

What Sets Sukuk Apart?

The appeal of sukuk lies primarily in their Shariah compliance, which acts as a catalyst for increased demand and reduced volatility. Most sukuk investors are long-term, buy-and-hold Islamic institutions, including Islamic banks, insurers and pension funds, which are often required to hold sukuk for regulatory or Shariah compliance. This lowers speculative trading, resulting in sustained demand and lower volatility.

Exhibit 2 compares USD IG Sukuk (the Dow Jones Sukuk Total Return Index (ex-Reinvestment)) with conventional emerging markets debt (the iBoxx USD Emerging Markets Broad Investment Grade) and U.S. Treasuries (the iBoxx $ Treasuries). The sukuk index consistently demonstrated lower volatility and a higher return/risk ratio across all analyzed periods.

A Sovereign-Heavy Market Certified by Shariah Boards with Low Default Rates

Sukuk are typically structured and arranged by Islamic banks or financial institutions with their own Shariah boards to ensure compliance with Islamic principles. The issuance prospectus includes a section detailing the sukuk’s Shariah compliance.

The requirement for Shariah Board certification at issuance, along with the structuring, legal and compliance costs, creates a barrier to entry that tends to favor larger, higher credit-quality entities (such as sovereigns, sub-sovereigns and major corporates) in the sukuk market. Within the Dow Jones Sukuk Total Return Index (ex-Reinvestment), nearly 60% of the IG sukuk were issued by sovereigns and sub-sovereigns. Additionally, S&P Global Ratings reported that only 0.2% of sukuk defaulted between 2000 and 2024.1

The Kingdom of Saudi Arabia Is the Largest Dollar and Local Currency Sovereign Sukuk Issuer

To support economic diversification projects under Saudi Vision 2030, the Kingdom of Saudi Arabia (KSA) has been actively issuing sukuk for financing while developing its local currency debt market. The iBoxx Tadawul SAR Government Sukuk Index tracks SAR-denominated sukuk issued by the KSA, with an outstanding amount of SAR 615 billion (USD 164 billion). As of July 31, 2025, the notional value of USD KSA sukuk in the Dow Jones Sukuk Total Return Index (ex-Reinvestment) was USD 23.7 billion, making the KSA the largest sovereign sukuk issuer in both USD and local currency markets.

Conclusion

In conclusion, the global sukuk market has reached a significant milestone of USD 1 trillion, with robust supply and demand dynamics. Historically, it has exhibited lower volatility and default rates, with Saudi Arabia playing a pivotal role in driving sukuk issuances. As the market grows and more non-Islamic issuers and market participants enter the space, liquidity and credit conditions may change. Evolving regulations and standards (e.g. the potential shift toward asset-backed sukuk under AAOIFI Standard 62) could reshape the market and influence how participants may adapt.

1 Damak, Mohamed. “Your Three Minutes In Capital Markets: The Effects Of Sukuk Defaults,” S&P Global Ratings, Aug. 27, 2024.

The posts on this blog are opinions, not advice. Please read our Disclaimers.