Get Indexology® Blog updates via email.

In This List

Expanding the S&P Quality FCF Aristocrats Indices to U.S. Mid and Small Caps

The Momentum Factor: Thriving beyond U.S. Borders

Growing Models Usage Calls for Enhanced Data Intelligence and Delivery

Quality by Design: A Deep Dive into the S&P SmallCap 600

Insurance Idiosyncrasies

Expanding the S&P Quality FCF Aristocrats Indices to U.S. Mid and Small Caps

Contributor Image
Wenli Bill Hao

Director, Factors and Dividends Indices, Product Management and Development

S&P Dow Jones Indices

Utilizing free cash flow (FCF) to evaluate a company’s quality can be a powerful way to identify financially resilient businesses. Unlike earnings, which can be influenced by accounting practices, FCF provides a clearer picture of a company’s ability to generate cash after covering essential expenses and investments.

In our paper published this year, we demonstrated this approach with large-cap companies using the S&P 500®. In the mid- and small-cap spaces, where earnings can be more volatile and transparency may be lower, using FCF may be even more valuable to help identify businesses with sustainable growth while offering stronger potential downside protection.

As of July 28, 2025, S&P DJI expanded the S&P Quality FCF Aristocrats® Index Series to include the S&P MidCap 400® Quality FCF Aristocrats Index and the S&P SmallCap 600® Quality FCF Aristocrats Index. In this blog, we will explore the design, performance, and sector and factor characteristics of these indices, alongside the S&P 500® Quality FCF Aristocrats Index.

Index Design

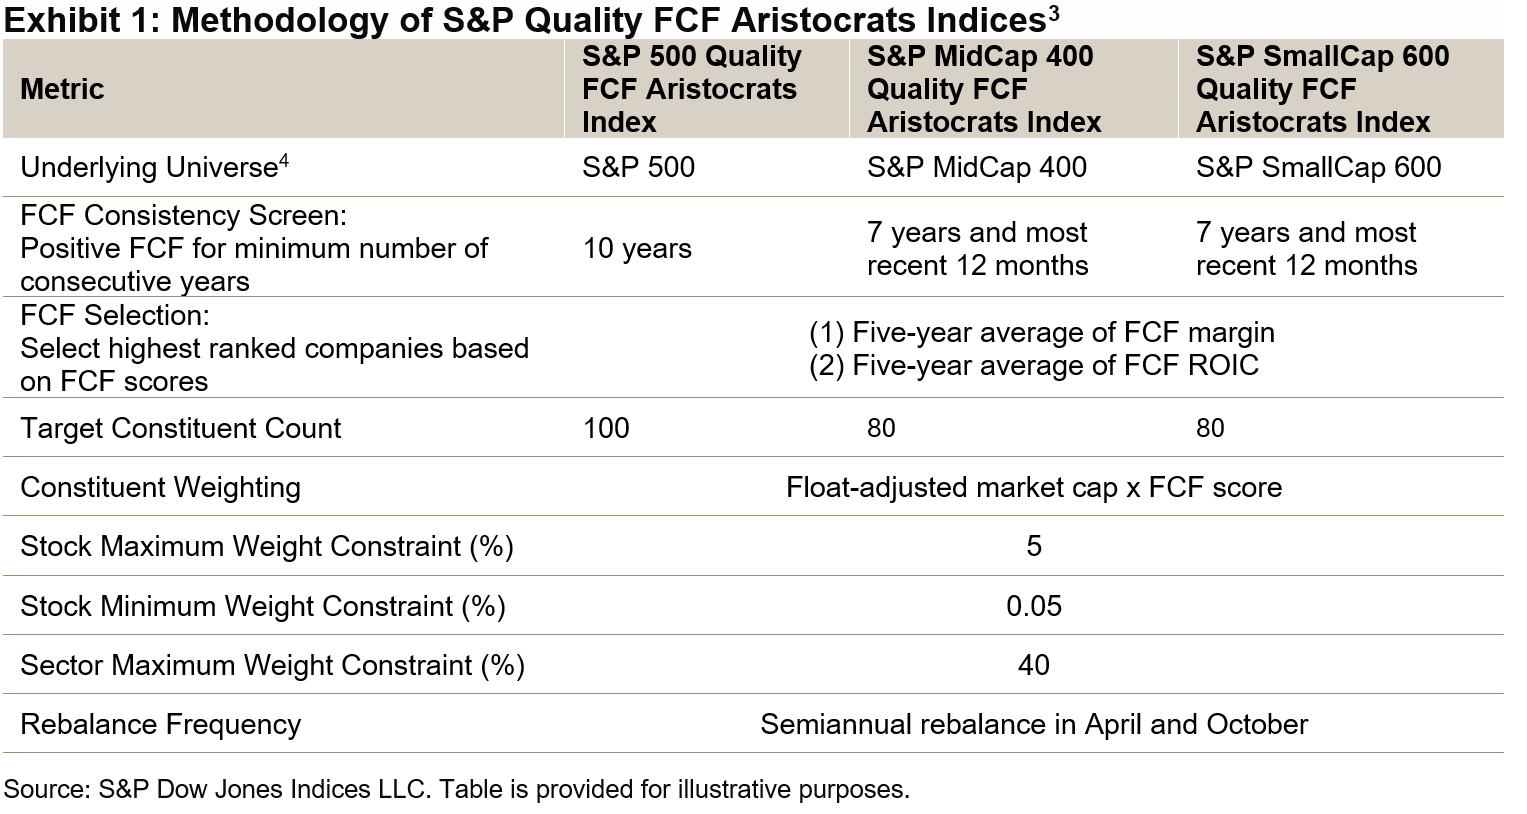
The S&P Quality FCF Aristocrats Indices highlight high-quality companies by focusing on the consistency and efficiency of FCF generation. To qualify, companies must first demonstrate a minimum number of consecutive years of positive FCF. From this subset, the top constituents are selected based on the average of their FCF margin1 and FCF return on invested capital (ROIC).2 These constituents are then weighted by their float market cap multiplied by their FCF score (see Exhibit 1).

Performance Comparison

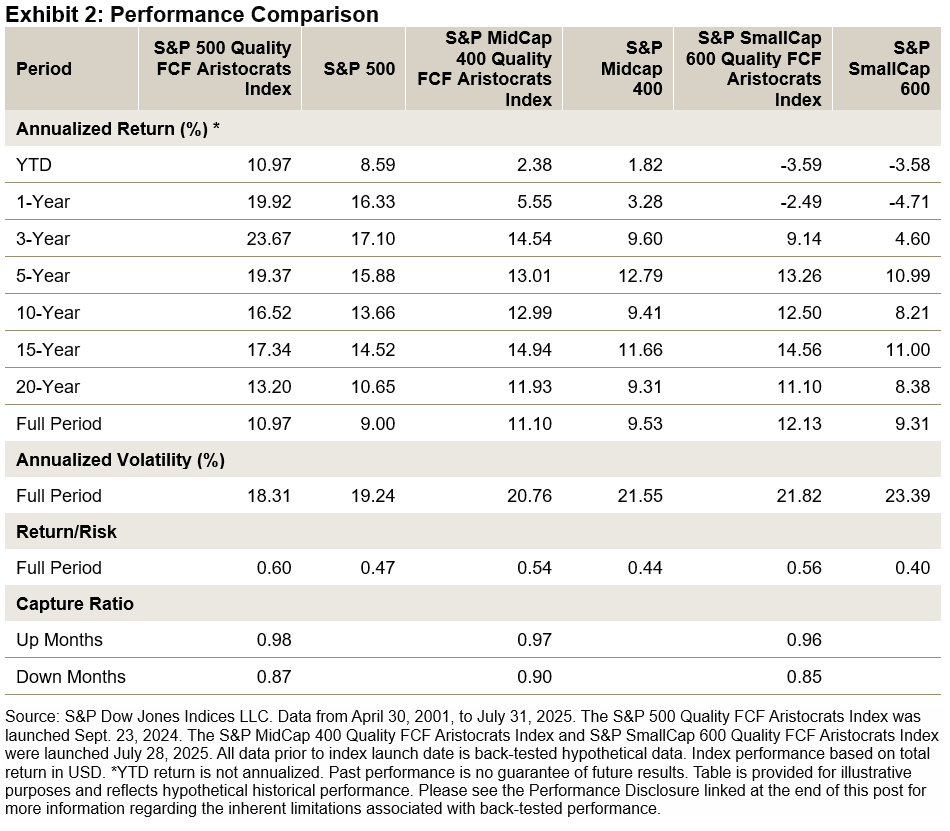
Historically, the S&P Quality FCF Aristocrats Indices have outperformed their respective underlying benchmarks across all market capitalizations, outperforming on both a total return and risk-adjusted return basis while exhibiting reduced volatility over short- and long-term horizons (see Exhibit 2).

Importantly, each of these indices exhibits consistent capture ratios relative to their benchmark universes, achieving nearly one-for-one participation in up markets while outperforming in down markets. This highlights the historical effectiveness of this framework and its ability to identify companies with quality growth potential and resilient characteristics across market cap segments.

Sector Profiles

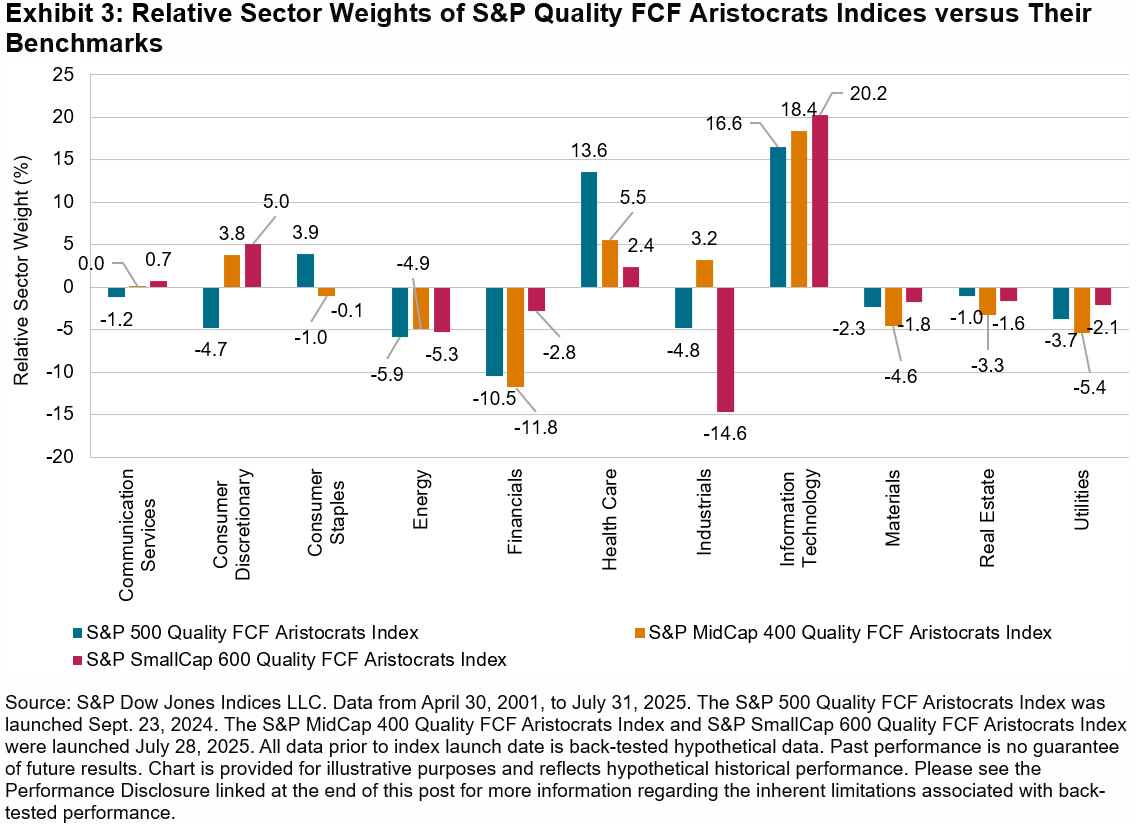
Next, we examine the relative sector weights5 of the S&P Quality FCF Aristocrats Indices in comparison to their corresponding underlying benchmarks. As shown in Exhibit 3, each of the indices has historically maintained a significant overweight in Information Technology, followed by Health Care, while exhibiting a notable underweight in Financials and Energy.
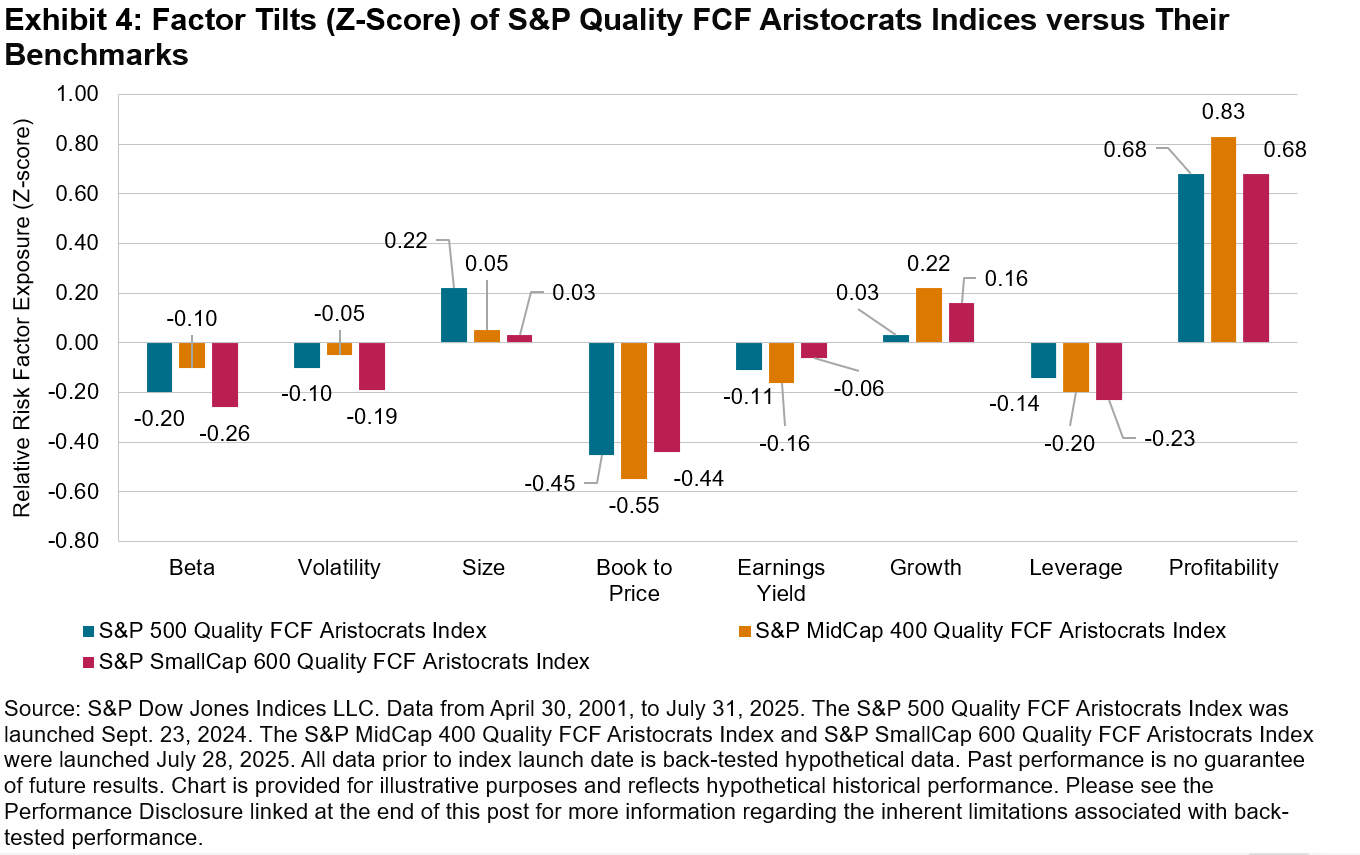
Factor Tilts

Exhibit 4 illustrates the factor tilts of the S&P Quality FCF Aristocrats Indices versus their respective benchmarks in terms of the FactSet Global Risk Model Factor Z-scores. Historically, they have exhibited lower volatility, larger size, higher growth, lower leverage and higher profitability tilts.

Conclusion

FCF serves as a valuable metric for identifying high quality companies across the large-, mid- and small-cap segments. By emphasizing consistent and efficient FCF generation, the S&P Quality FCF Aristocrats Indices offer a robust framework that has historically shown outperformance, defensive characteristics and solid fundamentals across all U.S. market capitalizations.

1 FCF margin is defined as FCF-to-revenue ratio.

2 FCF ROIC is defined as FCF-to-(total debt + equity) ratio.

3 For further details, please refer to S&P Quality FCF Aristocrats Indices Methodology.

4 All stocks classified in the following GICS® categories are not eligible for index inclusion: Real Estate (60), Banks (4010), Insurance (4030), Mortgage Real Estate Investment Trusts (REITs) (402040), Specialized Finance (40201040), Asset Management & Custody Banks (40203010) and Investment Banking & Brokerage (40203020). For more details, please see the index methodology.

5 Relative sector weight = Quality FCF Aristocrats sector weight – corresponding benchmark sector weight

The posts on this blog are opinions, not advice. Please read our Disclaimers.

The Momentum Factor: Thriving beyond U.S. Borders

Contributor Image
George Valantasis

Director, Factors and Dividends

S&P Dow Jones Indices

Many market participants have likely observed that the momentum factor has been among the top-performing equity styles in recent years. At the same time, a notable shift has occurred in regional performance: after years of underperformance, international developed equities are now outpacing U.S. equities—both YTD and over the past 12 months (see Exhibit 1).  By applying a momentum strategy to international markets, market participants can measure both regional and stock-level trends, allowing them to have a view of the strongest-performing developed market stocks outside of the U.S.

The S&P World Ex-U.S. Momentum Index serves as a benchmark for securities in developed markets, excluding the U.S., that exhibit strong momentum characteristics. In this blog, we will explore the index’s methodology, performance attributes and sector and region weights.

Index Methodology

The S&P World Ex-U.S. Momentum Index selects constituents based on 12-month risk-adjusted price momentum, excluding the latest month to account for short-term reversal effects. Securities are weighted by the product of their market capitalization and momentum score, utilizing a relatively unconstrainted approach to achieve a purer focus on momentum.

Performance Comparison

Exhibit 3 shows that the S&P World Ex-U.S. Momentum Index outperformed its broader universe across all timeframes analyzed. Furthermore, it has delivered greater risk-adjusted returns over the full period, exhibiting higher upside and lower downside capture relative to the S&P World Ex-U.S. Index.

Sector Weight Analysis

As of June 30, 2025, the S&P World Ex-U.S. Momentum Index showed a significant overweight in the Financials sector, resulting in slight underweights across most other sectors. Over the full period, while sector weights have fluctuated in response to prevailing trends, there has not been a consistent bias, resulting in average weights that are generally aligned with the benchmark universe. This contrasts with other well-known factors such as value, growth, low volatility and quality, which often exhibit persistent biases to specific sectors.

Region Weight Analysis

There were also some significant regional deviations, with Japan displaying a 13.5% underweight in the S&P World ex-U.S. Momentum Index, while Germany and Canada showed overweights of 9.2% and 5.3%, respectively. Over the full period, the indices aligned more closely, with the most significant difference being a 3.7% overweight in Canada for the S&P World ex-U.S. Momentum Index.

Conclusion

The S&P World Ex-U.S. Momentum Index has outperformed its broader universe in both absolute and risk-adjusted returns for nearly 30 years of back-tested history. Currently, the index shows significant overweights in the Financials sector, as well as in countries like Germany and Canada. Given the recent trends, the S&P World Ex-U.S. Momentum Index may be especially relevant for tracking top-performing developed market stocks outside the U.S.

The posts on this blog are opinions, not advice. Please read our Disclaimers.

Growing Models Usage Calls for Enhanced Data Intelligence and Delivery

Contributor Image
Brandon Hass

Global Head of Client Solutions Group, Direct Indexing and Model Portfolios

S&P Dow Jones Indices

The growing adoption of model portfolios among wealth managers has spurred asset managers, home offices and other model providers to expand their offerings. Accessing quality data on underlying indices is essential to model development—and in some cases can be a barrier to product innovation.

A recent whitepaper by Cerulli Associates1 examines the challenges asset managers and home offices face in accessing quality data and highlights the role index providers with expansive, user-friendly data capabilities can play in helping model providers differentiate their offerings.

Why Advisors Are Increasingly Using Models

Many advisors now view financial planning as their primary differentiator, instead of investment management, as their clients are focused more on achieving specific financial goals than outperforming benchmarks.2 As a result, model portfolios have emerged as an efficient way for advisors to outsource portfolio construction and spend more time serving clients and growing their practices.

Home offices are encouraging their advisors to incorporate models, as well. Models can help advisors scale their practices by providing a more consistent client experience, centralizing investment decision-making and reducing compliance risks. Cerulli expects these dynamics to drive the amount of assets managed through models to grow to USD 2.9 trillion by the end of 2025, up 38% since 2023.3

Unpacking the Model Data Challenge

As home offices and asset managers seek to expand and differentiate their model platforms, many are working with index providers to source data that is used to develop capital market assumptions and construct models.4

Index providers’ ability to deliver the data that model providers need, however, can vary significantly. To utilize index data effectively in model portfolio construction, Cerulli’s research5 suggests model providers focus on four important factors:

  • Quality: Encompassing reliable index performance, attribution analyses and timely rebalancing updates
  • Cost-effectiveness: Balancing licensing fees with data utility
  • Breadth: Providing comprehensive data across asset classes and geographies
  • Ease of use and access: Enabling efficient consumption and processing through effective delivery methods

These last two items are particularly important for model managers to consider as they evaluate organizations to source data from efficiently. Working with index providers that offer comprehensive data across asset classes—including more fragmented markets such as fixed income, international equity and alternatives—may help to streamline model development, eliminate data gaps and reduce the risk of incongruent or overlapping investment data from multiple sources.6

Model providers also need data suppliers who can deliver this information via efficient, user-friendly channels. Managing models requires frequent, seamless data updates to facilitate quick responses to market shifts, and outdated and manual delivery methods can create friction. Cerulli notes that streamlined data intake and tech integration allow model providers to construct portfolios faster, enhancing operational efficiency.7

Collaborating to Enhance Data Intelligence and Delivery

As model portfolio assets rise, model providers can enhance their portfolio construction processes by working with index providers that address data challenges effectively.

Index providers with robust data spanning multiple asset classes and flexible, tech-enabled delivery options are well-positioned to support these needs. Model managers need consistent, timely and reliable data for tracking global financial markets, including comprehensive performance and constituent data. Furthermore, the integration of flexible, tech-enabled delivery options, such as API-driven tools, allows for seamless access to this valuable information, enhancing the ability of model providers to leverage data within their internal systems.

Explore the Cerulli Associates whitepaper “Redefining the Role of Index Providers” for deeper insights on optimizing index data to strengthen model portfolio construction.


1 The Cerulli Associates’ whitepaper “Redefining the Role of Index Providers” was sponsored by S&P Dow Jones Indices. Please see page 2.

2 Please see page 4 of Cerulli Associates’ “Redefining the Role of Index Providers.”

3 Please see page 8 of Cerulli Associates’ “Redefining the Role of Index Providers.”

4 Please see pages 8 and 16 of Cerulli Associates’ “Redefining the Role of Index Providers.”

5 Please see page 16 of Cerulli Associates’ “Redefining the Role of Index Providers.”

6 Please see pages 16–17 of Cerulli Associates’ “Redefining the Role of Index Providers.”

7 Please see page 17 of Cerulli Associates’ “Redefining the Role of Index Providers.”

The posts on this blog are opinions, not advice. Please read our Disclaimers.

Quality by Design: A Deep Dive into the S&P SmallCap 600

Contributor Image
Cristopher Anguiano

Associate Director, U.S. Equity Indices

S&P Dow Jones Indices

The S&P SmallCap 600® represents the U.S. small-cap equity market by tracking companies that meet specific liquidity and financial viability criteria. While both the S&P 600® and Russell 2000 target this segment, their performance has diverged significantly. Since 1994, the S&P 600—built on a rules-based methodology—has consistently outperformed the Russell 2000, delivering a 1.6% higher average return with lower volatility, resulting in a 0.1 improvement in risk-adjusted performance. This gap widened over longer periods (see Exhibit 1).

A key driver of this outperformance has been the S&P 600’s statistically significant exposure to the quality factor, which explains about 74.7% of its historical outperformance. Unlike the Russell 2000, the S&P 600 applies an earnings screen that requires consistent profitability for new constituents—a feature historically linked to outperformance in small caps. This analysis explores whether that screen has underpinned the index’s quality tilt (see Exhibit 2).

To test this, we used the S&P United States SmallCap Index, which seeks to measure the performance of all constituents in the S&P United States BMI classified as small cap, to construct four hypothetical compositions.1

  • Float Composition: Securities with at least 10% public float.2
  • Liquidity Composition: Securities with at least 75% annual dollar value traded relative to float-adjusted market cap, with at least 250,000 shares traded monthly.
  • Earnings Composition: Securities with positive as-reported earnings over the past four quarters.
  • Blended Composition: Securities meeting all three criteria.

Only the earnings and blended compositions showed strong positive quality factor loadings and superior long-term returns—highlighting profitability as the main contributor to the S&P 600’s quality tilt (see Exhibit 3).

These compositions also aligned with key S&P Quality Index metrics—higher ROE, better earnings quality and lower leverage—closely resembling the S&P 600, while the Russell 2000 lagged (see Exhibit 4).

Conclusion

The S&P 600’s consistent historical outperformance over the Russell 2000 has stemmed from its earnings-based quality tilt. By requiring a profitability screening, the index tracks small-cap companies with strong and stable fundamentals. This underscores the importance of index design and why index construction matters—quality, in this case, is built by design.

1 To avoid survivorship and look-ahead bias, we included both active/inactive securities and lagged fundamental data by 45 days. Back-testing ran from December 2002 to May 2025, with quarterly rebalancing. Compositions were equally weighted, though results were consistent under cap weighting.

2 The public float criterion for the S&P SmallCap 600 was 50% prior to April 30, 2019.

The posts on this blog are opinions, not advice. Please read our Disclaimers.

Insurance Idiosyncrasies

Contributor Image
Nick Didio

Quantitative Analyst, Index Investment Strategy

S&P Dow Jones Indices

The publication of the 10th annual report on exchange-traded fund (ETF) usage in U.S. insurance general accounts explores insurer ETF usage and its evolution over the past 20 years. At year-end 2024, 623 insurance companies collectively held USD 39.3 billion in ETFs. ETF AUM held by insurance companies in 2024 increased by over 14% compared to 2023. Of the 623 companies that owned ETFs, 452 increased their ETF AUM.

These assets were not evenly distributed. As illustrated in Exhibit 1, nine insurers accounted for half of the total insurance company ETF AUM, while 10% of insurance companies (63 firms) held 80% of the same.

In a concentrated distribution, the actions of individual companies—particularly the larger ones—can have significant impacts. Exhibit 2 breaks down asset growth by company size among those companies that held ETFs at the end of 2023.1 It shows that larger insurers increased their holdings the most, with the average being higher than the median—indicating that a few buyers were driving the increases within their size class, particularly among Mega companies.

A different skew is visible in the change in holdings when grouped by the magnitude of assets already held at the end of the previous year.2 Exhibit 3 demonstrates that some firms with the smallest previous holdings had some of the largest relative moves, with a 49% average increase for the smallest holdings quartile.

It is evident that among insurers, ETF asset growth can vary markedly. The potentially outsized impact of larger firms (or firms making large changes) on the aggregate statistics can make deeper analysis worth the effort. Discover how the actions of a few affected the insurance landscape in the latest ETFs in Insurance General Accounts – 2025 report.

1 There were 73 companies that held ETFs in 2024 but did not in 2023. These were excluded from the analysis in Exhibit 2 due to the impossibility of quantifying percentage change from a quantity starting at 0. For analysis by absolute change in ETF AUM by company size, which includes these companies, see Ganti, Anu, Nicholas Didio and Sabatino Longo, “ETFs in Insurance General Accounts – 2025.” S&P Down Jones Indices LLC. June 2025. Company size definitions can also be found in the appendix.

2 Based on holdings as of Dec. 31, 2023. Companies that held ETFs in 2024 but not 2023 were excluded.

The posts on this blog are opinions, not advice. Please read our Disclaimers.