Get Indexology® Blog updates via email.

In This List

Growing Models Usage Calls for Enhanced Data Intelligence and Delivery

Quality by Design: A Deep Dive into the S&P SmallCap 600

Insurance Idiosyncrasies

Tailwinds in Asian and Asia-Pacific Local Currency Fixed Income?

Tracking the Quantum (Computing) Universe

Growing Models Usage Calls for Enhanced Data Intelligence and Delivery

Contributor Image
Brandon Hass

Global Head of Client Solutions Group, Direct Indexing and Model Portfolios

S&P Dow Jones Indices

The growing adoption of model portfolios among wealth managers has spurred asset managers, home offices and other model providers to expand their offerings. Accessing quality data on underlying indices is essential to model development—and in some cases can be a barrier to product innovation.

A recent whitepaper by Cerulli Associates1 examines the challenges asset managers and home offices face in accessing quality data and highlights the role index providers with expansive, user-friendly data capabilities can play in helping model providers differentiate their offerings.

Why Advisors Are Increasingly Using Models

Many advisors now view financial planning as their primary differentiator, instead of investment management, as their clients are focused more on achieving specific financial goals than outperforming benchmarks.2 As a result, model portfolios have emerged as an efficient way for advisors to outsource portfolio construction and spend more time serving clients and growing their practices.

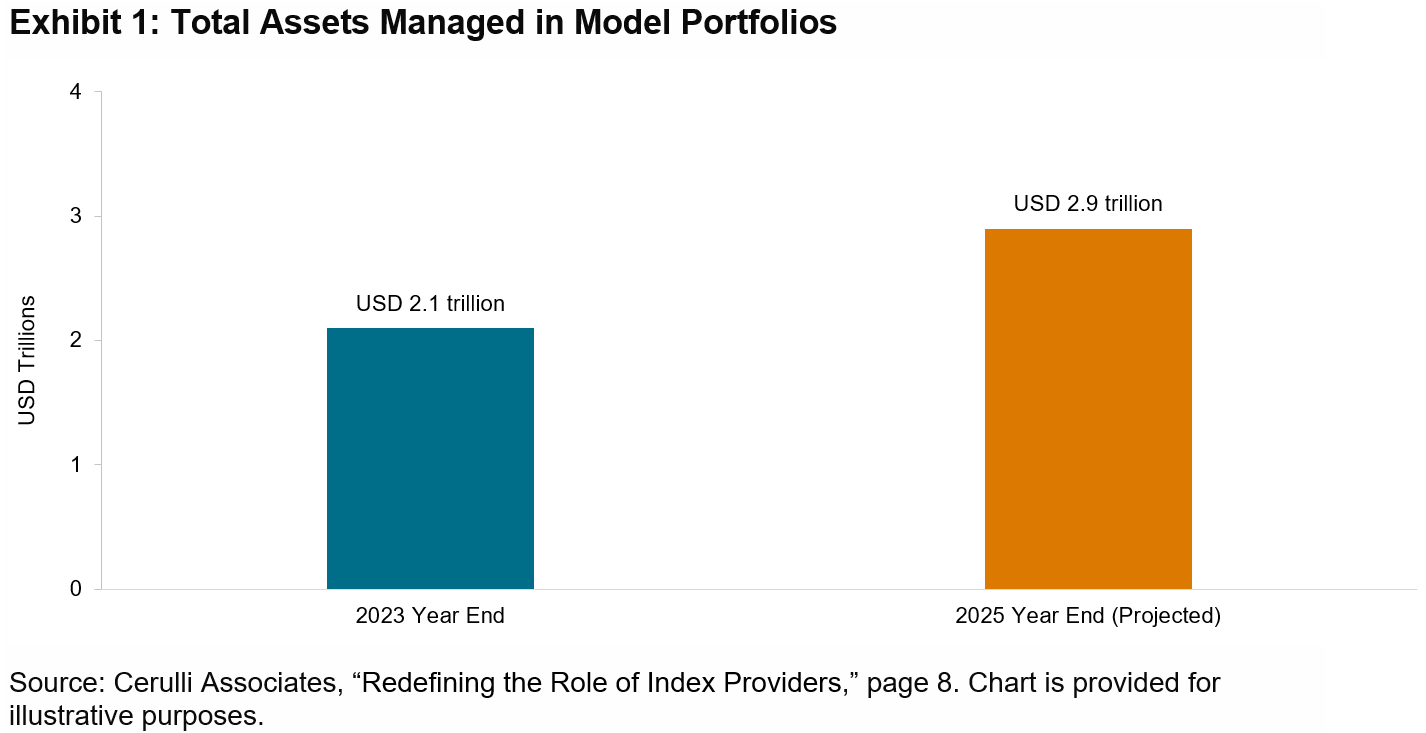
Home offices are encouraging their advisors to incorporate models, as well. Models can help advisors scale their practices by providing a more consistent client experience, centralizing investment decision-making and reducing compliance risks. Cerulli expects these dynamics to drive the amount of assets managed through models to grow to USD 2.9 trillion by the end of 2025, up 38% since 2023.3

Unpacking the Model Data Challenge

As home offices and asset managers seek to expand and differentiate their model platforms, many are working with index providers to source data that is used to develop capital market assumptions and construct models.4

Index providers’ ability to deliver the data that model providers need, however, can vary significantly. To utilize index data effectively in model portfolio construction, Cerulli’s research5 suggests model providers focus on four important factors:

  • Quality: Encompassing reliable index performance, attribution analyses and timely rebalancing updates
  • Cost-effectiveness: Balancing licensing fees with data utility
  • Breadth: Providing comprehensive data across asset classes and geographies
  • Ease of use and access: Enabling efficient consumption and processing through effective delivery methods

These last two items are particularly important for model managers to consider as they evaluate organizations to source data from efficiently. Working with index providers that offer comprehensive data across asset classes—including more fragmented markets such as fixed income, international equity and alternatives—may help to streamline model development, eliminate data gaps and reduce the risk of incongruent or overlapping investment data from multiple sources.6

Model providers also need data suppliers who can deliver this information via efficient, user-friendly channels. Managing models requires frequent, seamless data updates to facilitate quick responses to market shifts, and outdated and manual delivery methods can create friction. Cerulli notes that streamlined data intake and tech integration allow model providers to construct portfolios faster, enhancing operational efficiency.7

Collaborating to Enhance Data Intelligence and Delivery

As model portfolio assets rise, model providers can enhance their portfolio construction processes by working with index providers that address data challenges effectively.

Index providers with robust data spanning multiple asset classes and flexible, tech-enabled delivery options are well-positioned to support these needs. Model managers need consistent, timely and reliable data for tracking global financial markets, including comprehensive performance and constituent data. Furthermore, the integration of flexible, tech-enabled delivery options, such as API-driven tools, allows for seamless access to this valuable information, enhancing the ability of model providers to leverage data within their internal systems.

Explore the Cerulli Associates whitepaper “Redefining the Role of Index Providers” for deeper insights on optimizing index data to strengthen model portfolio construction.


1 The Cerulli Associates’ whitepaper “Redefining the Role of Index Providers” was sponsored by S&P Dow Jones Indices. Please see page 2.

2 Please see page 4 of Cerulli Associates’ “Redefining the Role of Index Providers.”

3 Please see page 8 of Cerulli Associates’ “Redefining the Role of Index Providers.”

4 Please see pages 8 and 16 of Cerulli Associates’ “Redefining the Role of Index Providers.”

5 Please see page 16 of Cerulli Associates’ “Redefining the Role of Index Providers.”

6 Please see pages 16–17 of Cerulli Associates’ “Redefining the Role of Index Providers.”

7 Please see page 17 of Cerulli Associates’ “Redefining the Role of Index Providers.”

The posts on this blog are opinions, not advice. Please read our Disclaimers.

Quality by Design: A Deep Dive into the S&P SmallCap 600

Contributor Image
Cristopher Anguiano

Associate Director, U.S. Equity Indices

S&P Dow Jones Indices

The S&P SmallCap 600® represents the U.S. small-cap equity market by tracking companies that meet specific liquidity and financial viability criteria. While both the S&P 600® and Russell 2000 target this segment, their performance has diverged significantly. Since 1994, the S&P 600—built on a rules-based methodology—has consistently outperformed the Russell 2000, delivering a 1.6% higher average return with lower volatility, resulting in a 0.1 improvement in risk-adjusted performance. This gap widened over longer periods (see Exhibit 1).

A key driver of this outperformance has been the S&P 600’s statistically significant exposure to the quality factor, which explains about 74.7% of its historical outperformance. Unlike the Russell 2000, the S&P 600 applies an earnings screen that requires consistent profitability for new constituents—a feature historically linked to outperformance in small caps. This analysis explores whether that screen has underpinned the index’s quality tilt (see Exhibit 2).

To test this, we used the S&P United States SmallCap Index, which seeks to measure the performance of all constituents in the S&P United States BMI classified as small cap, to construct four hypothetical compositions.1

  • Float Composition: Securities with at least 10% public float.2
  • Liquidity Composition: Securities with at least 75% annual dollar value traded relative to float-adjusted market cap, with at least 250,000 shares traded monthly.
  • Earnings Composition: Securities with positive as-reported earnings over the past four quarters.
  • Blended Composition: Securities meeting all three criteria.

Only the earnings and blended compositions showed strong positive quality factor loadings and superior long-term returns—highlighting profitability as the main contributor to the S&P 600’s quality tilt (see Exhibit 3).

These compositions also aligned with key S&P Quality Index metrics—higher ROE, better earnings quality and lower leverage—closely resembling the S&P 600, while the Russell 2000 lagged (see Exhibit 4).

Conclusion

The S&P 600’s consistent historical outperformance over the Russell 2000 has stemmed from its earnings-based quality tilt. By requiring a profitability screening, the index tracks small-cap companies with strong and stable fundamentals. This underscores the importance of index design and why index construction matters—quality, in this case, is built by design.

1 To avoid survivorship and look-ahead bias, we included both active/inactive securities and lagged fundamental data by 45 days. Back-testing ran from December 2002 to May 2025, with quarterly rebalancing. Compositions were equally weighted, though results were consistent under cap weighting.

2 The public float criterion for the S&P SmallCap 600 was 50% prior to April 30, 2019.

The posts on this blog are opinions, not advice. Please read our Disclaimers.

Insurance Idiosyncrasies

Contributor Image
Nick Didio

Quantitative Analyst, Index Investment Strategy

S&P Dow Jones Indices

The publication of the 10th annual report on exchange-traded fund (ETF) usage in U.S. insurance general accounts explores insurer ETF usage and its evolution over the past 20 years. At year-end 2024, 623 insurance companies collectively held USD 39.3 billion in ETFs. ETF AUM held by insurance companies in 2024 increased by over 14% compared to 2023. Of the 623 companies that owned ETFs, 452 increased their ETF AUM.

These assets were not evenly distributed. As illustrated in Exhibit 1, nine insurers accounted for half of the total insurance company ETF AUM, while 10% of insurance companies (63 firms) held 80% of the same.

In a concentrated distribution, the actions of individual companies—particularly the larger ones—can have significant impacts. Exhibit 2 breaks down asset growth by company size among those companies that held ETFs at the end of 2023.1 It shows that larger insurers increased their holdings the most, with the average being higher than the median—indicating that a few buyers were driving the increases within their size class, particularly among Mega companies.

A different skew is visible in the change in holdings when grouped by the magnitude of assets already held at the end of the previous year.2 Exhibit 3 demonstrates that some firms with the smallest previous holdings had some of the largest relative moves, with a 49% average increase for the smallest holdings quartile.

It is evident that among insurers, ETF asset growth can vary markedly. The potentially outsized impact of larger firms (or firms making large changes) on the aggregate statistics can make deeper analysis worth the effort. Discover how the actions of a few affected the insurance landscape in the latest ETFs in Insurance General Accounts – 2025 report.

1 There were 73 companies that held ETFs in 2024 but did not in 2023. These were excluded from the analysis in Exhibit 2 due to the impossibility of quantifying percentage change from a quantity starting at 0. For analysis by absolute change in ETF AUM by company size, which includes these companies, see Ganti, Anu, Nicholas Didio and Sabatino Longo, “ETFs in Insurance General Accounts – 2025.” S&P Down Jones Indices LLC. June 2025. Company size definitions can also be found in the appendix.

2 Based on holdings as of Dec. 31, 2023. Companies that held ETFs in 2024 but not 2023 were excluded.

The posts on this blog are opinions, not advice. Please read our Disclaimers.

Tailwinds in Asian and Asia-Pacific Local Currency Fixed Income?

Contributor Image
Kangwei Yang

Director, Fixed Income Product Management

S&P Dow Jones Indices

For decades, the U.S. dollar bond market has been the undisputed first choice for global issuers due to ease of access for global investors, scale of funding and underlying liquidity. However, growing uncertainties in the U.S. fiscal landscape are challenging the Treasury market’s status as the world’s primary safe-haven asset. As we move through 2025, there are certainly some powerful tailwinds gathering behind Asian local currency fixed income. A growing number of both issuers and investors are now recognizing the compelling stability and relative value offered within Asia’s increasingly vibrant bond markets.

Some market perspectives are also evolving beyond the traditional “Asia ex-Japan” perspective, with discussions expanding to include the local currency bond markets of Australia and Japan to create a more comprehensive Asia-Pacific focus. By including the large, liquid and high quality government bond markets of Japan and Australia, this broader Asia-Pacific scope may enhance overall diversification and credit quality.

Year-to-date (as of June 30, 2025), the performance of U.S. Treasuries (up 3.77%, as represented by the iBoxx $ Treasuries) has lagged our flagship Asian local currency indices (see Exhibit 1). The iBoxx Asian Bond Fund (ABF) Pan-Asia (USD Unhedged), made up of sovereign and quasi-sovereign bonds from eight Asian local markets,1 was up 8.13% YTD, while the iBoxx Asian Local Bond Index (ALBI) (USD Unhedged), made up predominantly of sovereign and quasi-sovereign bonds (approximately 95%) from 10 Asian markets,2 gained 7.66%. For the same period, both the Australian and Japanese bond markets, represented by the S&P/ASX iBoxx Australian & State Governments Index (USD Unhedged) and iBoxx Global Government Japan (USD Unhedged), also outperformed U.S. Treasuries, gaining 9.60% and 6.40%, respectively.

Performance from a Diversification Perspective

Over the past 10 years, Asia-Pacific local currency bond indices have shown only a low-to-moderate correlation to U.S. Treasuries, demonstrating their diversification characteristics (see Exhibit 2). The iBoxx ALBI and iBoxx ABF Pan-Asia indices both had a correlation of approximately 0.50 against the iBoxx $ Treasuries, while the relationship was even weaker for Australian (0.45) and Japanese (0.43) government bonds.

A Look from the FX Angle

With the development of Asian (and Asia-Pacific) markets in recent years, the region is no longer being seen as simply an emerging market allocation, with its growing complexity and diverse performance profiles coming into focus.

For global investors, total return is driven not just by yield, but also by capital gains from bond price appreciation. Crucially, the added exposure to foreign exchange (FX) when investing in Asia-Pacific local markets, in favorable market conditions, may serve as a potent source of excess returns.

Exhibit 3 demonstrates the crucial role of FX in local currency bond markets. As shown, appreciation against the U.S. dollar has been one of the key drivers of performance across the Asia-Pacific region this year, excluding only the Hong Kong dollar (which is pegged to the U.S. dollar) and Indonesian rupiah. In fact, for markets like South Korea and Singapore, the FX gains were so substantial that they surpassed capital and accrual gains, highlighting currency as a key performance component YTD.

Looking Ahead

The sheer diversity of the Asia-Pacific fixed income market presents both a challenge and an opportunity.  This brings us to the road ahead. With the broad theme of de-dollarization set to continue, will Asia ex-Japan or Asia-Pacific local currency fixed income catch the tailwind and gain from this wave?

To keep up with the performance of our suite of Asia-Pacific fixed income indices, please see our monthly APAC Fixed Income dashboard.

1 iBoxx ABF Pan-Asia consists of eight eligible local Asian markets, including China, Hong Kong, Indonesia, Malaysia, Philippines, Singapore, South Korea and Thailand

2 The iBoxx ALBI consists of 10 eligible local Asian markets, including China Onshore, China Offshore, Hong Kong, India, Indonesia, Malaysia, Philippines, Singapore, South Korea and Thailand

The posts on this blog are opinions, not advice. Please read our Disclaimers.

Tracking the Quantum (Computing) Universe

Contributor Image
Abbie Zhang

Senior Analyst, Thematic Indices

S&P Dow Jones Indices

With the power to disrupt traditional computing paradigms, quantum computing has become a focal point of both industrial transformation and investor enthusiasm.1 Its capacity to execute complex calculations at unmatched speeds unlocks a myriad of possibilities. To track this evolving space of quantum technologies, S&P Dow Jones Indices (S&P DJI) launched the S&P Kensho Global Quantum Computing Technologies Index, which measures the performance of global companies producing proof-of-concept or commercialized quantum computing technologies, as well as producers of the sub-components that are vital to the development and operation of quantum computers.

From Bits to Qubits: The Growth of Quantum Computing

Quantum computing is a transformative technology that uses quantum physics to address complex problems. Unlike classical bits that represent 0 or 1, quantum bits (qubits) leverage superposition to represent both simultaneously. When entangled, qubits enable quantum computers to tackle complex calculations beyond classical reach.

Currently, quantum solutions are best suited for specific problem types, and while the broader impact is still on the horizon, key technical challenges are being actively explored.2

Prominent areas where quantum computing applications are being actively researched and deployed include cybersecurity, supply chain optimization and drug discovery.3, 4

The global quantum computing industry is experiencing rapid growth, with its market value estimated to be at USD 1.79 billion as of January 2025, with a projected CAGR of 31.64%, potentially reaching USD 7.08 billion by 2030.5 Investments from both government and private sectors are surging, with billions of dollars dedicated to research and development.6

S&P Kensho Global Quantum Computing Technologies Index

The S&P Kensho Global Quantum Computing Technologies Index tracks companies producing quantum computing technologies as well as producers of the sub-components and materials that are applicable to the development and operation of quantum computers. The index includes companies from across the value chain of developing and deploying quantum computing technologies (see Exhibit 1).

  • Quantum Hardware: This encompasses quantum computers and the materials and equipment they rely on, such as quantum chips, processors, circuits, sensors, networks, superconducting technology and quantum bits. Notable companies include IonQ, specializing in quantum computer development, and Lam Research, which manufactures semiconductor processing equipment.
  • Software and Systems: This includes operating systems, quantum algorithms, programming languages and systems that facilitate quantum simulations and calculations. D-Wave Quantum is a key player, providing quantum computing systems, software and services globally.
  • Quantum-Computing-as-a-Service (QCaaS): Rigetti Computing exemplifies this area by offering quantum processing units (QPUs) and systems through cloud-based QCaaS products.
  • Sub-Components and Materials: This category includes quantum cryptography, simulators, emulators and cryogenic infrastructure essential for quantum chip development. Honeywell stands out for its automation and control technologies that support cryogenic applications.

The index utilizes Kensho’s natural language processing (NLP)-based platform, along with S&P Global’s extensive company documents dataset to tag companies relevant to the evolving field of quantum computing.

Index Composition and Performance

The S&P Kensho Global Quantum Computing Technologies Index currently consists of 23 constituents, with a significant 80% weight attributed to U.S.-domiciled companies (see Exhibit 2).

Based on back-tested data, the S&P Kensho Global Quantum Computing Technologies Index has outperformed the S&P 500® by an annualized return of 21.68% over the past three years, albeit with increased volatility (see Exhibit 3). This performance has come with asset growth, with nearly USD 2 billion in assets under management (AUM) in exchange-traded funds (ETFs) tracking the Quantum Computing theme.7

Conclusion

As a benchmark for this rapidly advancing quantum computing field, the S&P Kensho Global Quantum Computing Technologies Index tracks the progress of a transformative technology that has the potential to reshape multiple areas of the economy.

1   Separating the wheat from the chaff: Quantum technology in an era of hype

2   Quantum Computing: Applications and Challenges

3   What is Quantum Security and how does it Work?

4   The Quantum Supply Chain: Mapping the Market and Key Players

5   Quantum Computing Market Outlook 2025-2030, with Profiles

6   Benchmarking Quantum Technology Performance: Governments, Industry, Academia and their Role in Shaping our Technological Future

7 Source: S&P Dow Jones Indices and Morningstar as of July 11, 2025.

The posts on this blog are opinions, not advice. Please read our Disclaimers.