U.S. equities have staged a remarkable recovery in the past few months, shrugging off inflation concerns, trade tensions and geopolitical risks, all of which has culminated in multiple all-time highs. Meanwhile, the significant outperformance of the momentum factor, or the continued strength of winning stocks, coupled with the dominance of a few mega-cap companies, especially within the Technology sector, can lead to concentration, valuation and reversal concerns.
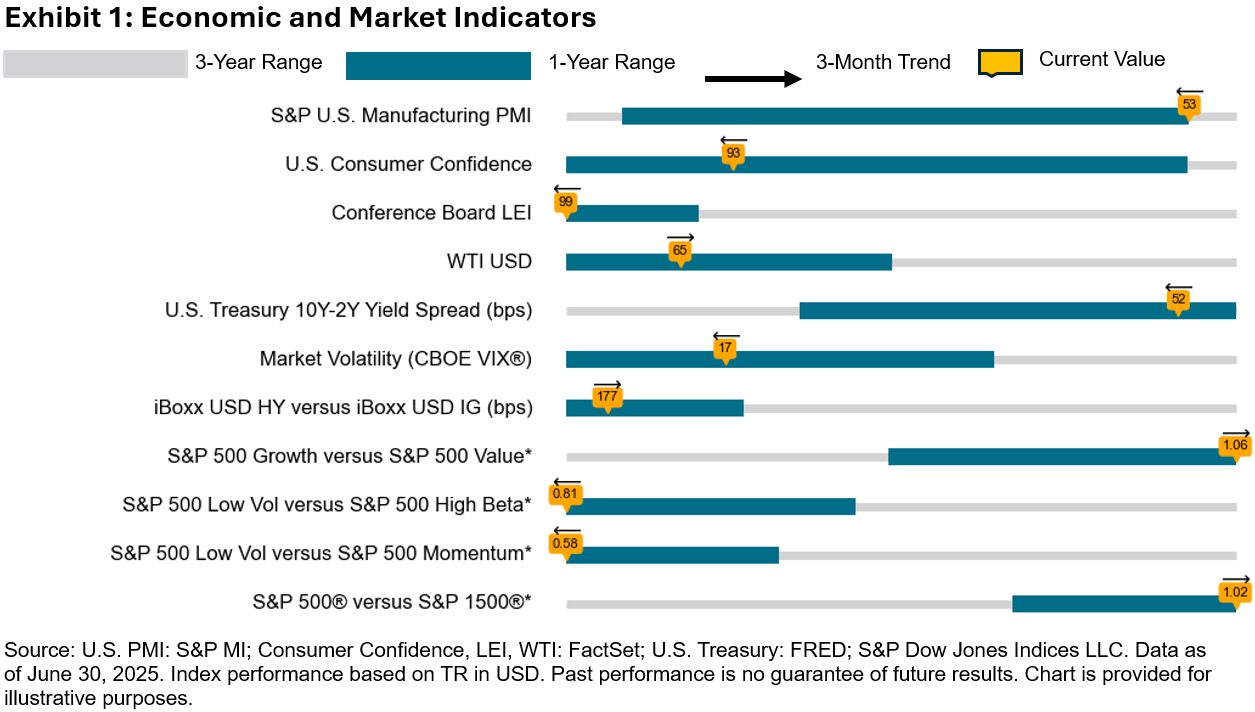
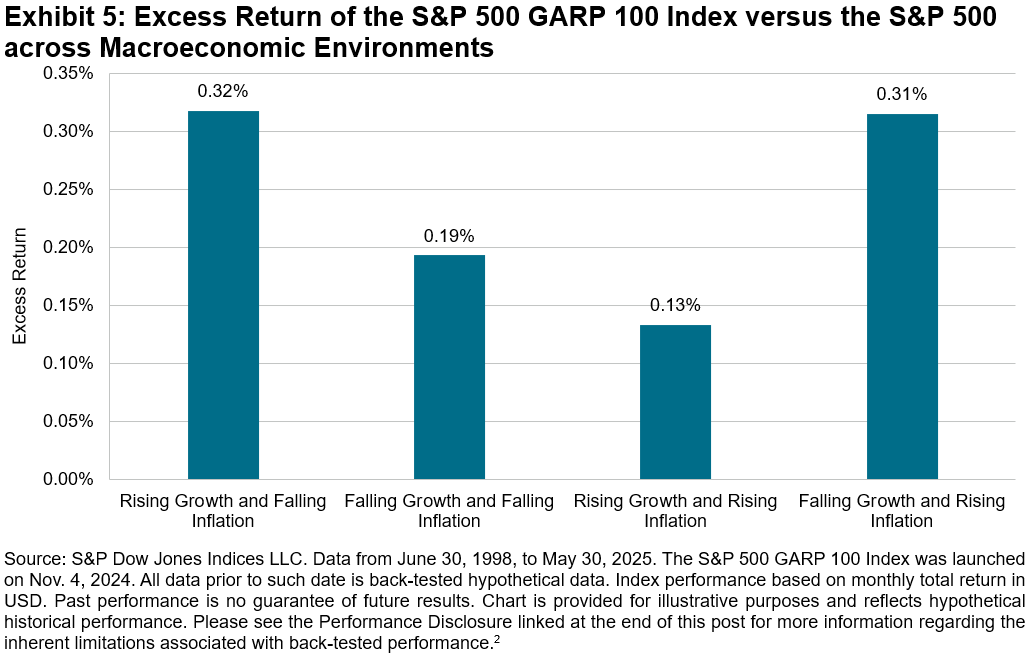
Illustrating these extended price and concentration trends, the left-hand side of Exhibit 1 shows that the S&P 500 Momentum Index’s cumulative relative outperformance has reached levels last seen during the height of the 90’s dot-com bubble, which was notably followed by a sharp reversal. The right-hand side of Exhibit 1 shows that the U.S. equity market is also unusually concentrated, as measured by the Herfindahl-Hirschman Index (HHI),1 a widely used concentration measure.
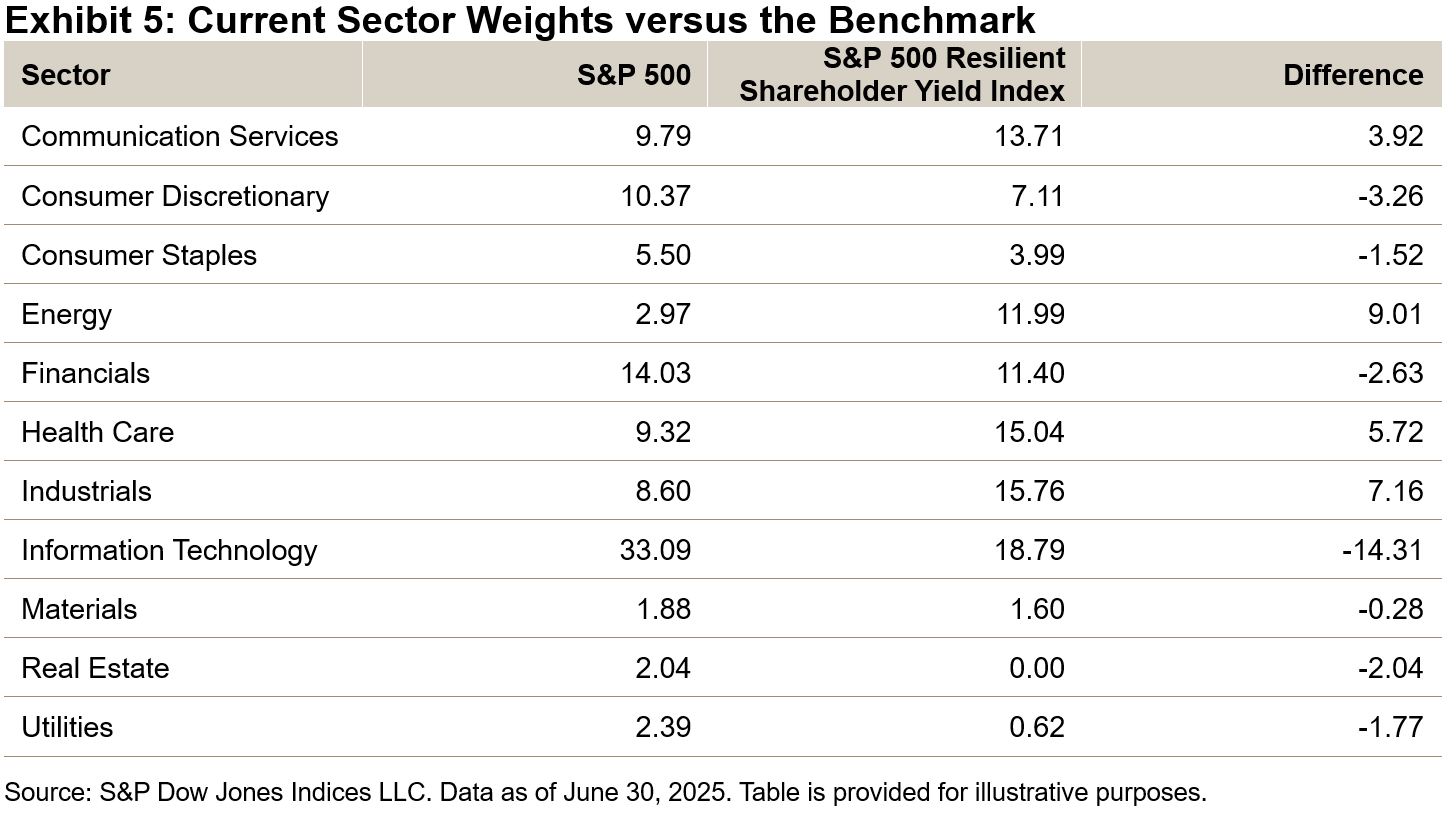
The Tech sector has been a prominent showcase of these trends, currently making up 33% of the S&P 500® and 22% of the S&P 500 Momentum Index’s weight. The S&P 500 Information Technology sector outperformed the S&P 500 by 13% in Q2, most recently capped by Nvidia’s milestone of becoming the first public company ever to reach a USD 4 trillion market capitalization.2
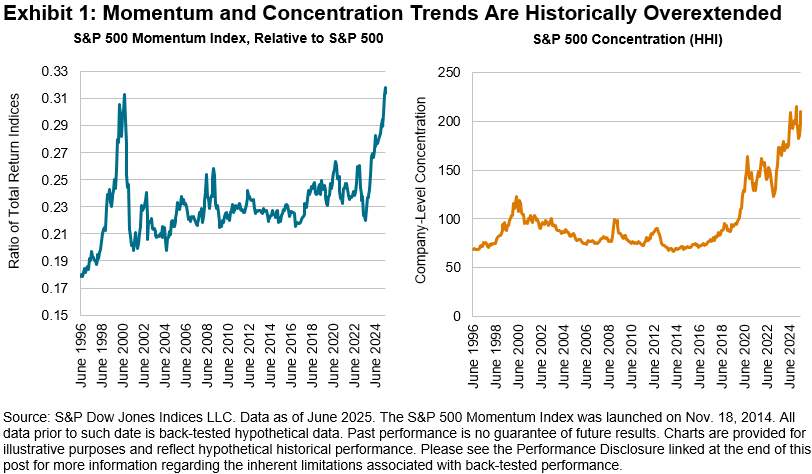
The Tech sector’s current adjusted HHI3 level of 9.3 indicates an extreme level of concentration for the sector compared to the long-term average of 5.2, consistent with what was observed for the broader market. As Exhibit 2 shows, when concentration has been relatively high in the past, it has subsequently tended to decline.
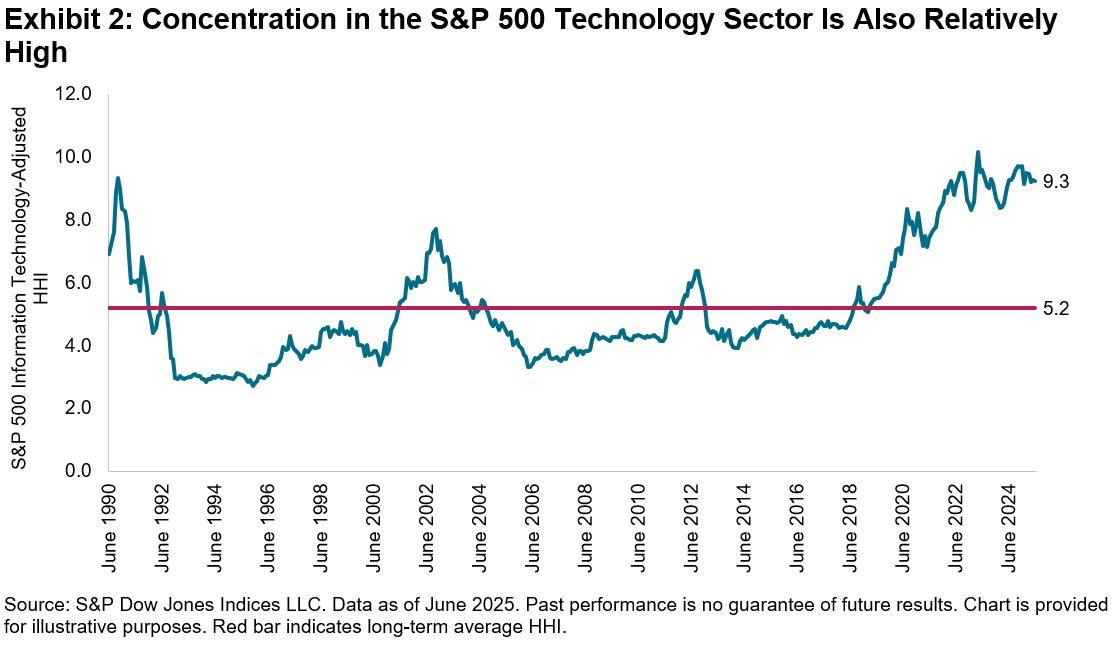
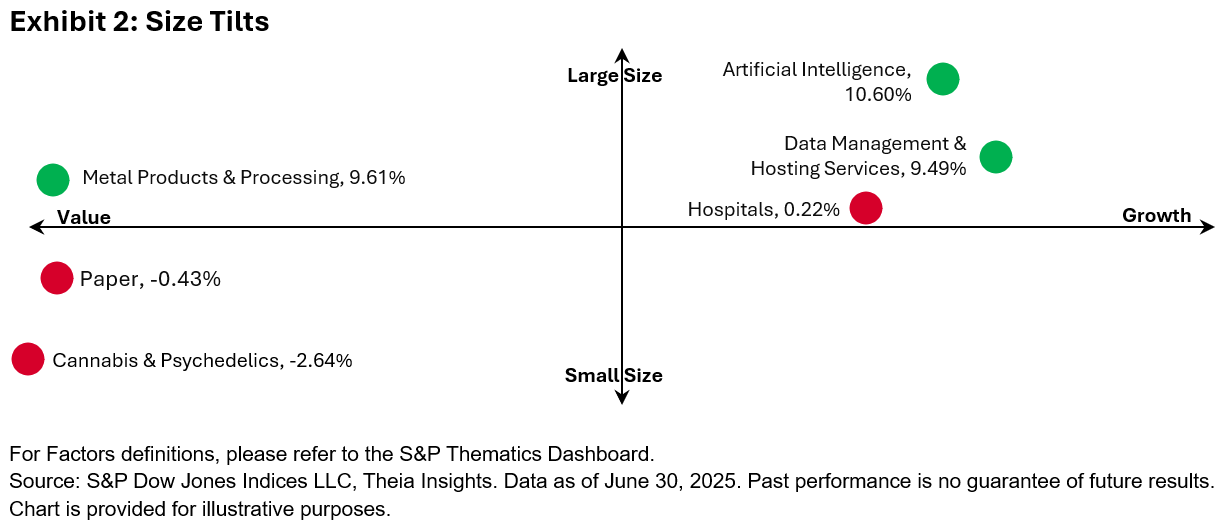
But for market participants seeking an index that measures Tech that simultaneously mitigates the concerns noted earlier, an equal-weight approach to large-cap Tech may be of particular interest. Exhibit 3 shows that the S&P 500 Equal Weight Information Technology Index, by rebalancing on a quarterly frequency, has a stronger tilt to small size, away from momentum and toward value compared to its cap-weighted peer (using the modified capitalization-weighted Technology Select Sector Index) relative to the S&P 500. These factor weights, while not static, are broadly consistent with the underlying S&P 500 Equal Weight Index’s factor profile, of which the smaller size and anti-momentum biases in particular have driven the index’s long-term outperformance.
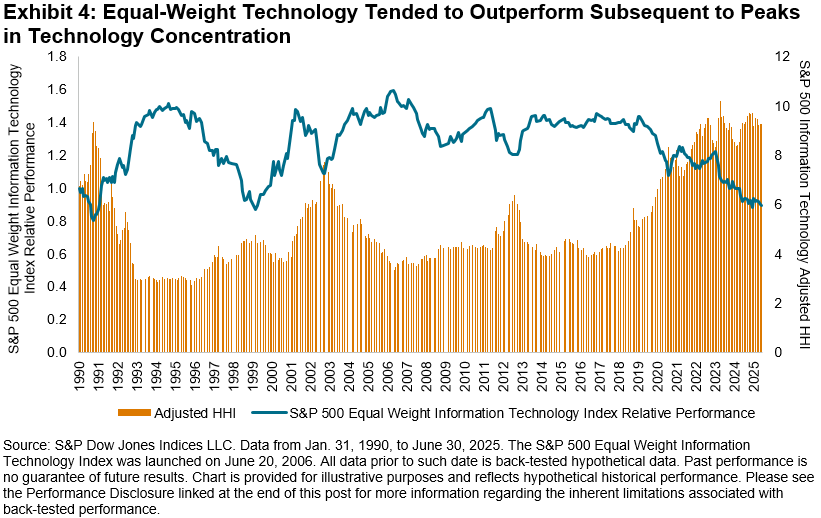
The tendency of the momentum factor and Tech concentration to reverse may have important implications for the performance of equal-weight sector strategies. Exhibit 4 illustrates the relationship between the Tech sector’s adjusted HHI with the relative performance of the S&P 500 Equal Weight Information Technology Index compared with its cap-weighted counterpart. Although equal-weighted Tech has underperformed recently, typically, after peaks in concentration (such as during 1990, 1999 and 2002), the strategy has outperformed.
With Technology concentration at historically high levels along with broader momentum trends, it could be an interesting time to examine equal weighting within the sector as concentration and momentum have tended to mean-revert historically. Various index-weighting options are available for market participants to track specific market segments, and understanding concentration from a sector perspective may be critical to weighting these compositions appropriately.
The author would like to thank Nicholas Demers for his contributions to this post.
1 https://fraser.stlouisfed.org/files/docs/publications/FRB/pages/1990-1994/33101_1990-1994.pdf
3 In order to use the HHI to make comparisons within the Technology sector over time, we use an adjusted HHI, defined as the sector’s HHI divided by the HHI of an equal-weighted portfolio with the same number of stocks.
The posts on this blog are opinions, not advice. Please read our Disclaimers.