Get Indexology® Blog updates via email.

In This List

Beyond Borders: Highlighting Global Growth with Canadian Revenue Exposure Indices

An Index-Based Approach to Tax-Advantaged Long/Short

Leveraging Index Providers’ Brand and Content Strength for Product Marketing

When Private Goes Public: Inside the S&P Listed Private Equity Index

Exploring the Case for European Equities in the Current Market

Beyond Borders: Highlighting Global Growth with Canadian Revenue Exposure Indices

Contributor Image
Anna Mittra

Associate Director, Global Exchanges

S&P Dow Jones Indices

In a globalized economy with tariff policies under the spotlight, understanding where companies generate their revenues has become increasingly important when it comes to asset allocation. The S&P/TSX Geographic Revenue Exposure Indices offer an innovative approach to measuring and tracking Canadian companies based on their revenue sources, whether primarily domestic or international. These indices provide market participants tools to make more informed decisions about their potential geographic exposure, while maintaining exposure to a domestic basket of listed Canadian companies.

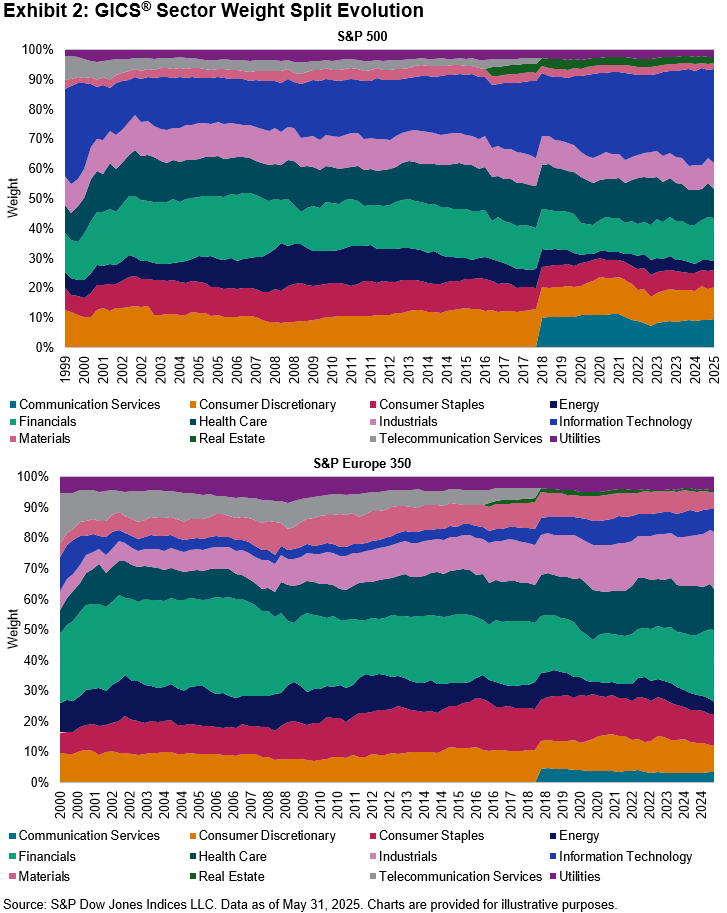
As of May 30, 2025, the S&P/TSX 60 Canada Revenue Exposure Index had a strong tilt toward Canadian-sourced revenues, with approximately 78% of its revenue derived domestically. Meanwhile, the benchmark S&P/TSX 60 offered broader global diversification, with contributions from Europe, Asia and emerging markets. These distinctions provide market participants with targeted tools for aligning their regional revenue preferences with their global or domestic investment outlook.

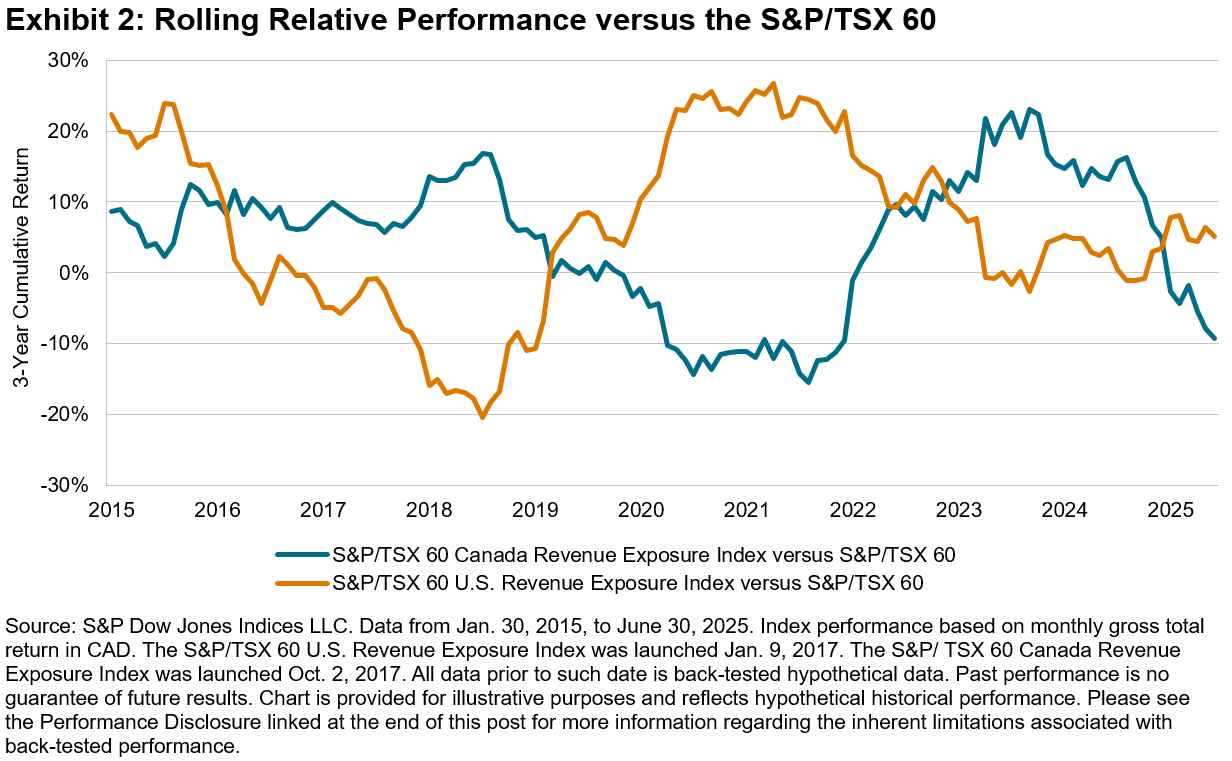
Exhibit 2 highlights the dynamic nature of geographic revenue exposure and its influence on performance relative to the S&P/TSX 60. Over the past decade, the S&P/TSX 60 U.S. Revenue Exposure Index mostly outpaced the benchmark during periods of strong U.S. equity performance—notably during the post-COVID-19 recovery, when U.S.-listed companies with global tech and healthcare exposure rebounded sharply. More recently, shifting trade dynamics and industrial policy developments have begun to alter the landscape, contributing to renewed strength in Canadian revenue exposure. These patterns illustrate how revenue origin can serve as a useful lens through which to analyze index behavior across varying market environments.

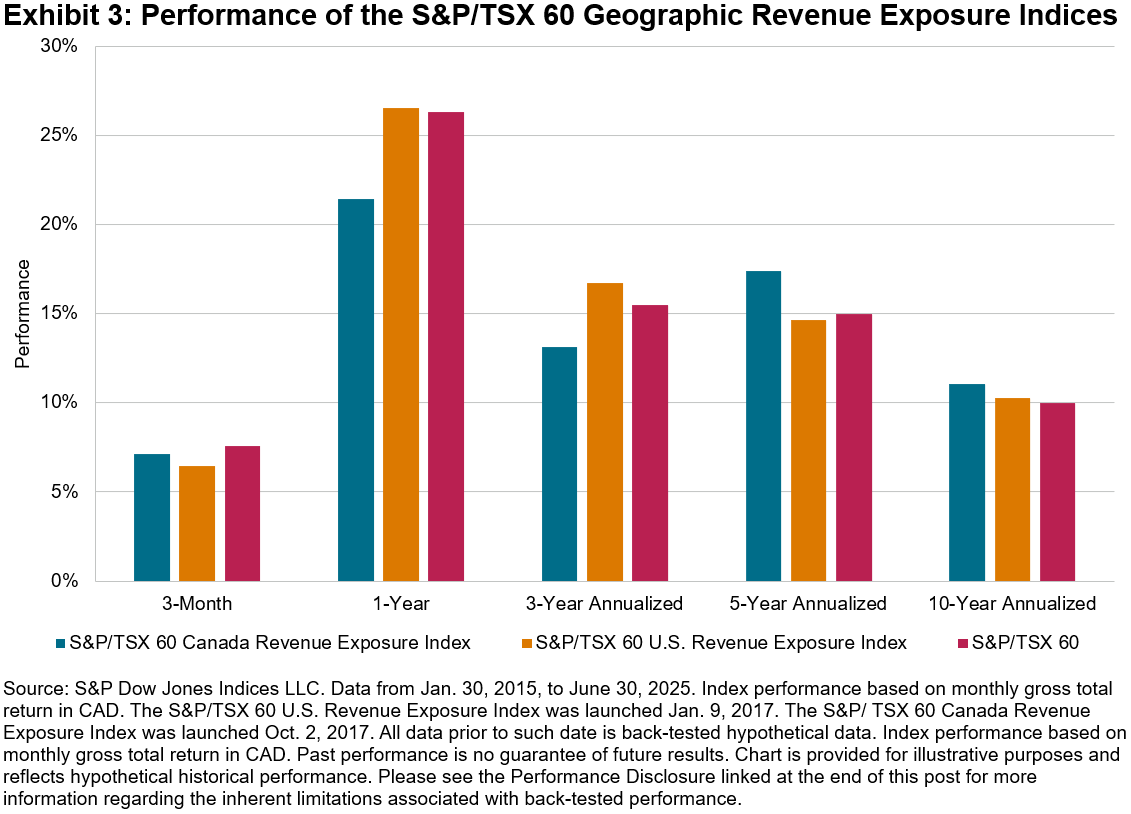
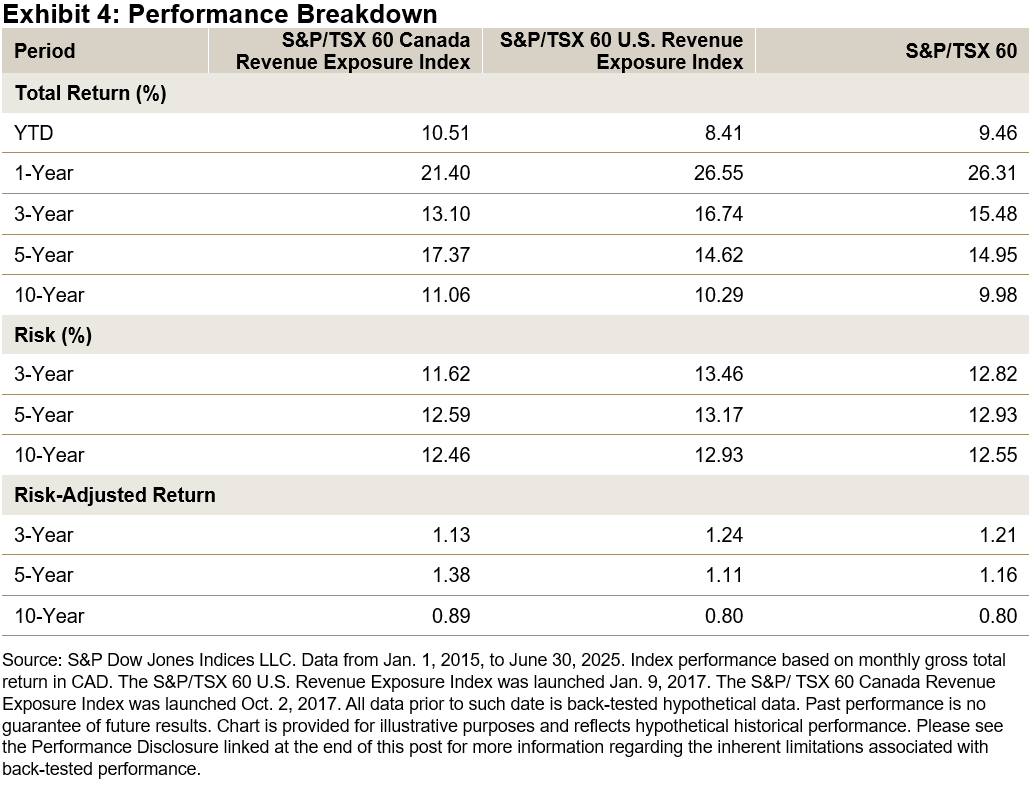
The S&P/TSX 60 U.S. Exposure Index outperformed the benchmark over the past 1- and 3-year periods, albeit with higher volatility, while the S&P/TSX 60 Canada Revenue Exposure Index outperformed over the longer 5- and 10-year periods. These patterns suggest that domestically focused companies may provide more stable long-term returns, while companies with U.S. revenue exposure tend to lead during periods of U.S. market momentum.

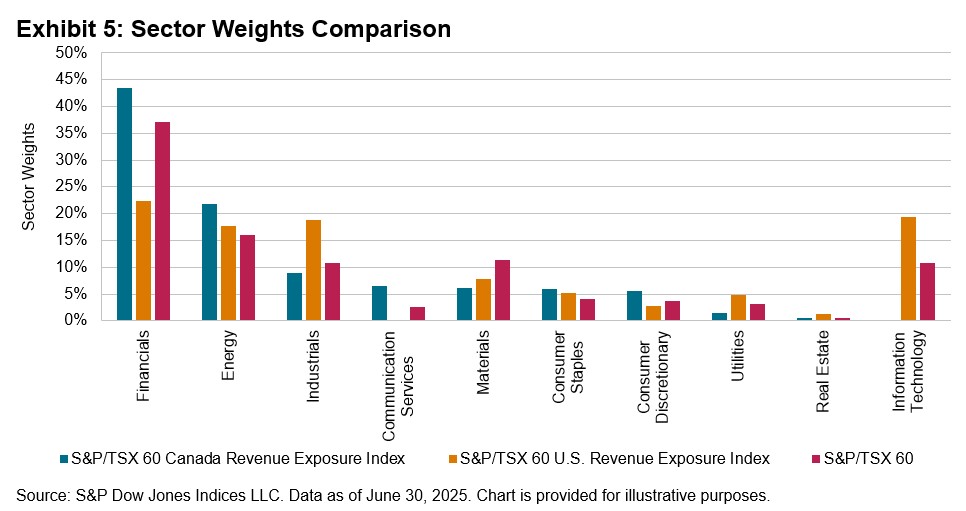
While the S&P/TSX 60 reflects Canada’s large-cap equity landscape, its revenue-based counterparts reveal distinct sector tilts tied to geographic exposure. The S&P/TSX 60 Canada Revenue Exposure Index has leaned heavily into the Financials and Energy sectors, aligning with Canada’s domestic economic strengths. In contrast, the S&P/TSX 60 U.S. Revenue Exposure Index has been weighted more toward the Information Technology and Industrials sectors, which are often linked with international business and global demand.

The S&P/TSX 60 Geographic Revenue Exposure Indices highlight how differing revenue origins shape index characteristics. Global exposure has generally aligned more closely to market momentum shifts, while domestic exposure has tended to reflect long-term economic stability.

The posts on this blog are opinions, not advice. Please read our Disclaimers.

An Index-Based Approach to Tax-Advantaged Long/Short

What’s the role of indices in long/short tax-advantaged strategies? Brooklyn Investment Group’s Erkko Etula joins S&P DJI’s Brandon Hass and Rupert Watts to explore how indices like the S&P 500 130/30 Quality Index are helping address concentration risk and demand for customization inclusive of long-term tax objectives via transparent design.

The posts on this blog are opinions, not advice. Please read our Disclaimers.

Leveraging Index Providers’ Brand and Content Strength for Product Marketing

Contributor Image
Brandon Hass

Global Head of Client Solutions Group, Direct Indexing and Model Portfolios

S&P Dow Jones Indices

Index providers have long played an important role in financial markets by developing and maintaining transparent, rules-based benchmarks, but, beyond supplying index data, they can also potentially offer brand awareness and educational resources for use in asset managers and wealth managers’ product positioning.

Amid the plethora of investment products available to investors and the within wealth manager channels, it has become harder for asset management firms to differentiate and distribute their offerings, according to Cerulli Associates’ new whitepaper.1 In an effort to address this challenge, wealth and asset managers could look to supplement their product marketing capabilities by leveraging index providers’ established brand and content strength.

Why Index Brand Matters

According to recent research from Cerulli Associates, financial advisors pay attention to the brand of the index underlying passively managed products and separately managed accounts (SMAs).

For exchange-traded funds (ETFs), over half of advisors surveyed (56%)2 by Cerulli Associates chose an index provider’s brand as one of the most important factors they consider when reviewing the fund’s underlying index (see Exhibit 1).

The survey uncovered similar results for advisors exploring direct indexing capabilities through SMAs, as 49%3 ranked index provider brand as one of their top considerations (see Exhibit 2).

While some advisors are well versed in the details of index construction, others focus more on the index’s brand recognition when selecting an underlying index for their product. One wealth management executive summarized it this way: “Our advisors and clients … just trust the name brand of the index, and they don’t really get into significant details.”4 This underscores the emphasis on an index provider’s brand during an advisor’s product selection process. This feedback also suggests that wealth and asset managers may consider collaborations with index providers to help strengthen their product marketing capabilities.

For managers that are not yet household names, licensing a brand from a known index provider may lend recognition to their products—particularly in competitive or emerging categories where advisors may primarily seek products with underlying prominent benchmarks. For well-established entities, an index provider’s brand can be additive and complement the manager’s brand in the overall positioning of the product.

The Importance of Educational Content

In addition to brand recognition and methodology, index providers may contribute educational content, which may be overlooked by managers. The educational resources published by index providers may facilitate advisor understanding of the underlying index of a product, support product and help articulate the rationale behind an index-based strategy.

Index providers’ solutions are built upon a foundation of intellectual property from which they can produce high-quality thought leadership that can be incorporated into educational content. These materials may be useful to advisors as they navigate client inquiries.5 A majority of advisors surveyed by Cerulli Associates deemed index performance data, attribution, design and macroeconomic thought leadership as valuable in supplementing their own knowledge and aiding in client conversations (see Exhibit 3).

The popularity of this content among most of the advisors surveyed speaks to the various ways it can help to inform conversations with clients, including:

  • Explaining methodology updates or rebalancing schedules
  • Demonstrating how index construction aligns with a product’s stated goals
  • Offering historical and contextual data to aid in discussions around risk and exposures

Advisors may not need to become index experts—but they do need to be confident when explaining the basics of the passive strategies they use. Index provider content may assist these efforts.

For asset and wealth managers that offer more complex investment strategies, such as derivative income or buffered ETFs, an index provider’s educational materials can be a helpful resource to explain unique concepts.

Beyond education and answering client questions, 85% of advisors surveyed by Cerulli Associates noted they used index provider content to make investment decisions.6 Therefore, asset and wealth managers may want to consider potentially overlooked ways to further leverage index provider materials.

1 The Cerulli Associates whitepaper “Redefining the Role of Index Providers” was sponsored by S&P Dow Jones Indices.

2 Please see page 11 of Cerulli Associates’ “Redefining the Role of Index Providers.”

3 Please see page 21 of Cerulli Associates’ “Redefining the Role of Index Providers.”

4 Please see page 14 of Cerulli Associates’ “Redefining the Role of Index Providers.”

5 Please see page 15 of Cerulli Associates’ “Redefining the Role of Index Providers.”

6 Please see page 20 of Cerulli Associates’ “Redefining the Role of Index Providers.”

The posts on this blog are opinions, not advice. Please read our Disclaimers.

When Private Goes Public: Inside the S&P Listed Private Equity Index

Contributor Image
Barbara Velado

Former Associate Director, Global Equity Indices

S&P Dow Jones Indices

The private equity (PE) industry has experienced a notable shift with a growing wave of high-profile public listings worldwide. This trend traces back to the mid-2000s, with Blackstone being among the first major firms to list its shares on the NYSE. This unlocked an era where industry giants such as KKR and Carlyle followed suit with their own IPOs. A decade later, European PE firms dominated headlines with their own IPOs. This blog explores the trend of public listings within the private markets space and dives into the S&P Listed Private Equity Index as a tool to track and gain insight into this expanding market segment.

Brief History of Private Equity Funds

PE funds invest in private companies through leveraged buyouts, venture and growth capital, using funds raised from limited partners, including institutional investors and high-net-worth individuals. The asset class, characterized by longer capital lock-up periods and limited liquidity, has fostered active ownership with portfolio companies to drive long-term operational enhancements, often outperforming public-market benchmarks.

Historically structured as limited partnerships, many private capital firms have transitioned into publicly listed companies to benefit from an influx of long-term capital and access to liquidity; to facilitate founders’ ownership transition; and to enhance brand recognition. This coincides with a broader surge in appetite for this alternative asset class, which has grown to USD 12 trillion in AUM globally (see Exhibit 1).

Indexing Listed Private Markets

Indexing the broader private markets space has been notoriously difficult due to the lack of directly comparable data. Unlike public companies, whose share price can be accessed real-time as a gauge of market sentiment, private assets’ returns are derived from valuations of portfolio holdings, typically assessed on an annual or quarterly basis. However, a more comparable subset emerges through listed private markets companies, which may offer a bridge between private market exposure and public market accessibility.

The S&P Listed Private Equity Index tracks leading public companies engaged in private markets activities, namely private credit, venture capital, buyouts and seed investments, given specific market-capitalization and liquidity thresholds and exchange listing requirements. The index membership has grown from 30 constituents in 2009 to 85 as of 2025, reflecting the rising number of private capital firms undergoing IPOs (see Exhibit 2).

The S&P Listed Private Equity Index has outperformed both the S&P 500 and the S&P World Ex-U.S. Index over the past five years, albeit with increased volatility; potentially driven by favorable market perception, fueling rising demand for access to the asset class (see Exhibit 3). Diversification characteristics and access to high-growth companies that are staying private for longer represent some of the key drivers explaining the growing interest in private markets.

On a constituent level, it may not come as a surprise that the main listed PE firms by AUM represent some of the largest index weights, with Blackstone, KKR and Brookfield standing out within the top five constituents by index weight (see Exhibit 4).

As demand for alternative assets continues to grow, listed private equity may offer a bridge to indirect participation in private markets. The S&P Listed Private Equity Index may serve as a tool to track this dynamic segment, while offering a framework to assess the long-term potential of private markets with the liquidity of public equities.

The posts on this blog are opinions, not advice. Please read our Disclaimers.

Exploring the Case for European Equities in the Current Market

Contributor Image
Carlos Mendizabal

Senior Analyst, Global and Thematic Equity Indices Product Management

S&P Dow Jones Indices

Rethinking Diversification in a Volatile Market

Recent market volatility has highlighted the risks of relying solely on technology-driven U.S. large-cap stocks for long-term returns. With shifts in global economic cycles and increasing geopolitical tensions, diversification has become even more relevant. Focusing only on U.S. equities may mean missing valuable opportunities abroad, particularly in Europe. The S&P Europe 350® measures leading companies across diverse sectors in 16 developed European markets, which could complement a U.S.-focused approach.

European Equities Outperformance YTD

In the first half of 2025, European equities showed significant resilience. As shown in Exhibit 1, the S&P Europe 350 gained 21%, while the S&P 500® remained nearly flat, increasing only 1%. The S&P Euro 75, which targets the eurozone, performed even better, with gains approaching 29%. This outperformance was mostly driven by Europe’s controlled inflation, accommodative monetary policy and increased public investment in infrastructure and defense. Moreover, favorable valuations and strong corporate earnings have further enhanced investor confidence and global capital flows into the region.

Diversification Impact

One possible advantage of European equities is its sector exposure compared to U.S. markets. As of May 31, 2025, the S&P Europe 350 had greater weights in Financials, Industrials and Healthcare, while The 500™ was predominantly weighted toward Information Technology (see Exhibit 2). This difference could help mitigate sector risks and lead to a more diversified industry representation. Furthermore, the S&P Europe 350 is less concentrated in its largest constituents, with its top five companies accounting for just over 12% of the index, in contrast to nearly 25% in The 500, making the index performance more broad based.

Periods of Outperformance and Current Drivers

European equities have outperformed their U.S. counterparts over different periods in recent decades, driven by valuation disparities, sector and style rotation and divergent macroeconomic policies. Today, Europe is undergoing a structural transformation, with substantial investments in infrastructure, energy transition and defense—underpinned by revised fiscal frameworks and enhanced EU-level funding mechanisms. These developments could foster new avenues for growth and reignite investor interest. As of May 31, 2025, the S&P Europe 350 traded at a forward price-to-earnings ratio of 15.13, below its 15-year average. In contrast, the S&P 500 commanded a significantly higher multiple of 22.09—a premium of approximately 50% relative to its European counterpart, positioning this premium midway between its mean of 28% and peak of 70% over the past 15 years (see Exhibit 3).

European Equities: Passive Strategies Lead

Our SPIVA Europe Year-End 2024 Scorecard shows that the majority of active funds underperformed their benchmarks over short- and long-term periods. On average, EUR-denominated Europe Equity active funds trailed the S&P Europe 350 by 5.11%. Furthermore, our Europe Persistence Scorecard has observed that maintaining consistent outperformance can be challenging for active managers over extended timeframes (see Exhibit 4).

Conclusion

When considering diversification beyond U.S. markets, European equities stand out due to attractive valuations, distinct sector composition and compelling structural trends. These factors suggest that Europe may be well positioned for long-term growth. In this context, European equity indices like the S&P Europe 350 could prove to be effective tools for navigating this evolving market landscape.

The posts on this blog are opinions, not advice. Please read our Disclaimers.