Get Indexology® Blog updates via email.

In This List

When Private Goes Public: Inside the S&P Listed Private Equity Index

Exploring the Case for European Equities in the Current Market

Measure Twice, Cut Once

Surveying U.S. Markets: Sectors, Geopolitics and Index-Based Strategies

Seeking Quality within Quality

When Private Goes Public: Inside the S&P Listed Private Equity Index

Contributor Image
Barbara Velado

Former Associate Director, Global Equity Indices

S&P Dow Jones Indices

The private equity (PE) industry has experienced a notable shift with a growing wave of high-profile public listings worldwide. This trend traces back to the mid-2000s, with Blackstone being among the first major firms to list its shares on the NYSE. This unlocked an era where industry giants such as KKR and Carlyle followed suit with their own IPOs. A decade later, European PE firms dominated headlines with their own IPOs. This blog explores the trend of public listings within the private markets space and dives into the S&P Listed Private Equity Index as a tool to track and gain insight into this expanding market segment.

Brief History of Private Equity Funds

PE funds invest in private companies through leveraged buyouts, venture and growth capital, using funds raised from limited partners, including institutional investors and high-net-worth individuals. The asset class, characterized by longer capital lock-up periods and limited liquidity, has fostered active ownership with portfolio companies to drive long-term operational enhancements, often outperforming public-market benchmarks.

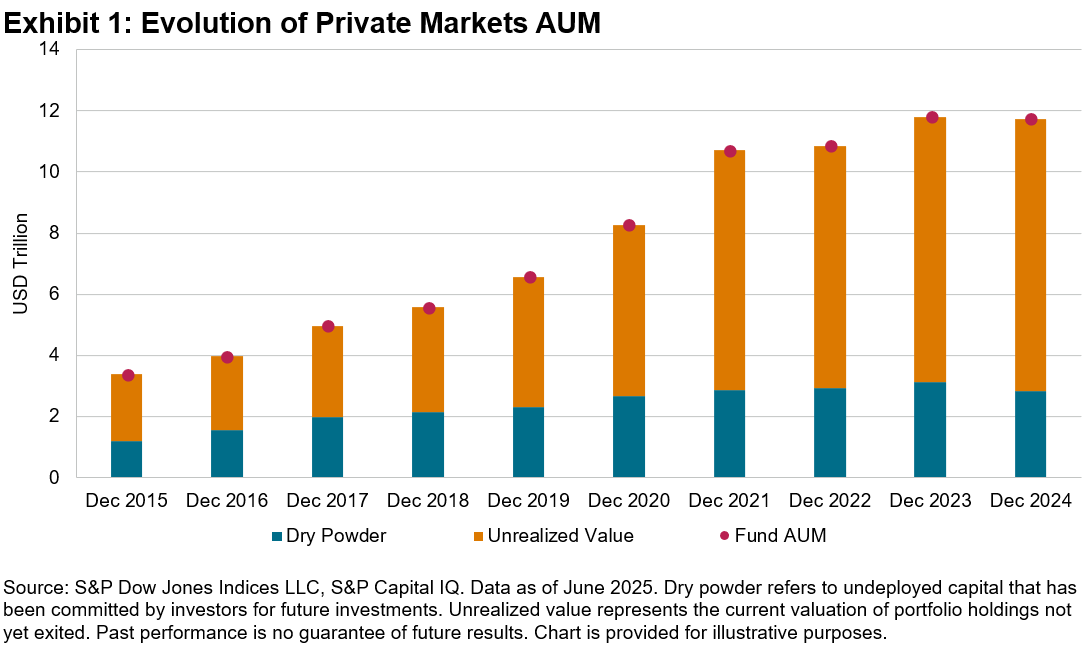
Historically structured as limited partnerships, many private capital firms have transitioned into publicly listed companies to benefit from an influx of long-term capital and access to liquidity; to facilitate founders’ ownership transition; and to enhance brand recognition. This coincides with a broader surge in appetite for this alternative asset class, which has grown to USD 12 trillion in AUM globally (see Exhibit 1).

Indexing Listed Private Markets

Indexing the broader private markets space has been notoriously difficult due to the lack of directly comparable data. Unlike public companies, whose share price can be accessed real-time as a gauge of market sentiment, private assets’ returns are derived from valuations of portfolio holdings, typically assessed on an annual or quarterly basis. However, a more comparable subset emerges through listed private markets companies, which may offer a bridge between private market exposure and public market accessibility.

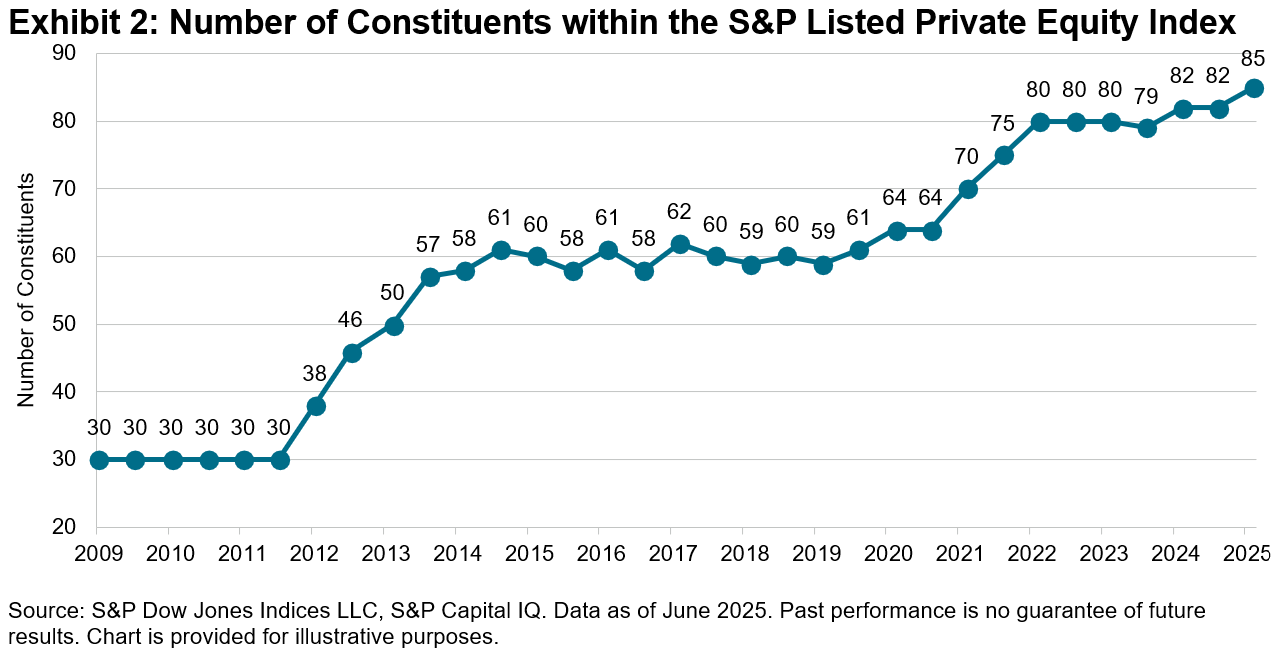
The S&P Listed Private Equity Index tracks leading public companies engaged in private markets activities, namely private credit, venture capital, buyouts and seed investments, given specific market-capitalization and liquidity thresholds and exchange listing requirements. The index membership has grown from 30 constituents in 2009 to 85 as of 2025, reflecting the rising number of private capital firms undergoing IPOs (see Exhibit 2).

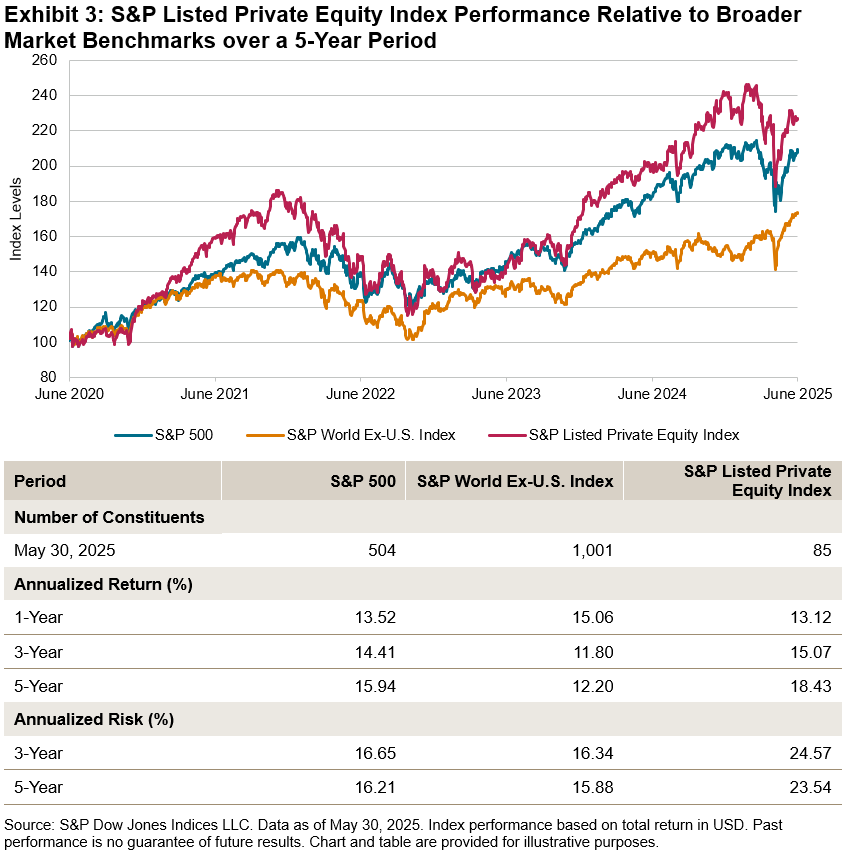
The S&P Listed Private Equity Index has outperformed both the S&P 500 and the S&P World Ex-U.S. Index over the past five years, albeit with increased volatility; potentially driven by favorable market perception, fueling rising demand for access to the asset class (see Exhibit 3). Diversification characteristics and access to high-growth companies that are staying private for longer represent some of the key drivers explaining the growing interest in private markets.

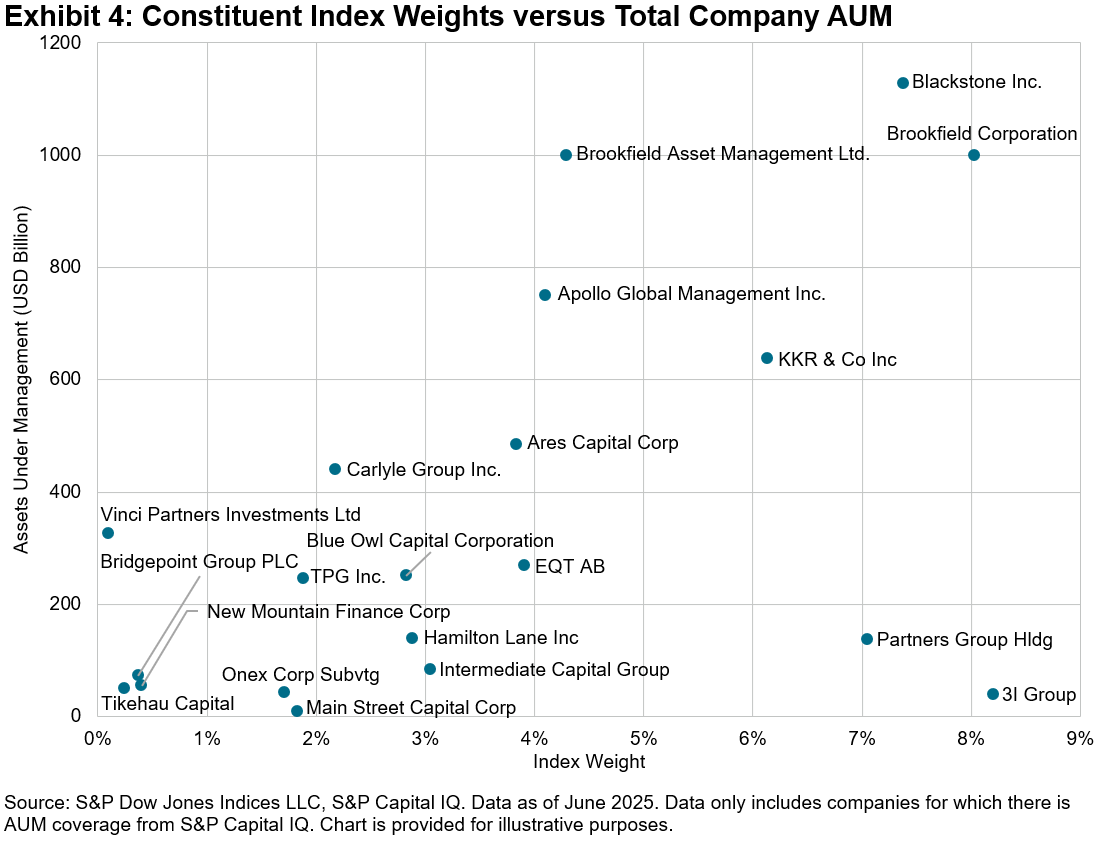
On a constituent level, it may not come as a surprise that the main listed PE firms by AUM represent some of the largest index weights, with Blackstone, KKR and Brookfield standing out within the top five constituents by index weight (see Exhibit 4).

As demand for alternative assets continues to grow, listed private equity may offer a bridge to indirect participation in private markets. The S&P Listed Private Equity Index may serve as a tool to track this dynamic segment, while offering a framework to assess the long-term potential of private markets with the liquidity of public equities.

The posts on this blog are opinions, not advice. Please read our Disclaimers.

Exploring the Case for European Equities in the Current Market

Contributor Image
Carlos Mendizabal

Senior Analyst, Global and Thematic Equity Indices Product Management

S&P Dow Jones Indices

Rethinking Diversification in a Volatile Market

Recent market volatility has highlighted the risks of relying solely on technology-driven U.S. large-cap stocks for long-term returns. With shifts in global economic cycles and increasing geopolitical tensions, diversification has become even more relevant. Focusing only on U.S. equities may mean missing valuable opportunities abroad, particularly in Europe. The S&P Europe 350® measures leading companies across diverse sectors in 16 developed European markets, which could complement a U.S.-focused approach.

European Equities Outperformance YTD

In the first half of 2025, European equities showed significant resilience. As shown in Exhibit 1, the S&P Europe 350 gained 21%, while the S&P 500® remained nearly flat, increasing only 1%. The S&P Euro 75, which targets the eurozone, performed even better, with gains approaching 29%. This outperformance was mostly driven by Europe’s controlled inflation, accommodative monetary policy and increased public investment in infrastructure and defense. Moreover, favorable valuations and strong corporate earnings have further enhanced investor confidence and global capital flows into the region.

Diversification Impact

One possible advantage of European equities is its sector exposure compared to U.S. markets. As of May 31, 2025, the S&P Europe 350 had greater weights in Financials, Industrials and Healthcare, while The 500™ was predominantly weighted toward Information Technology (see Exhibit 2). This difference could help mitigate sector risks and lead to a more diversified industry representation. Furthermore, the S&P Europe 350 is less concentrated in its largest constituents, with its top five companies accounting for just over 12% of the index, in contrast to nearly 25% in The 500, making the index performance more broad based.

Periods of Outperformance and Current Drivers

European equities have outperformed their U.S. counterparts over different periods in recent decades, driven by valuation disparities, sector and style rotation and divergent macroeconomic policies. Today, Europe is undergoing a structural transformation, with substantial investments in infrastructure, energy transition and defense—underpinned by revised fiscal frameworks and enhanced EU-level funding mechanisms. These developments could foster new avenues for growth and reignite investor interest. As of May 31, 2025, the S&P Europe 350 traded at a forward price-to-earnings ratio of 15.13, below its 15-year average. In contrast, the S&P 500 commanded a significantly higher multiple of 22.09—a premium of approximately 50% relative to its European counterpart, positioning this premium midway between its mean of 28% and peak of 70% over the past 15 years (see Exhibit 3).

European Equities: Passive Strategies Lead

Our SPIVA Europe Year-End 2024 Scorecard shows that the majority of active funds underperformed their benchmarks over short- and long-term periods. On average, EUR-denominated Europe Equity active funds trailed the S&P Europe 350 by 5.11%. Furthermore, our Europe Persistence Scorecard has observed that maintaining consistent outperformance can be challenging for active managers over extended timeframes (see Exhibit 4).

Conclusion

When considering diversification beyond U.S. markets, European equities stand out due to attractive valuations, distinct sector composition and compelling structural trends. These factors suggest that Europe may be well positioned for long-term growth. In this context, European equity indices like the S&P Europe 350 could prove to be effective tools for navigating this evolving market landscape.

The posts on this blog are opinions, not advice. Please read our Disclaimers.

Measure Twice, Cut Once

Contributor Image
Dasha Selivanova

Former Quantitative ESG Analyst, Index Investment Strategy

S&P Dow Jones Indices

U.S. large-cap growth has been outperforming this quarter, thanks in part to unusually strong contributions from a few single-stock winners. With higher dispersion among performance, market participants might conclude that it’s a good time to pick stocks or appoint a fund manager to do it for them. However, while the rewards for picking winners may be greater, it may not be any easier than usual to sort the wheat from the chaff.

Exhibit 1 shows the daily and cumulative relative QTD performance of the S&P 500® Growth as compared to the S&P 500. Much of the outperformance was concentrated in April and mid-May, but it has steadily outperformed over the period, for a cumulative 6.3% excess return.

While sectors traditionally associated with growth—such as Information Technology—also performed well during the period, Exhibit 2 shows that single-stock selections, rather than sectoral effects, made the greater contribution to growth’s outperformance. Overall, single-stock effects accounted for 3.8%, while sector effects totaled the remaining 2.5%.

On a related note, overall performance dispersion in growth names has been higher than usual. Exhibit 3 shows the average daily dispersion in the S&P 500 Growth YTD, as compared to the daily index dispersion since 1999. So far in 2025, annualized daily dispersion averaged 33%, far above the median and higher than 83% of historical days.

What does higher-than-average dispersion mean for stock pickers? A common assumption is that higher-dispersion environments favor active management, offering a higher degree of potential upside through astute stock selection. Examining the SPIVA® U.S. Year-End Scorecard results from 2003 to 2024 for the Large-Cap Growth fund category, we find that the range of manager outcomes has often risen and fallen in tandem with the prevalent levels of stock dispersion in the S&P 500 Growth. Specifically, Exhibit 4 compares the annual interquartile range among actively managed Large-Cap Growth funds to the average daily dispersion levels for the S&P 500 Growth by calendar year. During years characterized by unusually high dispersion, active funds often exhibited greater variability among their performances.

However, did this equate to higher rates of success among active funds? Opportunities may have been more common, but so was the risk associated with making the wrong selections. Again, SPIVA Scorecards bring this question into focus; wider dispersion did not increase the active manager outperformance rate. In fact, in the U.S. Large-Cap Growth active fund category, the average fund underperformance rate was 63% in the years of above-median dispersion and 55% in the years of below-median dispersion.

As the adage goes, “measuring twice” may prevent a costly mistake. Higher dispersion in growth may continue, along with some positive performance. Participating in winners could mean big rewards, but a hasty decision might be unwise, as shown by the historical SPIVA Scorecard results, 20 years of which are available here to assist market participants with their final cuts.

The posts on this blog are opinions, not advice. Please read our Disclaimers.

Surveying U.S. Markets: Sectors, Geopolitics and Index-Based Strategies

How do global investors use the S&P 500 to better understand the performance and potential opportunity set in U.S. equity markets? S&P DJI’s Tim Edwards joins GCMA’s Michael Grifferty for a closer look at the role of the S&P 500 ecosystem in the global economy and how market participants are using the index icon to make more informed decisions.

The posts on this blog are opinions, not advice. Please read our Disclaimers.

Seeking Quality within Quality

Contributor Image
Anu Ganti

Head of U.S. Index Investment Strategy

S&P Dow Jones Indices

Despite emerging geopolitical tensions, U.S. equities have staged a dramatic comeback over the past quarter, with the S&P 500® up 9% QTD through June 25, 2025, fueled by robust corporate earnings from Big Tech. Meanwhile, with the impending Russell reconstitution,1 the market’s mind has shifted toward smaller caps, which have had a more challenging time, with the S&P SmallCap 600® down 6% YTD, underperforming The 500™ by 10%. Headwinds including ongoing tariff-related uncertainty, higher Treasury yields and a weaker dollar have weighed on smaller-cap companies, which tend to be more domestically sensitive.

With the Russell reconstitution approaching, it could be an opportune time to examine the historical performance of smaller companies, which generally face different challenges than their large-cap peers. Numerous studies, most prominently by Fama and French,2 have documented the small-cap premium, or the long-term outperformance of small stocks. But not all small-cap indices are created equal. The S&P SmallCap 600 has outperformed versus the broader U.S. small-cap universe, with a cumulative excess return of over 90% versus the S&P United States SmallCap Index since December 1994 (see Exhibit 1).

A key catalyst for this outperformance has been the S&P 600’s quality bias. The index is a part of the broader S&P Composite 1500®, which requires companies to have a history of positive earnings at the point of first inclusion (among other criteria) in order to be eligible. This earnings screen helps to filter out persistently unprofitable companies. Quality has been a particularly relevant factor so far this year; although The 500 and the S&P 600 have had widely differing fortunes, one trait that they have shared is the outperformance of quality stocks. Exhibit 2 illustrates that while their relative performance has narrowed, the S&P 500 Quality Index and the S&P SmallCap 600 Quality Index have both outperformed their respective benchmarks YTD.

In addition to the outperformance of quality stocks within the S&P 600, which as noted already has a tilt toward this factor, the potential rewards for selecting quality small-cap stocks have increased. Exhibit 3 shows a nearly 5% YTD performance spread between the S&P SmallCap 600 Quality Index and the S&P SmallCap 600 Quality – Lowest Quintile Index.

Looking ahead, while smaller-cap companies might face numerous obstacles, the importance of the quality factor within small caps is clear. The long-term outperformance of the S&P SmallCap 600 coupled with the outperformance of higher quality stocks within the index may be a potential silver lining for market participants looking across the capitalization spectrum to consider.

1 Ziafati, Noushin. “Here’s what you need to know about FTSE Russell’s reconstitution.” Investment Executive. May 30, 2025.

2 Fama, Eugene F., Kenneth R. French. “The Cross-Section of Expected Stock Returns.” The Journal of Finance. Volume 47, Issue 2. June 1992. Pp 427-465.


The posts on this blog are opinions, not advice. Please read our Disclaimers.