Get Indexology® Blog updates via email.

In This List

Measure Twice, Cut Once

Surveying U.S. Markets: Sectors, Geopolitics and Index-Based Strategies

Seeking Quality within Quality

Beyond the Bullion: Market Trends in Global Gold Production

Quarterly Changes May Not Be Constant

Measure Twice, Cut Once

Contributor Image
Dasha Selivanova

Former Quantitative ESG Analyst, Index Investment Strategy

S&P Dow Jones Indices

U.S. large-cap growth has been outperforming this quarter, thanks in part to unusually strong contributions from a few single-stock winners. With higher dispersion among performance, market participants might conclude that it’s a good time to pick stocks or appoint a fund manager to do it for them. However, while the rewards for picking winners may be greater, it may not be any easier than usual to sort the wheat from the chaff.

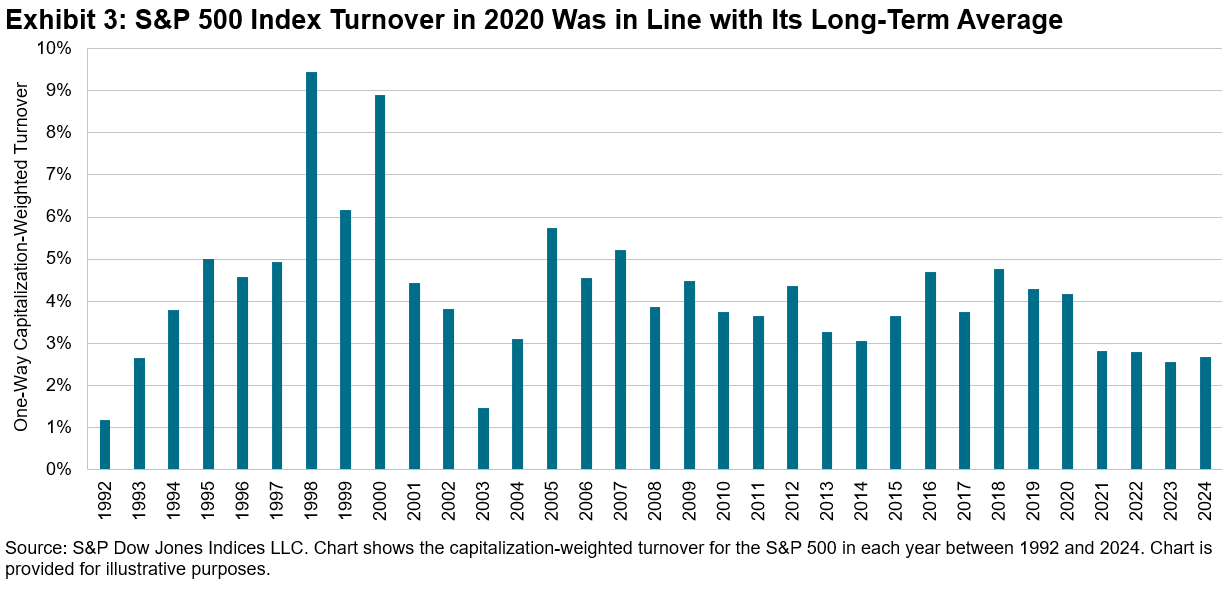
Exhibit 1 shows the daily and cumulative relative QTD performance of the S&P 500® Growth as compared to the S&P 500. Much of the outperformance was concentrated in April and mid-May, but it has steadily outperformed over the period, for a cumulative 6.3% excess return.

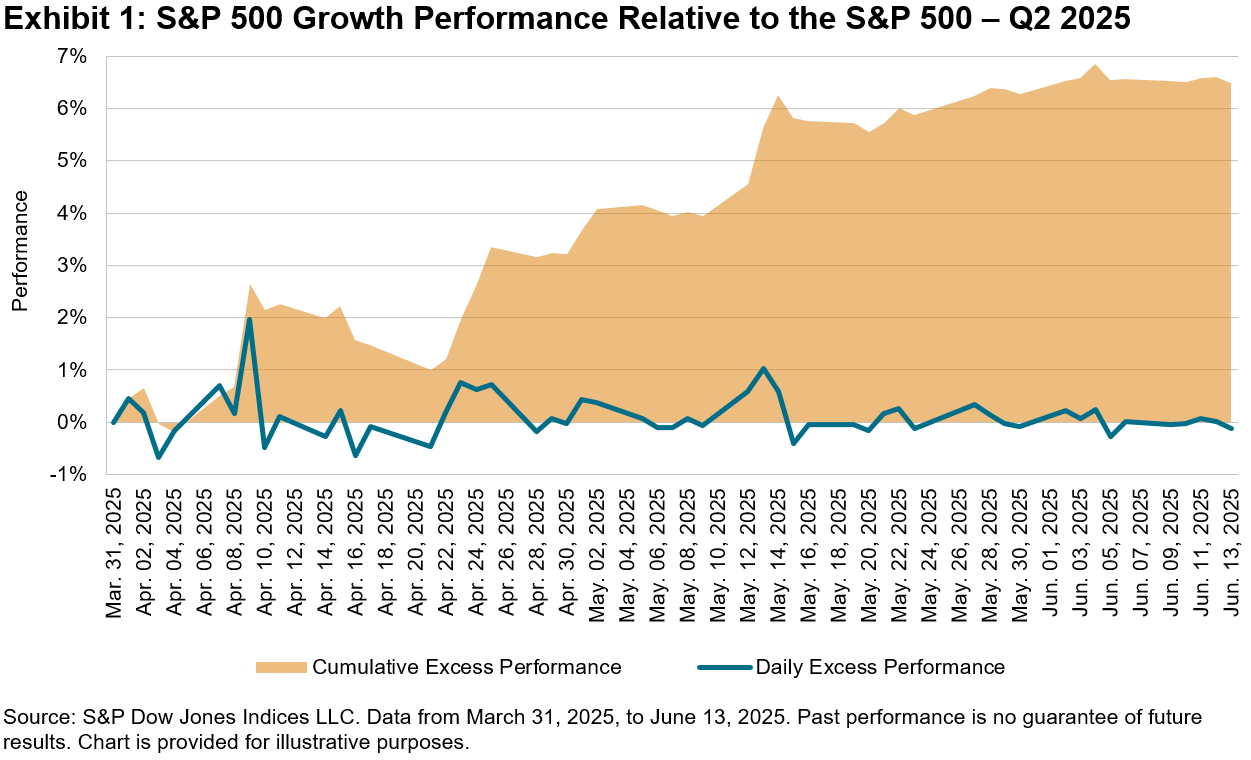
While sectors traditionally associated with growth—such as Information Technology—also performed well during the period, Exhibit 2 shows that single-stock selections, rather than sectoral effects, made the greater contribution to growth’s outperformance. Overall, single-stock effects accounted for 3.8%, while sector effects totaled the remaining 2.5%.

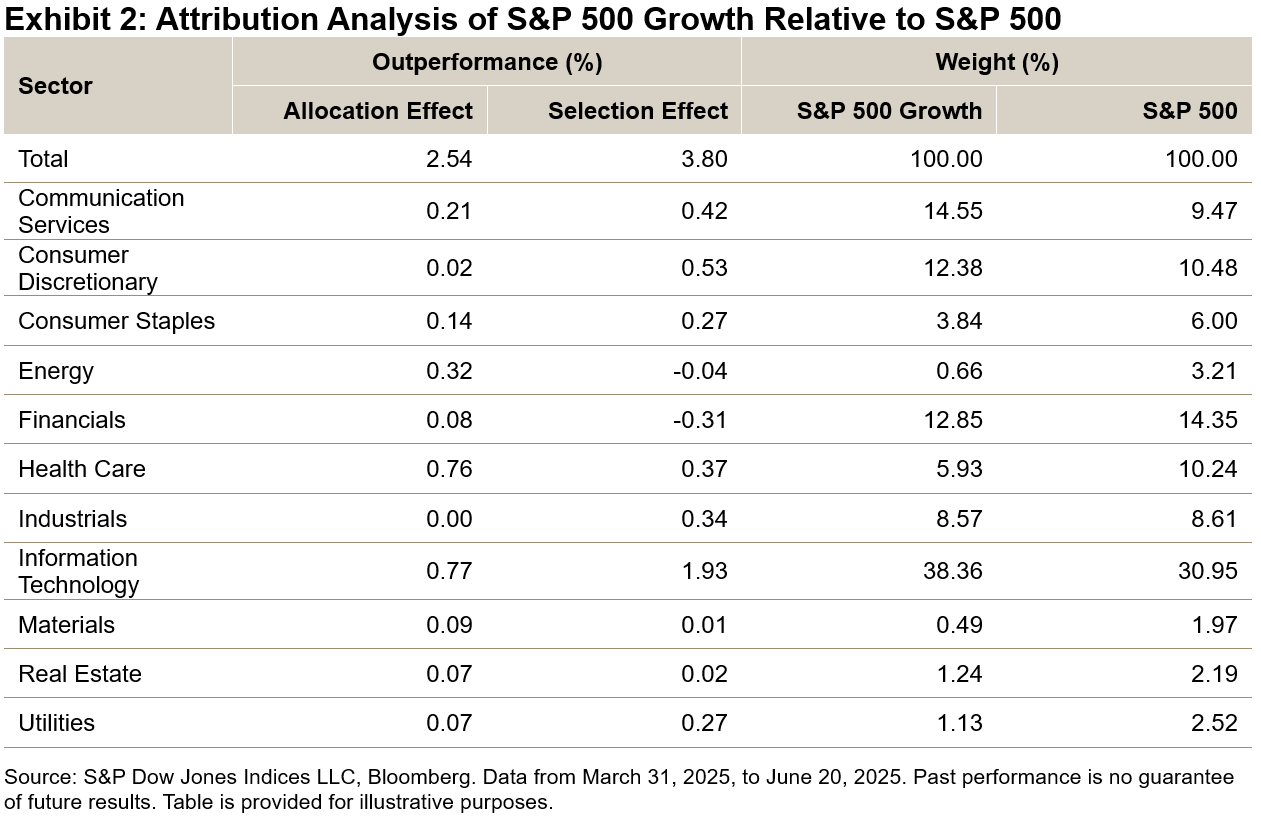
On a related note, overall performance dispersion in growth names has been higher than usual. Exhibit 3 shows the average daily dispersion in the S&P 500 Growth YTD, as compared to the daily index dispersion since 1999. So far in 2025, annualized daily dispersion averaged 33%, far above the median and higher than 83% of historical days.

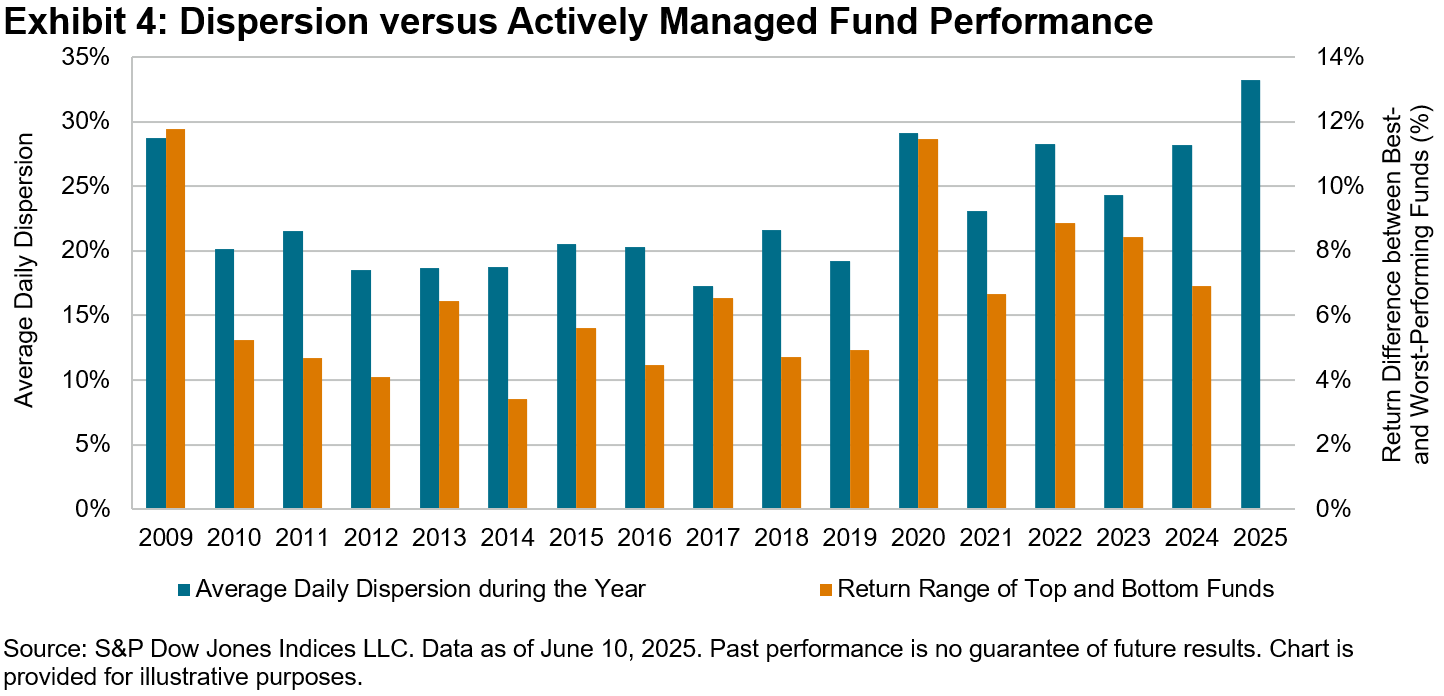
What does higher-than-average dispersion mean for stock pickers? A common assumption is that higher-dispersion environments favor active management, offering a higher degree of potential upside through astute stock selection. Examining the SPIVA® U.S. Year-End Scorecard results from 2003 to 2024 for the Large-Cap Growth fund category, we find that the range of manager outcomes has often risen and fallen in tandem with the prevalent levels of stock dispersion in the S&P 500 Growth. Specifically, Exhibit 4 compares the annual interquartile range among actively managed Large-Cap Growth funds to the average daily dispersion levels for the S&P 500 Growth by calendar year. During years characterized by unusually high dispersion, active funds often exhibited greater variability among their performances.

However, did this equate to higher rates of success among active funds? Opportunities may have been more common, but so was the risk associated with making the wrong selections. Again, SPIVA Scorecards bring this question into focus; wider dispersion did not increase the active manager outperformance rate. In fact, in the U.S. Large-Cap Growth active fund category, the average fund underperformance rate was 63% in the years of above-median dispersion and 55% in the years of below-median dispersion.

As the adage goes, “measuring twice” may prevent a costly mistake. Higher dispersion in growth may continue, along with some positive performance. Participating in winners could mean big rewards, but a hasty decision might be unwise, as shown by the historical SPIVA Scorecard results, 20 years of which are available here to assist market participants with their final cuts.

The posts on this blog are opinions, not advice. Please read our Disclaimers.

Surveying U.S. Markets: Sectors, Geopolitics and Index-Based Strategies

How do global investors use the S&P 500 to better understand the performance and potential opportunity set in U.S. equity markets? S&P DJI’s Tim Edwards joins GCMA’s Michael Grifferty for a closer look at the role of the S&P 500 ecosystem in the global economy and how market participants are using the index icon to make more informed decisions.

The posts on this blog are opinions, not advice. Please read our Disclaimers.

Seeking Quality within Quality

Contributor Image
Anu Ganti

Head of U.S. Index Investment Strategy

S&P Dow Jones Indices

Despite emerging geopolitical tensions, U.S. equities have staged a dramatic comeback over the past quarter, with the S&P 500® up 9% QTD through June 25, 2025, fueled by robust corporate earnings from Big Tech. Meanwhile, with the impending Russell reconstitution,1 the market’s mind has shifted toward smaller caps, which have had a more challenging time, with the S&P SmallCap 600® down 6% YTD, underperforming The 500™ by 10%. Headwinds including ongoing tariff-related uncertainty, higher Treasury yields and a weaker dollar have weighed on smaller-cap companies, which tend to be more domestically sensitive.

With the Russell reconstitution approaching, it could be an opportune time to examine the historical performance of smaller companies, which generally face different challenges than their large-cap peers. Numerous studies, most prominently by Fama and French,2 have documented the small-cap premium, or the long-term outperformance of small stocks. But not all small-cap indices are created equal. The S&P SmallCap 600 has outperformed versus the broader U.S. small-cap universe, with a cumulative excess return of over 90% versus the S&P United States SmallCap Index since December 1994 (see Exhibit 1).

A key catalyst for this outperformance has been the S&P 600’s quality bias. The index is a part of the broader S&P Composite 1500®, which requires companies to have a history of positive earnings at the point of first inclusion (among other criteria) in order to be eligible. This earnings screen helps to filter out persistently unprofitable companies. Quality has been a particularly relevant factor so far this year; although The 500 and the S&P 600 have had widely differing fortunes, one trait that they have shared is the outperformance of quality stocks. Exhibit 2 illustrates that while their relative performance has narrowed, the S&P 500 Quality Index and the S&P SmallCap 600 Quality Index have both outperformed their respective benchmarks YTD.

In addition to the outperformance of quality stocks within the S&P 600, which as noted already has a tilt toward this factor, the potential rewards for selecting quality small-cap stocks have increased. Exhibit 3 shows a nearly 5% YTD performance spread between the S&P SmallCap 600 Quality Index and the S&P SmallCap 600 Quality – Lowest Quintile Index.

Looking ahead, while smaller-cap companies might face numerous obstacles, the importance of the quality factor within small caps is clear. The long-term outperformance of the S&P SmallCap 600 coupled with the outperformance of higher quality stocks within the index may be a potential silver lining for market participants looking across the capitalization spectrum to consider.

1 Ziafati, Noushin. “Here’s what you need to know about FTSE Russell’s reconstitution.” Investment Executive. May 30, 2025.

2 Fama, Eugene F., Kenneth R. French. “The Cross-Section of Expected Stock Returns.” The Journal of Finance. Volume 47, Issue 2. June 1992. Pp 427-465.


The posts on this blog are opinions, not advice. Please read our Disclaimers.

Beyond the Bullion: Market Trends in Global Gold Production

Contributor Image
Darius Nass

Associate Director, Global Equity Indices

S&P Dow Jones Indices

Gold Producers in a Shifting Macro Landscape

Gold’s break above USD 3,000 per ounce in Q1 2025—a roughly 40% increase since year-end 2023—is a reflection of the revived interest in mining companies amid economic uncertainty and geopolitical risks.1 The S&P Commodity Producers Gold Index has responded with a 64% total return over the past 12 months,2 outpacing the spot price of gold (44%) and silver (23%) bullion and confirming mining companies’ relatively higher sensitivity to metal prices. However, the lift has been uneven with high beta mid caps seeing the highest returns, while large caps delivered only modest gains.

Composition and Methodology Overview for the S&P Commodity Producers Gold Index

The S&P Commodity Producers Gold Index serves as a snapshot of the listed gold universe, and as of June 18, 2025, drew 59 of the largest, most liquid producers and royalty firms from the S&P Global BMI. To be included, constituents must trade on developed market exchanges, have a float-adjusted market capitalization of at least USD 500 million (USD 250 million for current constituents) and a minimum three-month ADVT of USD 1 million (USD 500,000 for current constituents). The index is float-market-cap weighted with a single company cap of 10% and rebalanced every June and December.

Gold Producers Delivered Two Times Bullion’s Return at Twice the Volatility

After a challenging 2021-2022 period, gold equities rebounded significantly. The S&P Commodity Producers Gold Index was up 53% YTD,3 nearly doubling gold’s rise of 28%. Similarly, volatility has remained roughly double. A 10-15% pullback in early April—sparked by new U.S. tariffs, higher real yields, profit-taking and jurisdictional uncertainties—demonstrated gold producer equities’ tendency to overshoot before recovering.

Small Caps Drove Return Dispersion as Large Caps Lagged

A closer look reveals significant return dispersion across index constituents. Over the past 12 months,4 the top-performing quintile of stocks (typically smaller operators) has more than doubled, while the bottom quintile, dominated by mega caps and royalty names, achieved only modest gains. Additionally, currency fluctuations and macro policy further contributed to the divergence. Producers with operational costs in ZAR or AUD enjoyed an added margin tailwind. Conversely, large, diversified miners could not match the positive momentum of mid-cap companies.5

Conclusion

Gold equities remain a leveraged, but often volatile, proxy for bullion, historically gaining roughly twice as much during upswings while suffering outsized losses during downturns. The sector has seen low-cost mining companies rewarded for leveraging FX advantages and disciplined capital allocation, with little regard for size. With free cash flow surging, dividends and buybacks have increased, and consolidation among mega caps is expected to continue. The S&P Commodity Producers Gold Index remains a key measurement of the gold equity story and highlights which trends are truly beyond the bullion in driving performance.


1 https://econofact.org/why-has-the-price-of-gold-risen-so-sharply

2 As of June 18, 2025

3 As of June 18, 2025

4 Ending June 18, 2025

5 https://www.globalxetfs.com.au/insights/post/gold-investors-its-time-to-let-go-of-gold-miners/

6 https://www.spglobal.com/market-intelligence/en/news-insights/research/mining-mna-in-2024-gold-dominates-mna-space-for-2nd-consecutive-year

7 https://www.blackrock.com/uk/literature/annual-report/blackrock-world-mining-trust-plc-annual-report.pdf

The posts on this blog are opinions, not advice. Please read our Disclaimers.

Quarterly Changes May Not Be Constant

Contributor Image
Hamish Preston

Head of U.S. Equities

S&P Dow Jones Indices

The S&P 500®, commonly referred to as The 500™, underwent its latest quarterly update—commonly known as rebalances—at the end of last week. S&P 500 rebalances take place after the close of the third Friday of the quarter-ending month and can involve constituent changes (additions and deletions) as well as updates to company characteristics, such as changes to the number of shares outstanding to reflect the latest publicly available data.

Recently, many market participants were surprised to see, or rather not to see, any S&P 500 constituent changes coinciding with the June 2025 rebalance. A cursory glance at recent history suggests there is some justification for these reactions: each quarterly update between June 2022 and March 2025 coincided with announced additions and deletions for the S&P 500.

However, there is more than just historical precedent for a quarterly update without S&P 500 index additions and deletions—it has been a very common outcome! Around 90% of the nearly 800 S&P 500 constituent changes since 1995 did not take place on the third Friday of the quarter-ending month. Exhibit 1 shows that there were many years with zero constituent changes on these dates, demonstrating that S&P 500 rebalance turnover was typically driven by updates to company characteristics.

The timing of historical constituent changes reflects several important points. First, S&P 500 additions and deletions occur on an ongoing, as needed basis rather than on set reconstitution or rebalance dates. Second, around 70% of deletions since 1995 were caused by corporate events—such as mergers and acquisitions—that affected the index constituents’ eligibility. The index committee responsible for maintaining the S&P 500 has no control over the timing of these events, but any resulting index deletion necessitates a corresponding addition to maintain the index’s 500 company count.

Exhibit 2 further illustrates these points by comparing: a) the number of mergers and acquisitions (M&A) by S&P 500 companies (blue bars), and b) the proportion of S&P 500 constituent changes that took place between quarterly updates (orange line) since 2012. Given that M&A activity drove many constituent changes, it is perhaps unsurprising that years with higher (lower) M&A activity typically saw a greater (lower) proportion of changes take place between standard quarterly updates.

Additionally, it is important to recognize that index additions are not guaranteed when companies meet the eligibility criteria outlined in the S&P U.S. methodology document: the index committee is also mindful of sector balance and index turnover. Hence, existing constituents that may appear to violate one or more of the addition criteria are not automatically removed from the S&P 500, which helps to explain why we did not see elevated turnover in the S&P 500 in 2020. Indeed, Exhibit 3 shows that the one-way capitalization-weighted turnover for the S&P 500 in 2020 (4.17%) was in line with the long-term average since the early 1990s.

Although many market participants may have expected constituent changes at the June 2025 rebalance, relatively few constituent changes have taken place on the third Friday in March, June, September and December since 1995. This reflects the fact that the timing of many S&P 500 index changes was driven by corporate events, and that index changes are not guaranteed.

The posts on this blog are opinions, not advice. Please read our Disclaimers.