Get Indexology® Blog updates via email.

In This List

Turning the Tide: Global Markets Outperforming U.S. Equities

The Market Measure: April 2025

Expectations and Anomalies

Terrible Twos

Resilience amid Rising Volatility: The S&P 500 Low Volatility Index

Turning the Tide: Global Markets Outperforming U.S. Equities

Contributor Image
Diego Zurita

Analyst, Global Equities & Thematics

S&P Dow Jones Indices

Since 2000, annual returns of international equities have been better than those of the U.S. only nine times, as shown by Exhibit 1. After the Global Financial Crisis of 2009, the S&P United States LargeMidCap outperformed the S&P World-Ex-U.S. Index in most years.

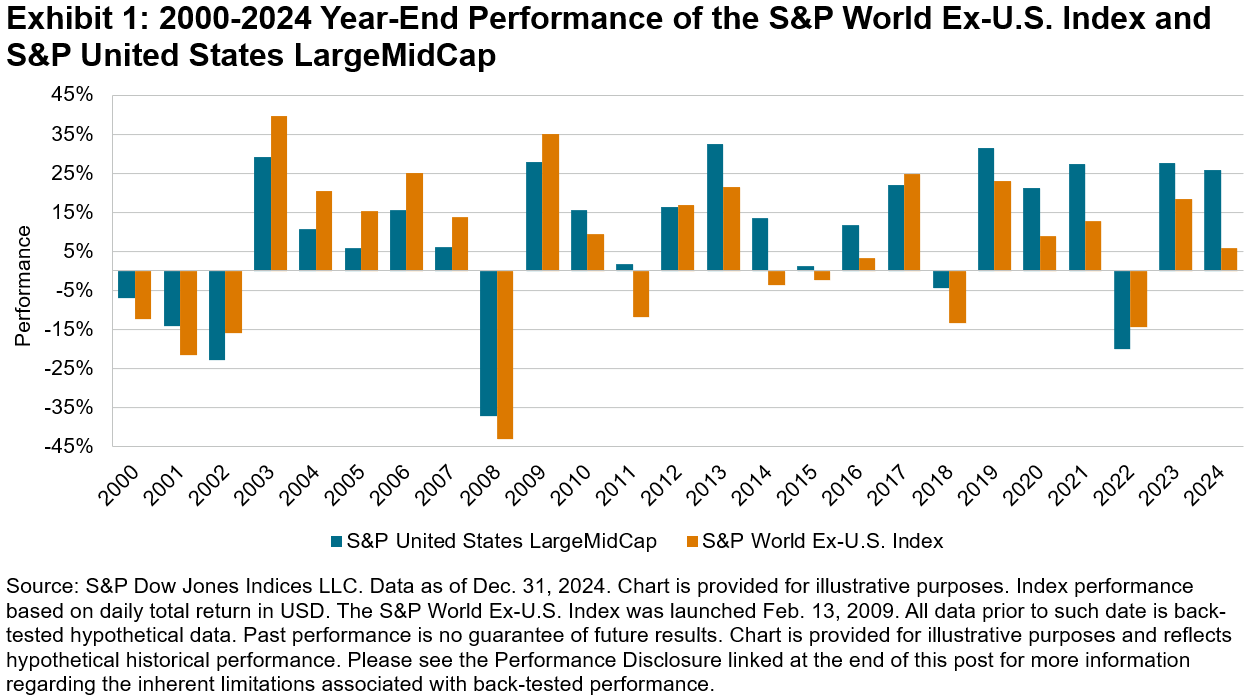
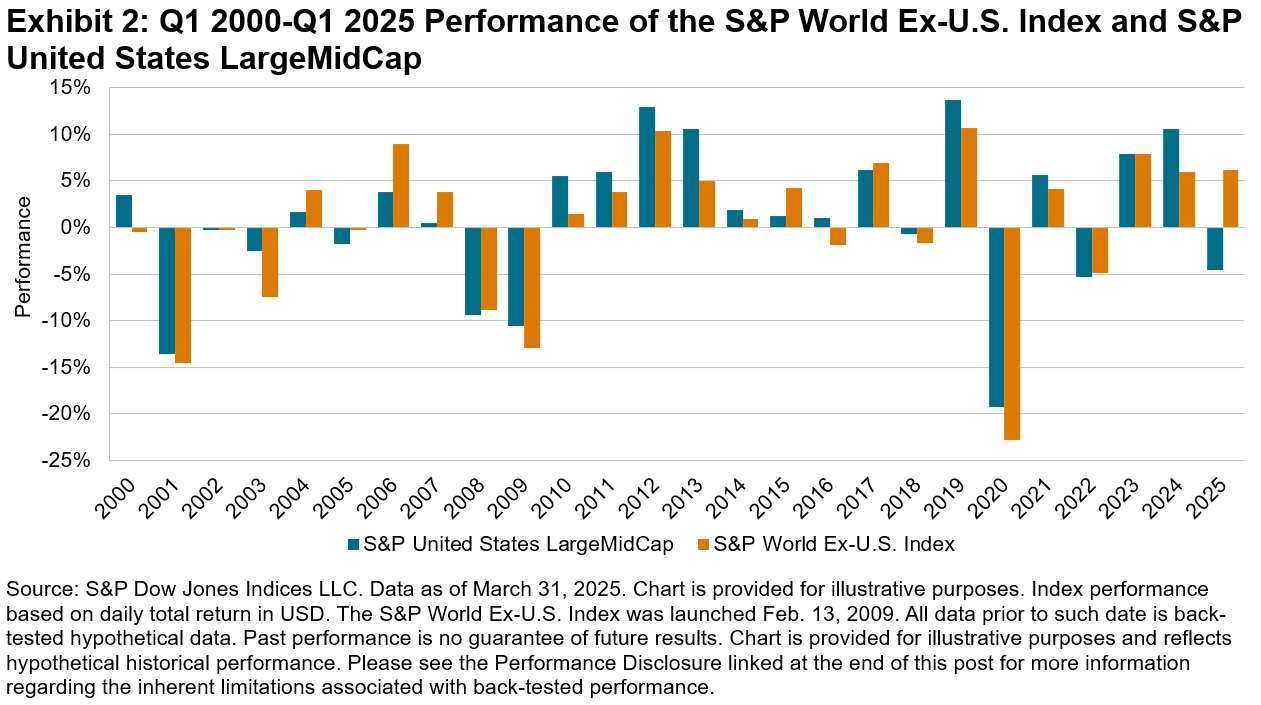
However, for the first time since 2017, developed market equities have ended the first quarter outperforming the U.S. As concerns grow about the impact of tariffs on the economy and uncertainty looms, market participants appear to be reducing their weight in the U.S. In fact, as illustrated by Exhibit 2, the S&P World Ex-U.S. Index had one of its best first quarters in recent times, while the S&P United States LargeMidCap started in the red. A strong start to the year is not always a definitive predictor of year-end performance, but what might this data suggest about the S&P World Ex-U.S. Index’s current outperformance?

The first quarter of the year was marked by uncertainty caused by geopolitical and economic developments. Tariff threats from the new U.S. administration, talks to end the war in Ukraine, shifting diplomatic relations, political changes in Germany and Canada, and reignited tensions in the Middle East were all part of a challenging beginning of the year. On the monetary front, central banks across the globe may diverge in their decisions around interest rates, but they are expected to proceed with caution due to inflation and recession concerns.

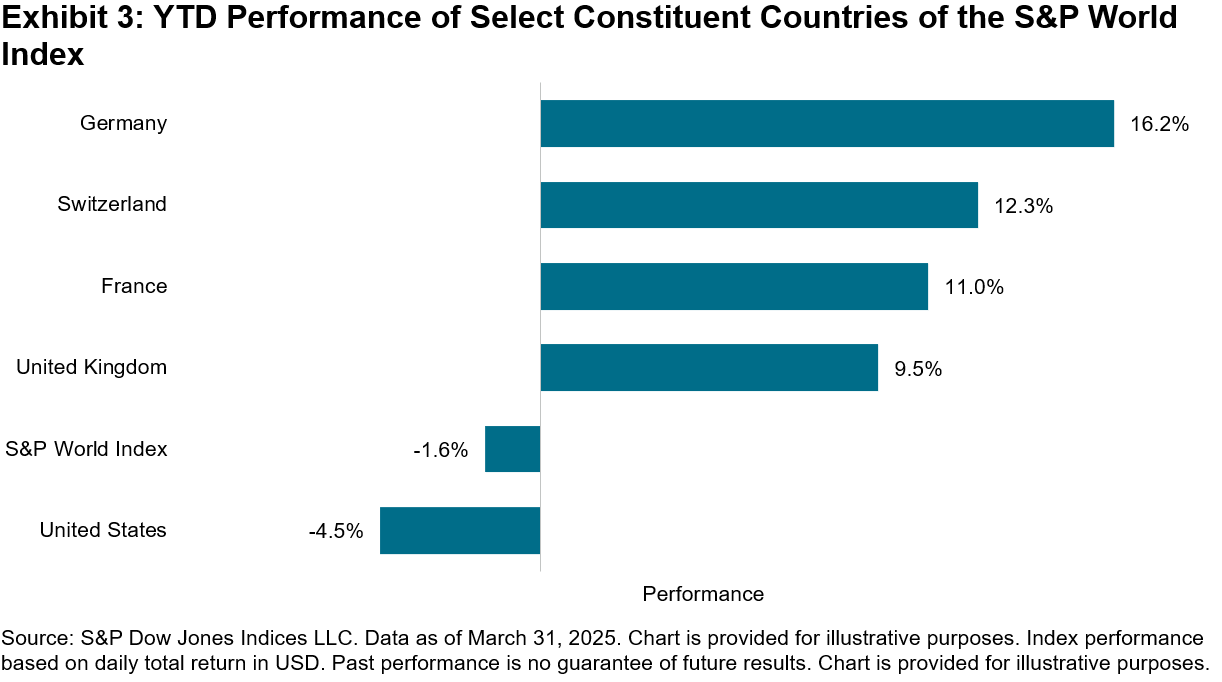
As of end of March, almost all European countries that constitute the S&P World Index started on a positive note. Germany, the U.K., France and Switzerland have been the main contributors to the outperformance of the S&P World Ex-U.S. Index. In contrast, the S&P United States LargeMidCap was among the worst performers in developed markets, decreasing 4.5%.

Among the GICS® sectors in the S&P World Ex-U.S. Index, which mostly had positive performance, there is one that stands out: Financials. The S&P World Ex-U.S. Financials (Sector) Index rose 12.2% in Q1 2025. This sector has been the main driver behind the outperformance of the S&P World Ex-U.S. Index, contributing to almost half of its increase (46%). This growth may possibly be attributed to positive economic surprises, resilience in European bank earnings and the effects on the economy of a potential end to the war in Ukraine.

Additionally, the Industrials sector, which gained 6.1%, has been an important contributor to the performance of the S&P World Ex-U.S. Index, as defense spending is expected to increase. Utilities and Energy were also among the best-performing sectors of the first quarter, as the European Commission launched a plan that aims to increase investments that contribute to energy security in the region.

Amid geopolitical tensions and evolving trade policies, international equities from developed markets in 2025 have outperformed the U.S. YTD, as some market participants are turning their focus to other geographies. Given the recent economic landscape in the U.S. and around the world, the S&P World Ex-U.S. Index is a relevant benchmark for the current market environment.

The posts on this blog are opinions, not advice. Please read our Disclaimers.

The Market Measure: April 2025

How did S&P DJI’s indices perform in Q1? Why is Low Volatility attracting interest, and what else is navigating the trade trends successfully? Explore the highlights.

The posts on this blog are opinions, not advice. Please read our Disclaimers.

Expectations and Anomalies

Contributor Image
Joseph Nelesen

Head of Specialists, Index Investment Strategy

S&P Dow Jones Indices

At one point deep into the Global Financial Crisis of 2008, I remember a clever colleague declaring “less down is the new up.” He wasn’t alone in this point of view, since in a world with so many markets and indices falling in unison, those that performed relatively better justifiably gained attention. One of those standouts at the time was the S&P 500® Low Volatility Index (“Low Vol”).

Nearly two decades have passed since then, and Low Vol has continued to stand out during downturns, including 2025’s market swoon, as shown in Exhibit 1.

This isn’t unusual; Low Vol has a track record of losing less, while still participating in upside, in a pattern often referred to as the “low volatility anomaly.” Researchers call this factor’s performance an anomaly since it defies conventional economic theory about the positive relationship between return and risk. Explanations for this breakdown in the risk/return relationship center around mispricing (more precisely, underpricing) of lower-risk stocks and overpricing of higher-risk stocks due to a mix of behavioral, structural and economic drivers.

By design, the Low Vol index has historically delivered less risk than the S&P 500, with an annualized volatility of 11.6% compared to 15.3% for The 500™ and a lower beta (0.7) over the 25 years ending March 2025. Lower volatility and beta come from capturing less of the ups and downs of market movers, but in the case of Low Vol, this rate of capture is not symmetrical. Looking again at the 25-year period ending in March 2025, we calculated monthly upside and downside capture ratios for Low Vol relative to The 500, as shown in Exhibit 2.1

The observed upside and downside capture characteristics of Low Vol have played out in real time to various degrees of magnitude through expansions and downturns over the last 25 years. In recent months, the factor has appeared to show relative resilience once again, as illustrated by Exhibit 3’s chart showing rolling one-year excess performance versus The 500.

It is clear from Exhibit 3 that the recent performance differential between Low Vol and The 500, while noteworthy, is not without precedent and indeed has been surpassed during previous crises. Suffering less downside, on average, than the S&P 500, but participating slightly more during rebounds, repeated again and again, has historically led to a widening margin of cumulative outperformance for Low Vol versus The 500 over the last 25 years, as shown in Exhibit 4. On an annualized basis, the S&P 500 Low Volatility Index rose 9.9% per year compared to 7.0% for The 500.

Measures of risk, rolling performance and average upside/downside capture shed light on the persistent characteristics of S&P 500 Low Volatility Index, but viewing them together tells a longer-term story about the anomalous power of a defensive stance historically.


1  Upside and downside capture ratios are based on monthly performance of the S&P 500 Low Volatility Index relative to the S&P 500 from March 2000, to March 2025 and are capped at no more than 100% and no less than 0%.

The posts on this blog are opinions, not advice. Please read our Disclaimers.

Terrible Twos

Contributor Image
Joseph Nelesen

Head of Specialists, Index Investment Strategy

S&P Dow Jones Indices

Life has been a little eventful since we last checked in. Under normal circumstances, this blog would review March and Q1 performance of S&P 500® sectors and blends. Yes, tariffs are the elephant in the room we’ve been unable to avoid all year, but as of April, that elephant seems to have invited the rest of the herd inside for a rampage.

In April, the tariff narrative went global, sparking a 10.5% drop in The 500TM over the course of two days, the steepest two-day decline since the dawn of the COVID-19 pandemic in March 2020. As shown in Exhibit 1, no sector was spared from the pain over the first week of April, with performance ranging from a 3.8% drop for Consumer Staples to Energy’s 15.3% fall.

Although every sector declined YTD in April, not all fell as much as the broader market. At any given time, at least one sector must be outperforming the others, with historically cyclical and defensive sectors faring better or worse depending on market direction. In a previous blog, we illustrated the relative performance of cyclical and defensive blends of sectors through the first two months of 2025, using a simple methodology of creating two blends that combine five higher-risk or five lower-risk sectors, as discussed in recent research.1

In Exhibit 2, we show daily excess returns of each five-sector blend (cyclical and defensive) for every trading day of 2025, through April 4.

Two observations might stand out from this plot, one quite intuitive and the other perhaps more curious. First, the upward sloping trend of the cyclical data points and the downward slope of the defensive blend data illustrate that each has had a historical tendency to directionally outperform in markets where we would expect them to. Second, the spread of excess performance outcomes for the cyclical blend appears more tightly grouped than that of the defensive blend. Why might this be so?

The answer is that cyclical sectors are where we find most of the Magnificent 7, which have been responsible for a disproportionate share of The 500’s decline. More precisely, while the Magnificent 7 averaged 31.9% of total weight in the benchmark YTD through April 4, they were responsible for contributing more than half of the benchmark’s decline over the same period. Many of these stocks were already on unsteady ground after disruption of the AI competitive landscape in Q1, and now that tariffs have been announced to be broader and larger than anticipated, their sectors’ higher-than-average foreign revenue exposure has caused a new wave of worries.

Exhibit 3 illustrates the weight of each blend in The 500 and the proportion of Magnificent 7 weight in each, suggesting that the cyclical blend’s fortunes may be more closely (but not entirely) tied to those of the largest stocks in the benchmark, which would make relative outperformance more constrained when those large stocks lead performance up or down.

Despite this concentration of mega-cap stocks in the cyclical blend, it has still managed to slightly outperform The 500 by 0.3% YTD, as shown in Exhibit 4. Of course, the defensive blend has withstood the barrage even better, outpacing the benchmark by 9.9%.


1  Cyclical and defensive blends are composed of the top five and bottom five sectors as ranked by historical beta and volatility. Real Estate, ranked in the middle of the 11 S&P 500 sectors, is excluded from this analysis.

The posts on this blog are opinions, not advice. Please read our Disclaimers.

Resilience amid Rising Volatility: The S&P 500 Low Volatility Index

Contributor Image
Kevin Multhaup

Senior Analyst, Factors and Dividends Indices

S&P Dow Jones Indices

Until recently, the continuous rise of the S&P 500® seemed unstoppable. However, with the return of market volatility and macroeconomic uncertainty, there has been a growing appetite for defensive strategies and risk mitigation.

The S&P 500 Low Volatility Index has emerged as a standout performer, further solidifying its reputation for stability in uncertain times. This index tracks the 100 companies within the S&P 500 with the lowest volatility and has demonstrated significant outperformance YTD. As of April 4, 2025, the index was up 0.5%, surpassing the S&P 500 by 14.0%. Since the market’s peak on Feb. 19, 2025, to April 4, 2025, the index was down 3.7%, while the S&P 500 was down 17.3% (see Exhibit 1).

Diversified Approach to Risk Mitigation

Beyond its defensive stance, this index offers a diversified approach to risk mitigation by reducing exposure to mega-cap stocks and increasing weight to defensive sectors such as Utilities and Consumer Staples (see Exhibit 2). This positioning has contributed to its recent outperformance, which can be attributed to a combination of allocation and selection effects.

Domestically Biased Revenue Exposure

Another factor potentially contributing to the recent outperformance of the S&P 500 Low Volatility Index is the higher proportion of revenue generated by its constituents within the U.S. Exhibit 3 illustrates the weighted-average revenue exposure of the index compared to its benchmark. On average, the constituents of the S&P 500 Low Volatility Index derived 72.60% of their revenue from the U.S., in contrast to 59.67% for the S&P 500.

Defensiveness from a Long-Term Perspective

The S&P 500 Low Volatility Index has a track record of outperforming the broader market during significant drawdown events. As illustrated in Exhibit 4, the index consistently outperformed during most major drawdowns since the late 1990s.

Moreover, this index’s defensive approach has not hindered its long-term return potential. As illustrated in Exhibit 5, since 1990—including some back-tested performance—the index has nearly matched the performance of the S&P 500, underscoring its long-term credentials.

Performance in Different Market Conditions

Exhibits 6 and 7 show the performance of the S&P 500 Low Volatility Index in different market and macroeconomic conditions. The defensive qualities of the index are here further showcased, as the index overperformed the benchmark in periods of market stress and in macroeconomic environments of falling GDP growth.

Conclusion

By focusing on stocks with the lowest volatility, the S&P 500 Low Volatility Index has recently shown robust outperformance relative to the broader market. Its diversified exposure to defensive sectors, bias towards domestically oriented stocks, coupled with reduced reliance on mega-cap ones, has also significantly contributed to its lower drawdowns and long-term risk-adjusted outperformance.

The posts on this blog are opinions, not advice. Please read our Disclaimers.