


In unpredictable markets, the ability to more accurately model and predict volatility may offer unique benefits when applied to indices used in insurance and structured products. Learn how the S&P 500 Engle Indices measure dynamic exposure to the S&P 500 while applying a predictive volatility control mechanism, which employs a variation of the GARCH model inspired by the research of Nobel Laureate Robert F. Engle.
The posts on this blog are opinions, not advice. Please read our Disclaimers.Applying Nobel Prize-Winning Volatility Research to the S&P 500
Macro Madness
U.S. Homeland Securities – Selecting Firms with U.S.-Centric Revenue
Above Mexico's Stock Arena
The S&P 500 Futures Quanto USD-BRL Currency Adjusted Index: Measuring Currency Exchange Risk and Interest Rates in Brazil
Applying Nobel Prize-Winning Volatility Research to the S&P 500
Macro Madness

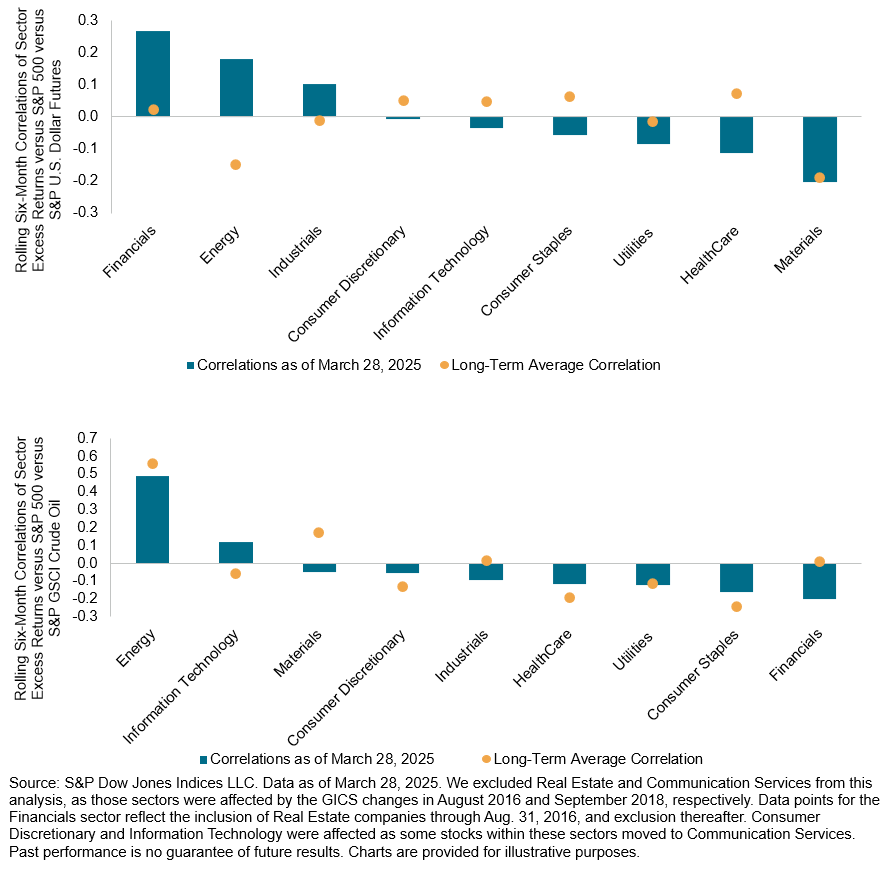
While U.S. basketball fans have been in the midst of March Madness, there has been no shortage of activity in global markets. Uncertainty over the policies from the new U.S. Presidential administration, stagflation concerns and, particularly, tariffs have weighed on investor sentiment, with the S&P 500® down 4% in Q1. While fans analyze various teams to pick their brackets, what indicators are available to equity investors when making sector weighting decisions? With all eyes on the 10-Year Treasury yield, the U.S. dollar and crude oil, understanding the evolving relationship of sectors to bonds, currencies and commodities may prove timely in an environment of heightened macro concerns.
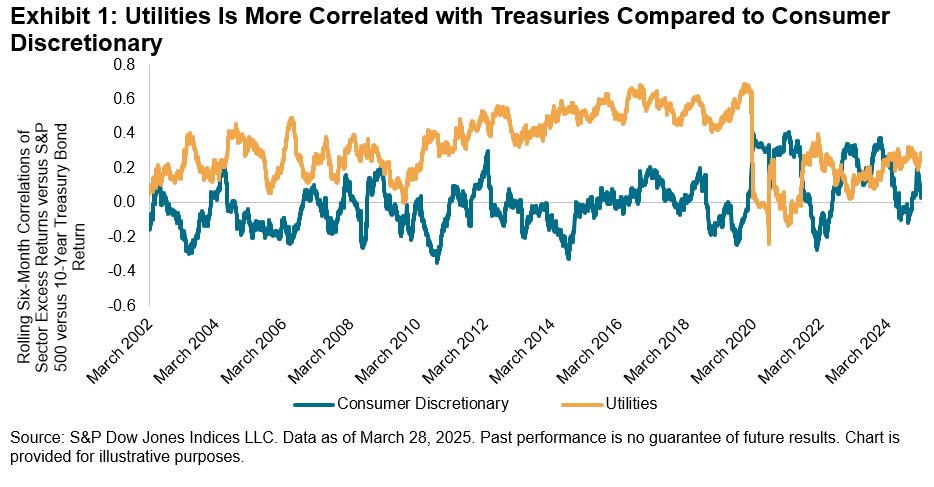
Though March Madness teams have been narrowed from the Elite Eight to the Final Four, we can begin our analysis by sampling 2 of the 11 GICS® sectors—the traditionally defensive Utilities sector and the cyclical Consumer Discretionary sector. Consumer Discretionary is particularly germane to market participants as it contains the Automobiles industry group, an industry that may be especially pressured by the recent announcement of auto tariffs. We calculated the historical six-month correlations of the excess returns of the S&P 500 Utilities and S&P 500 Consumer Discretionary, up 5% and down 14% YTD, respectively, versus the S&P U.S. Treasury Bond Current 10-Year Index, S&P U.S. Dollar Futures Index, and S&P GSCI Crude Oil.
Consistent with its defensive nature, Exhibit 1 shows that Utilities has tended to exhibit a strong positive correlation with bonds historically, while rate-sensitive Consumer Discretionary has had a more complex relationship. Positive correlations can arise, for example, due to an increase in yields, which may lead to a decline in spending as borrowing costs increase for consumers. On the other hand, negative correlations can occur during market downturns like we’ve seen recently, when risk-averse investors might reduce their exposure to the sector and turn toward safe havens like Treasuries. Consumer Discretionary currently has a slight positive correlation with the S&P U.S. Treasury Bond Current 10-Year Index, which is up 4% YTD.
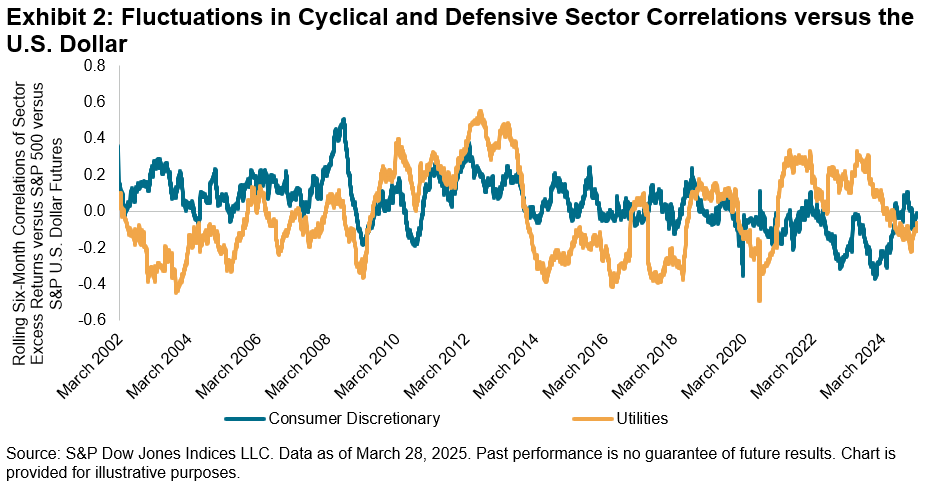
Turning to the impact of currency movements on these sectors, with the S&P U.S. Dollar Futures Index down 3% YTD, the relationship of the U.S. dollar versus Utilities and Consumer Discretionary has oscillated over time, with both recently displaying a slight negative correlation. A weaker dollar can arise as a consequence of lower interest rates, which can aid in reducing borrowing costs for these sectors. Multi-national companies within Consumer Discretionary may further benefit from the translation effect of a weaker currency. But as both sectors generate most of their revenues domestically, a stronger dollar may also benefit domestically oriented companies.
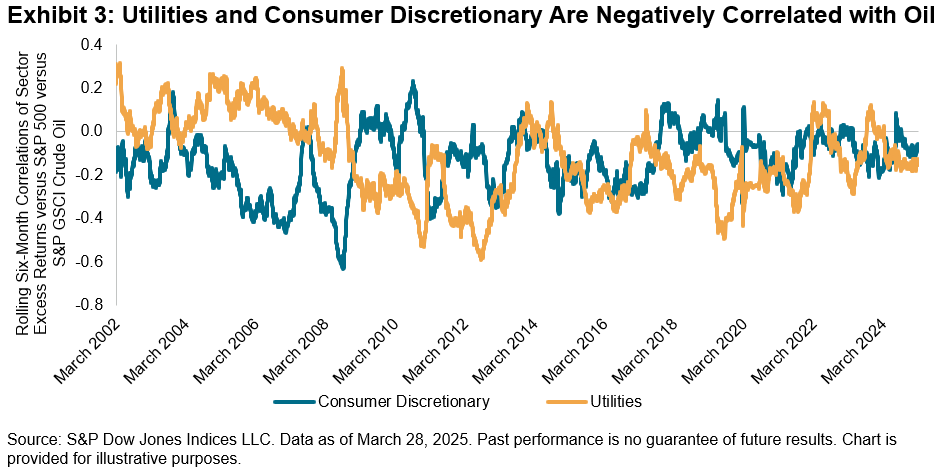
Consistent with their recent negative association with the dollar, Utilities and Consumer Discretionary also demonstrate a negative relationship with crude oil prices, as rising commodity prices can raise input costs for companies within these sectors. An additional headwind for Consumer Discretionary could be the potential reduction in disposable income from higher consumer costs. The S&P GSCI Crude Oil is up 3% YTD.
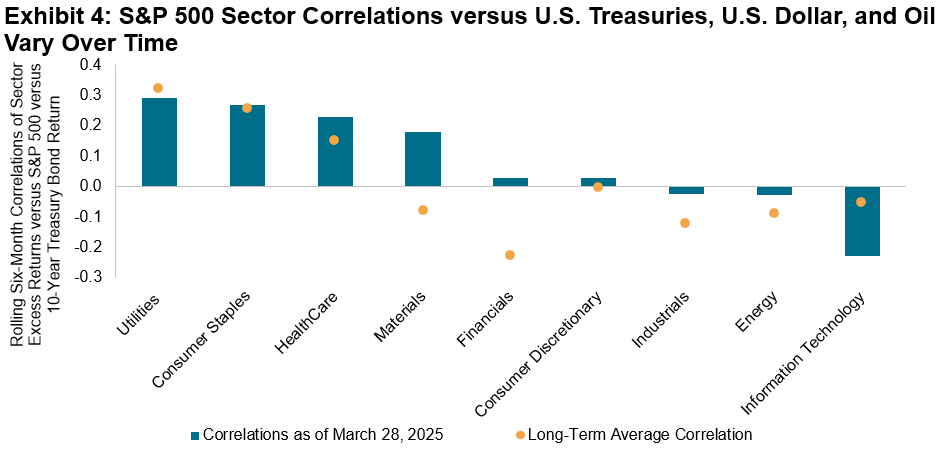
The historical fluctuation of sector performance versus Treasuries, the dollar and crude oil spans beyond these two sectors. Exhibit 4 displays the correlations of excess returns across S&P 500 sectors versus each of these macro factors, which in many cases have differed significantly from their long-term averages since 2001.
Just as sports fans put their knowledge of basketball teams to the test as they approach the end of March Madness, understanding the nuances of sector movements versus bonds, currencies and commodities may prove useful when navigating market turbulence as we approach the beginning of Q2.
The posts on this blog are opinions, not advice. Please read our Disclaimers.U.S. Homeland Securities – Selecting Firms with U.S.-Centric Revenue

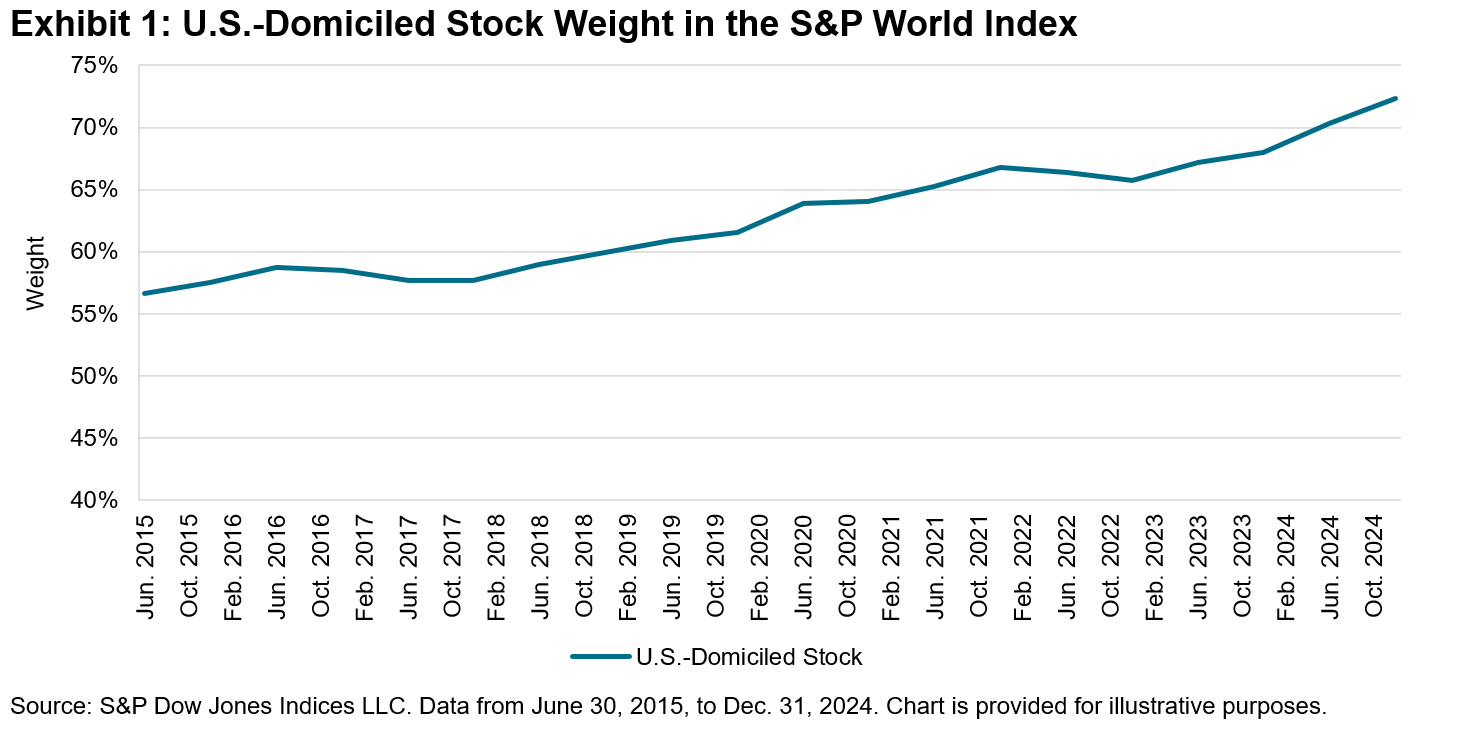
The S&P 500® has long been seen as the gauge for U.S. large-cap equities. Market participants seeking broader global exposure often turn to developed market indices, like the S&P World Index. However, over the past decade, developed market benchmarks have seen a notable shift: U.S.-domiciled stocks have increased their weight substantially, representing 72% of the S&P World Index as of year-end 2024 (see Exhibit 1).
Truly U.S.?
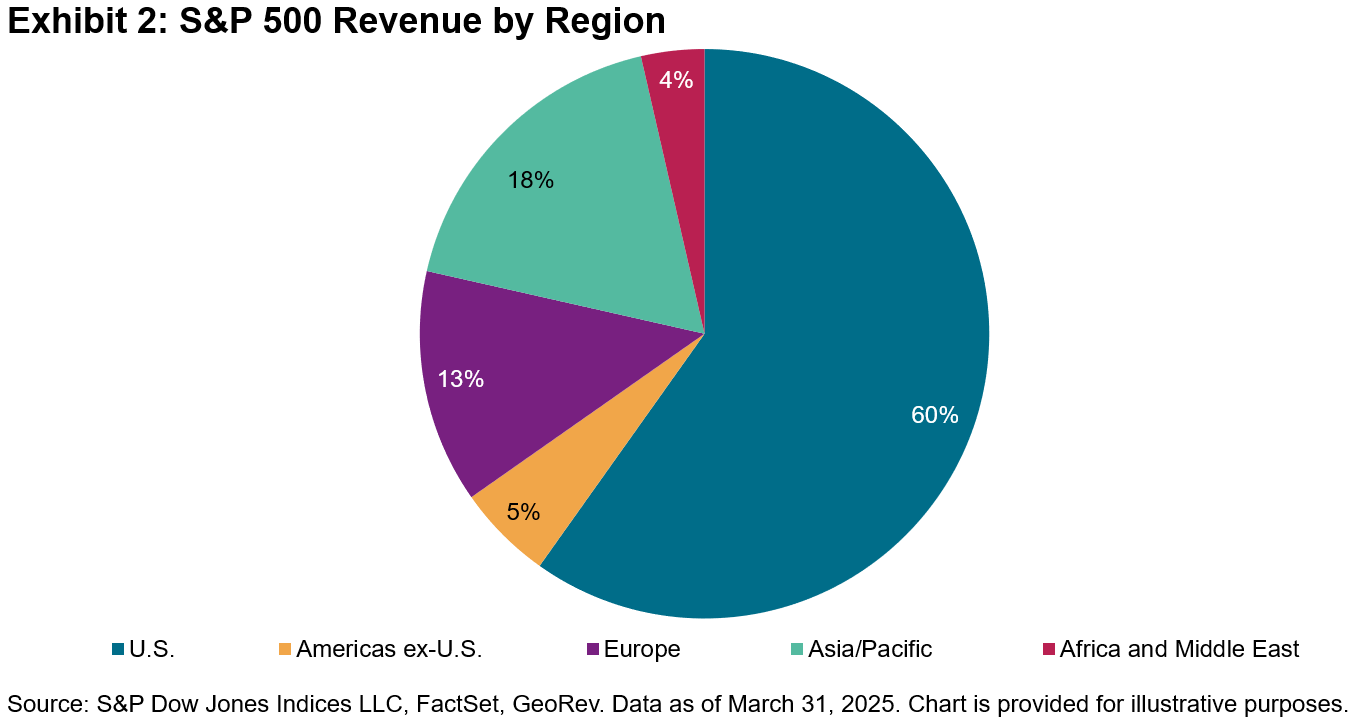
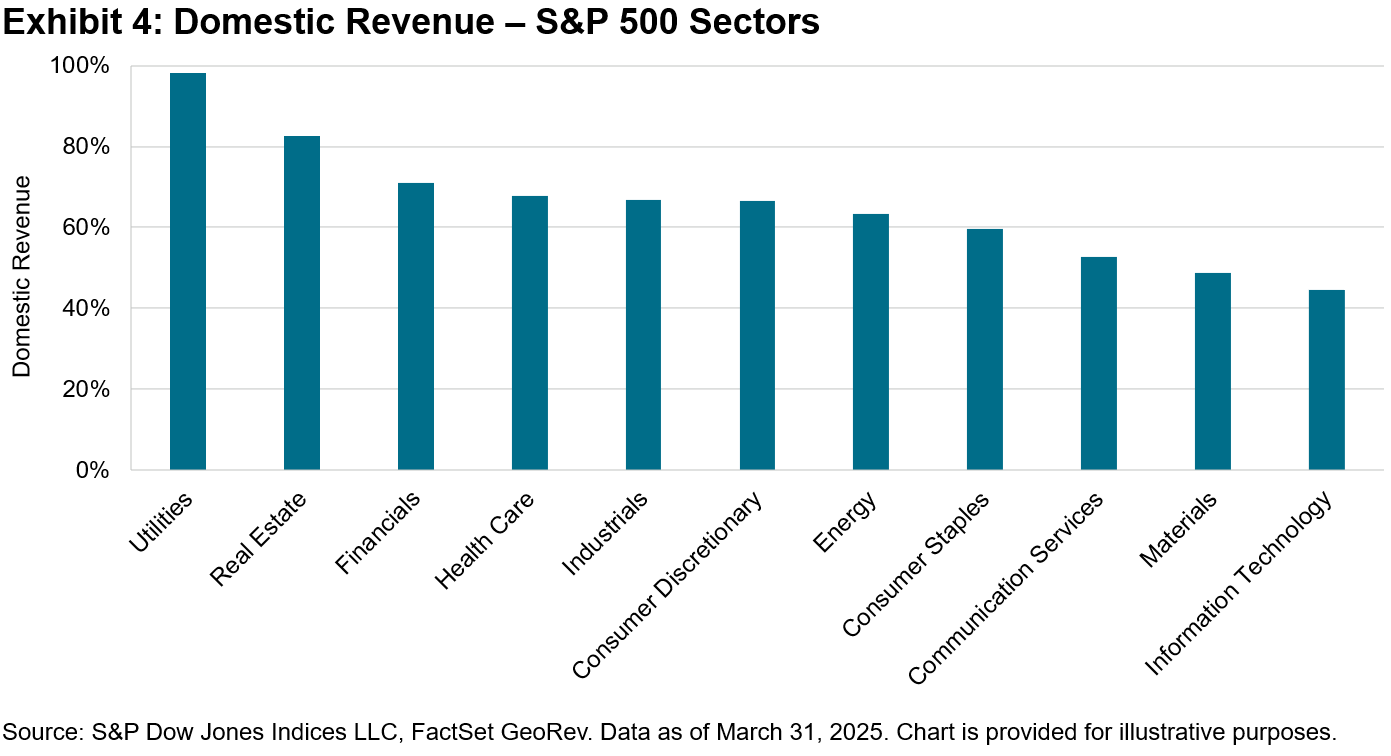
This trend highlights the growing importance of the U.S. in the global market and is a consequence of the strong performance of the U.S. market in recent years. Yet, this raises an important question—how global is U.S. exposure, really? And, conversely, how much of it comes from the U.S.? Analyzing revenue streams from companies in The 500™ reveals an international dimension. With less than 60% of revenue in The 500 generated domestically, international markets represent a material revenue source.
Presenting the S&P 500 U.S. Revenue Leaders Index
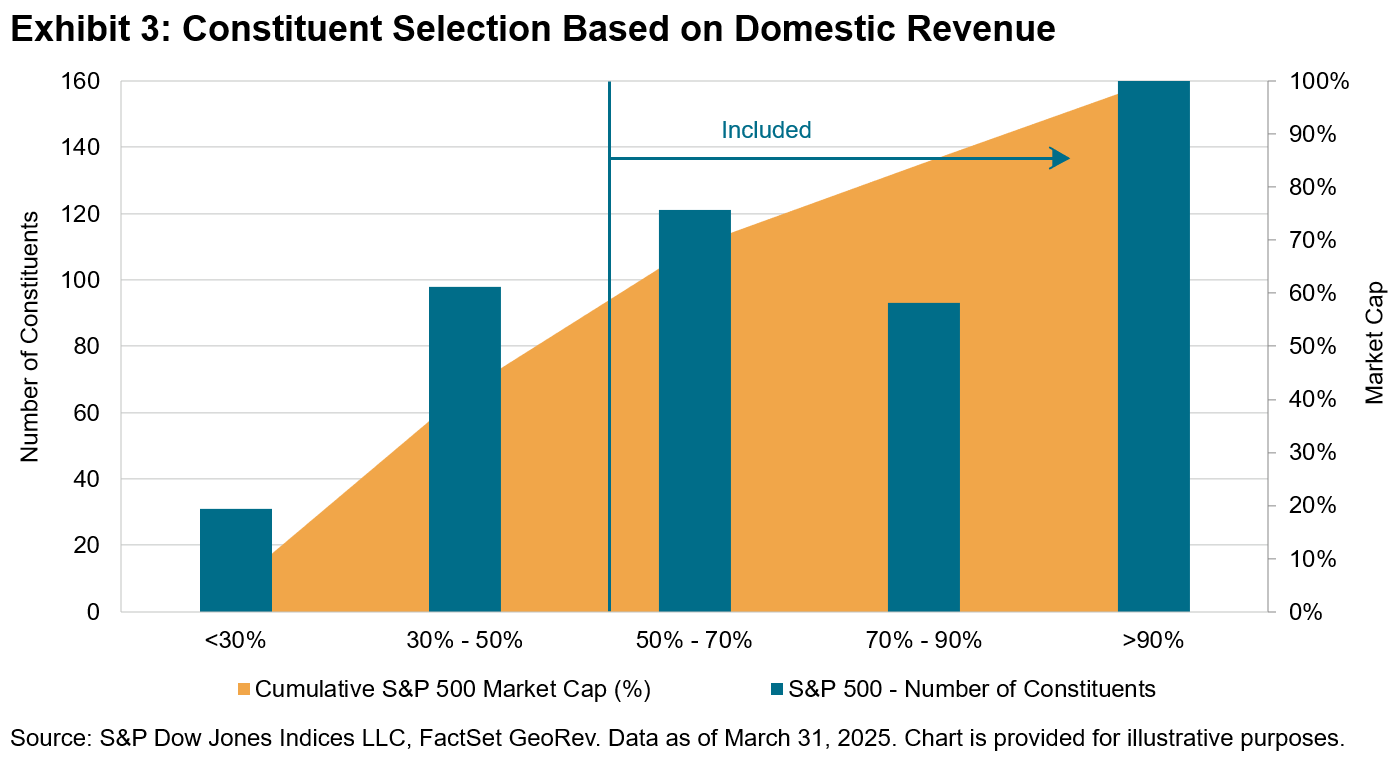
To limit global exposure and provide a more precise representation of U.S. domestic revenue-driven companies, we recently launched the S&P 500 U.S. Revenue Leaders Index. This index focuses on where companies generate their revenue, including only those that derive at least 50% of their revenue from domestic sources.
Sector Difference
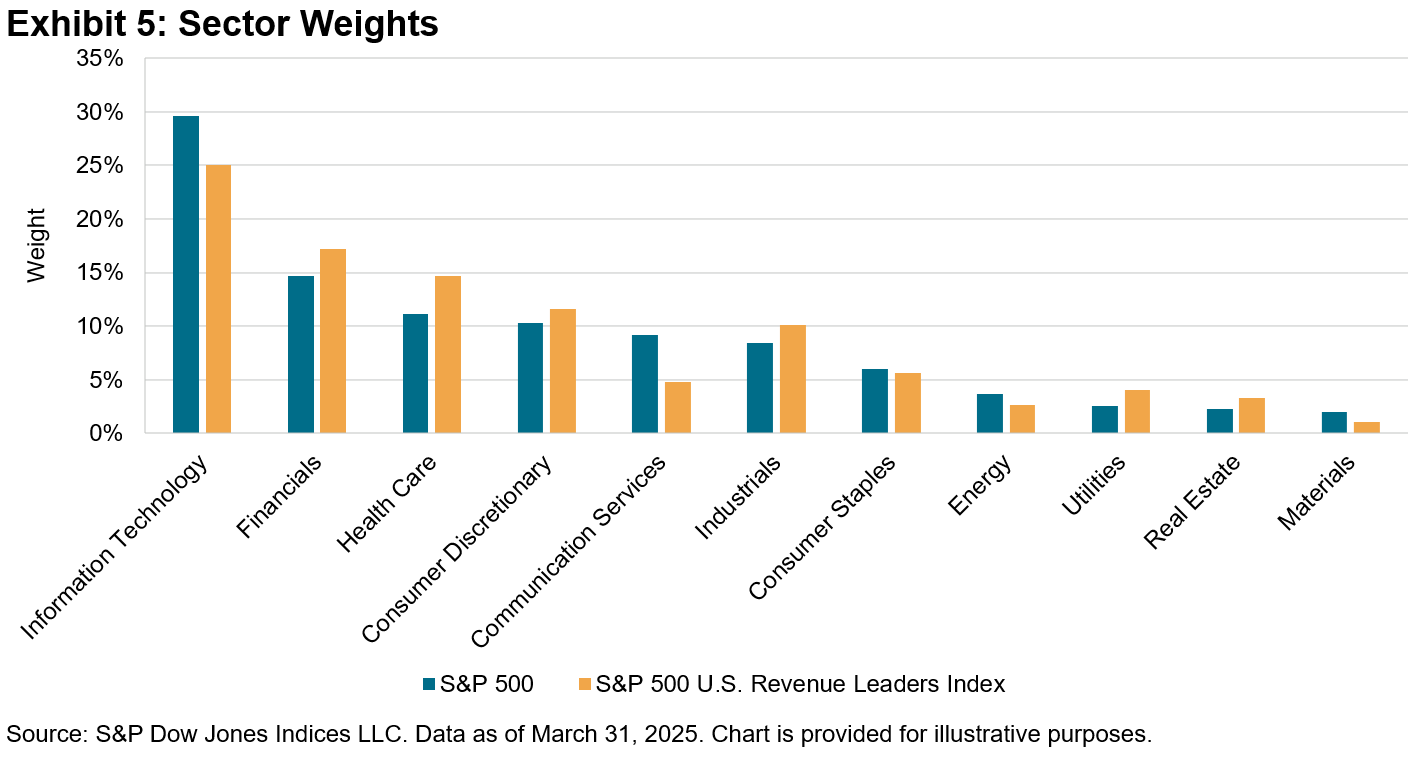
An interesting feature of this index is its weighting scheme. The S&P 500 U.S. Revenue Leaders Index rebalances quarterly, in line with its benchmark, but unlike The 500, the index utilizes a modified float-adjusted market capitalization weighting, with sector weights constrained to +/-5% compared to the benchmark.
This is because the level of domestic revenue generation varies significantly across different GICS® sectors. For instance, the Utilities sector is unsurprisingly domestic focused, with companies generating almost the entirety of their revenues in the U.S., whereas Information Technology and Materials companies have more global operations, with domestic revenues representing only 44% and 48% of their revenues, respectively.
This differentiation necessitates the use of sector weight constraints to maintain the proportional representation of sectors broadly in line with The 500, reducing the disproportionate impact of any specific underweighted or overweighted sector.
Introducing sector weight constraints allows for a reduction of the active weight difference compared to The 500 and provides a more useful comparison to its benchmark, as well as a more accurate representation of the U.S. economy. By limiting sector weight variations, the index guards against disproportionate influence from any single sector. Comparing the sector weights at the end of March 2025, we observe that Information Technology and Communication Services were underweighted in the S&P 500 U.S. Revenue Leaders Index, whereas Health Care and Financials were more prominently represented (see Exhibit 5).
Conclusion
The S&P 500 U.S. Revenue Leaders Index tracks large-cap U.S. companies with at least 50% of their revenue exposure to the U.S. The index focuses on domestic economic activities, catering to those seeking more focused U.S. economic view. By employing sector-specific constraints, the index balances a higher exposure to more domestically focused sectors with maintaining a similar risk and performance profile to the benchmark.
Above Mexico's Stock Arena

Launched in 2021, the S&P/BMV IPC CompMx Trailing Income Equities ESG Tilted Index tracks the performance of constituents in the S&P/BMV IPC CompMx Trailing Income Equities Index, which is designed to measure the performance of large and liquid stocks listed on the BMV that have paid an average dividend greater than zero over the past five years. Constituents of the ESG tilted index must meet sustainability criteria, and the index attempts to improve the overall S&P Global ESG Score of the underlying index by over- or under-weighting components based on their S&P Global ESG Scores.1
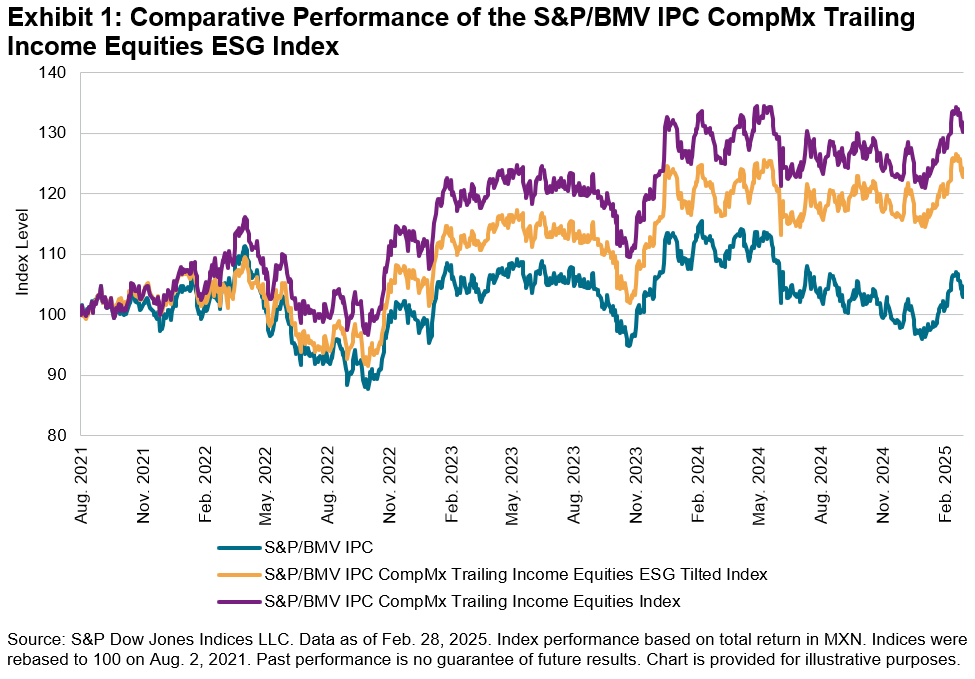
Although the index underperformed its underlying benchmark, the S&P/BMV IPC CompMx Trailing Income Equities Index, by a cumulative 7.5% since its launch, it consistently outperformed the S&P/BMV IPC—Mexico’s broad equity benchmark—every calendar year, as demonstrated in Exhibit 2.
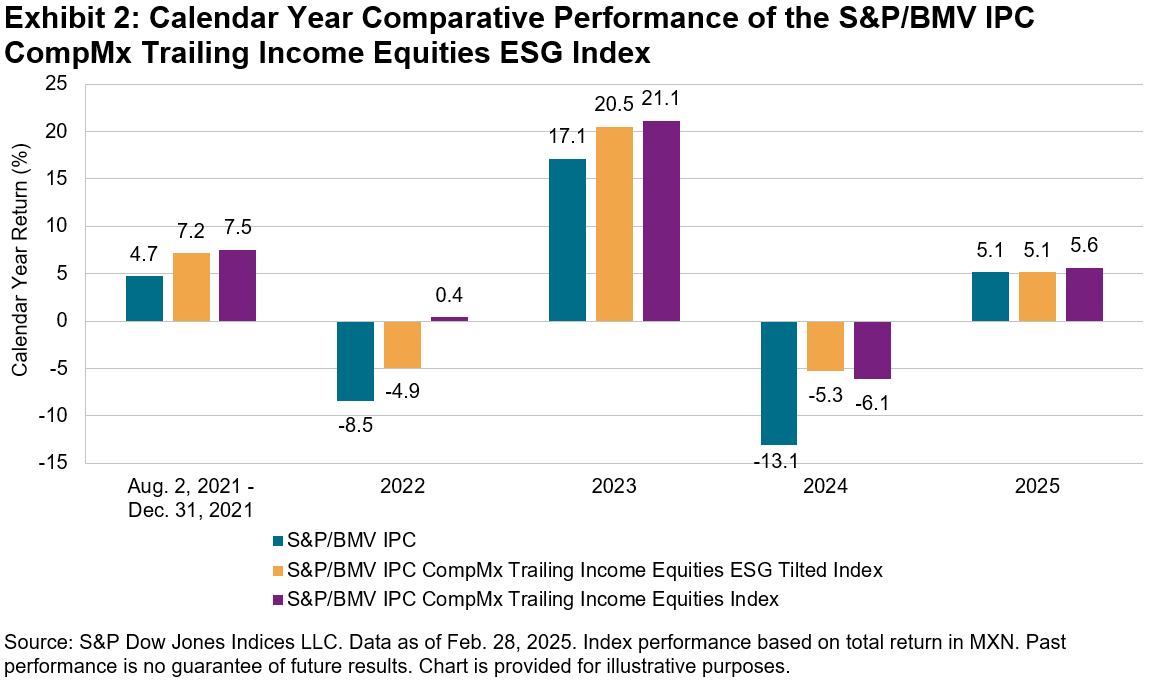
Since its launch in August 2021, the S&P/BMV IPC CompMx Trailing Income Equities ESG Tilted Index outperformed the S&P/BMV IPC by 2.5% by the end of 2021. This trend continued in the following years, with the index surpassing the S&P/BMV IPC by 3.6%, 3.4% and 7.8% in 2022, 2023 and 2024, respectively. As of Feb. 28, 2025, its YTD performance matched that of the S&P/BMV IPC, with a gain of 5.1%.
Additionally, the S&P/BMV IPC CompMx Trailing Income Equities ESG Tilted Index obtained an ESG score of 60, surpassing the score of 57 for both its underlying benchmark and the S&P/BMV IPC.
In summary, the S&P/BMV IPC CompMx Trailing Income Equities ESG Tilted Index has presented a blend of annual performance against Mexico’s leading market index, the S&P/BMV IPC, and a higher ESG score. This combination could be useful for those who are weighing both ESG and performance factors in their choices.
For those interested in further examining S&P DJI’s sustainability indices, additional details can be found in the Sustainability Index Dashboard.
1 For more information, see the S&P/BMV Indices Methodology.
The posts on this blog are opinions, not advice. Please read our Disclaimers.The S&P 500 Futures Quanto USD-BRL Currency Adjusted Index: Measuring Currency Exchange Risk and Interest Rates in Brazil

In order for a Brazilian market participant to track the S&P 500® through equity index futures, they must first convert Brazilian reais to U.S. dollars and then use U.S. dollars to enter a position in equity futures. This transaction involves two sources of risk: equity risk and currency exchange risk.
To address the currency exchange risk faced by Brazilian market participants, S&P Dow Jones Indices launched the S&P 500 Futures Quanto USD-BRL Currency Adjusted Index (S&P 500 Futures Quanto USD-BRL Index) on Nov. 1, 2024. The index provides a measurement of U.S. equities futures for Brazilian market participants. It does this by measuring the performance of the nearest-maturing quarterly E-mini S&P 500 Futures contract trading on the B3 exchange, following a quarterly roll1 schedule.2 Additionally, it integrates a quanto currency adjustment, which settles daily returns in BRL rather than the currency of denomination. This currency adjustment seeks to mitigate currency exchange volatility.
To illustrate the currency risk component, we compared the performance and risk characteristics of the S&P 500 Futures Quanto USD-BRL Index against the S&P 500 Futures Index (B3) (USD), which follows the same futures methodology but without the quanto currency adjustment. Historically, the S&P 500 Futures Quanto USD-BRL Index offered similar cumulative and periodic performance when compared with the unadjusted index (see Exhibit 1).
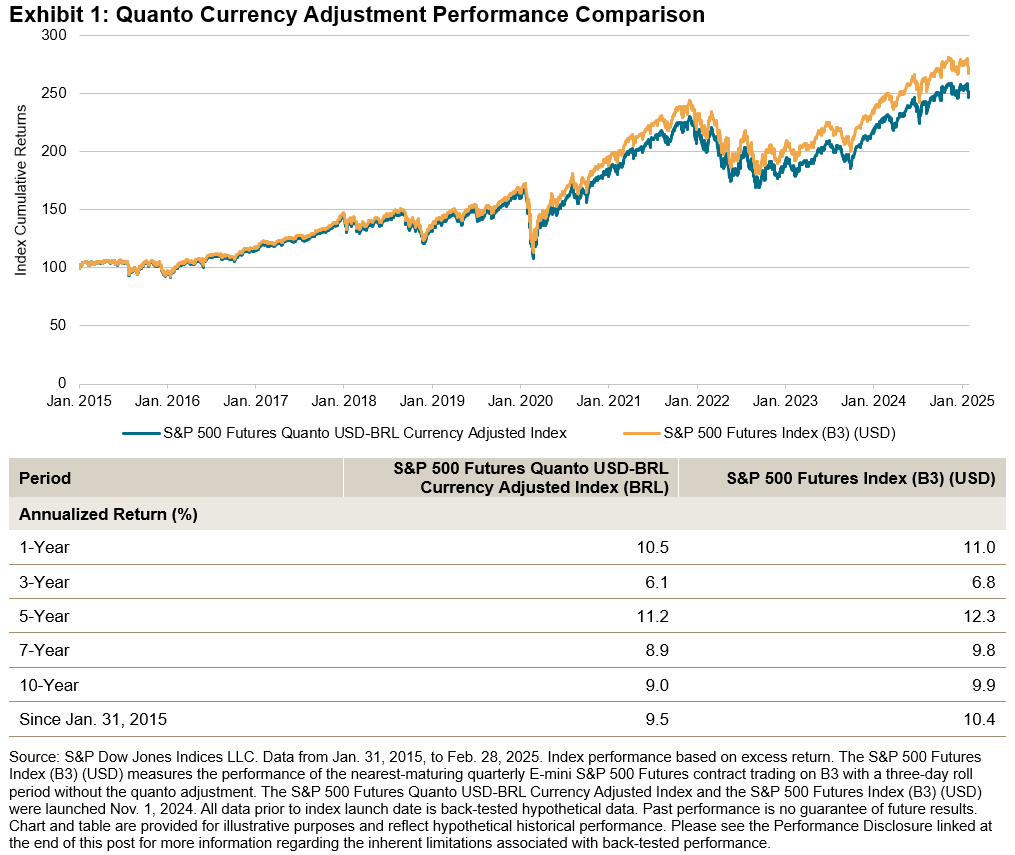
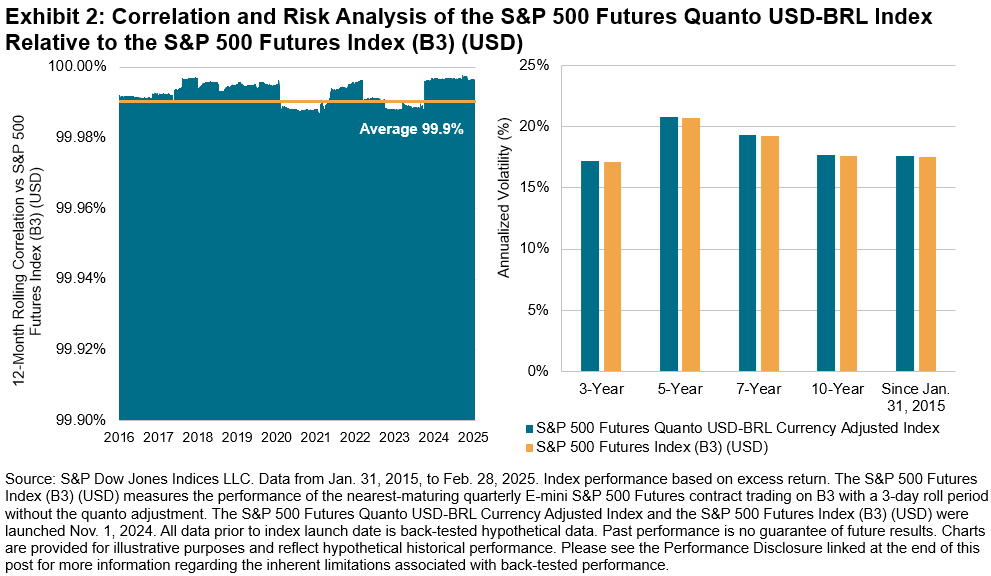
Moreover, the S&P 500 Futures Index (B3) (USD) had a historically high correlation and a similar risk profile when compared to the underlying index (see Exhibit 2). Since inception, the S&P 500 Futures Quanto USD-BRL Index closely tracked the unadjusted index, having an annualized tracking error of 0.2%.
Furthermore, the quanto adjustment led to outperformance on a total return basis as well. From Jan. 31, 2015, to Feb. 28, 2025, the S&P 500 Futures Quanto USD-BRL Currency Adjusted Index has delivered a cumulative excess total return of 350% relative to the unadjusted index.
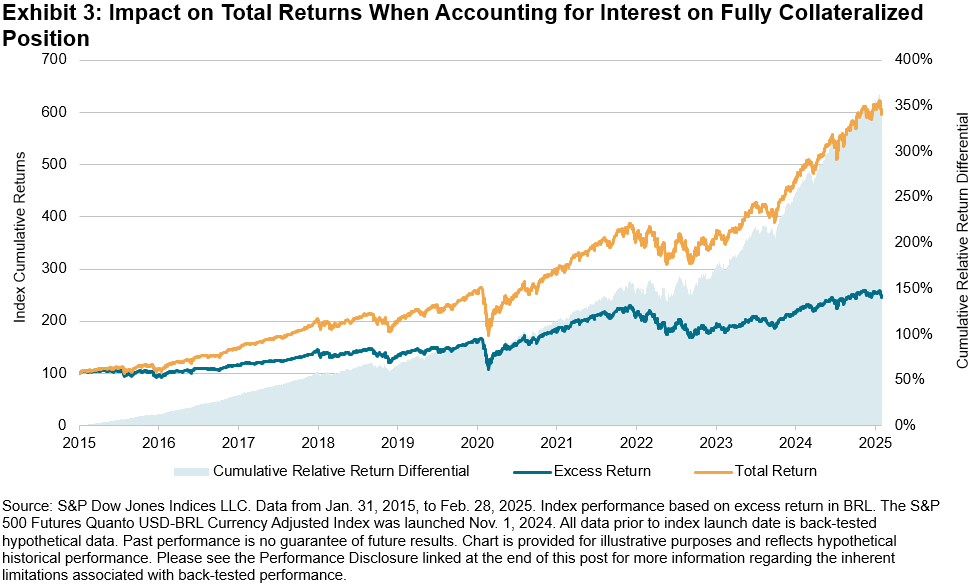
This is because futures total return indices incorporate excess return and the interest earned on hypothetical fully collateralized contract positions. Exhibit 3 demonstrates the substantial cumulative impact when incorporating the daily CETIP interbank overnight rate on a fully collateralized3 position to calculate total returns. Historically, the S&P 500 Futures Quanto USD-BRL Currency Adjusted Index earned strong returns on top of the equity index futures return due to an environment where Brazil’s interest rates remain relatively high.
In summary, the S&P 500 Futures Quanto USD-BRL Currency Adjusted Index measures U.S. large-cap equities, and has historically mitigated currency exchange risk, allowing market participants to avoid the impact of BRL/USD fluctuations. Additionally, it has provided additional outperformance due to Brazil’s interest rate environment.
1 Roll refers to the process of closing a position in a futures contract that is nearing its expiration and simultaneously opening a new position in a futures contract with a later expiration date.
2 The roll frequency schedule occurs over a three-day roll period quarterly in March, June, September and December, effective after the close of the third, fourth and fifth business day preceding the last trading date of the futures contract. The index distributes the weights equally each day over a three-day roll period. For more details, please refer to the S&P Futures Indices Methodology.
3 Collateralized refers to a financial arrangement where an asset is pledged as security for a financial obligation, serving as a guarantee.
The posts on this blog are opinions, not advice. Please read our Disclaimers.