Get Indexology® Blog updates via email.

In This List

U.S. Homeland Securities – Selecting Firms with U.S.-Centric Revenue

Above Mexico's Stock Arena

The S&P 500 Futures Quanto USD-BRL Currency Adjusted Index: Measuring Currency Exchange Risk and Interest Rates in Brazil

The Future of Private Credit

Waiting for a Bear

U.S. Homeland Securities – Selecting Firms with U.S.-Centric Revenue

Contributor Image
Luca Ramotti

Associate Director, Thematic Indices

S&P Dow Jones Indices

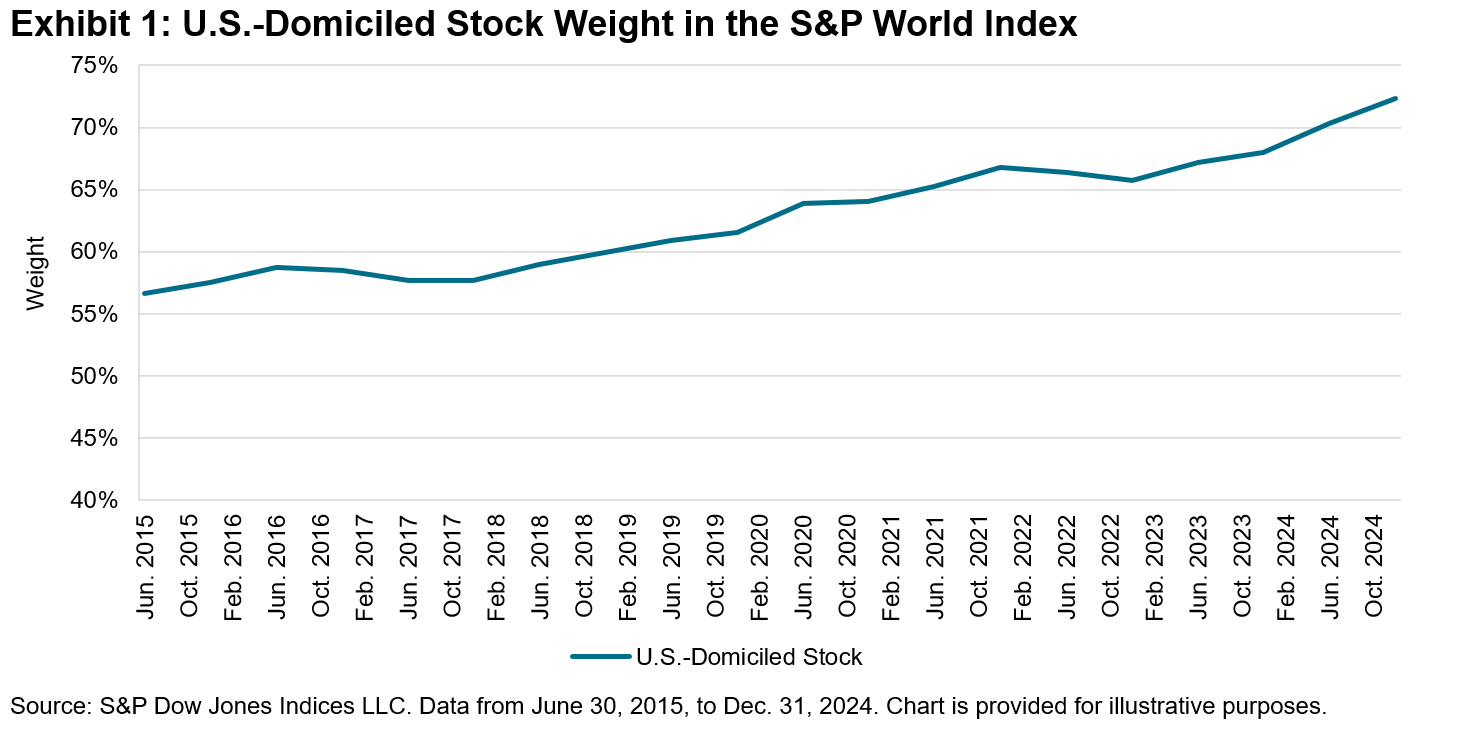
The S&P 500® has long been seen as the gauge for U.S. large-cap equities. Market participants seeking broader global exposure often turn to developed market indices, like the S&P World Index. However, over the past decade, developed market benchmarks have seen a notable shift: U.S.-domiciled stocks have increased their weight substantially, representing 72% of the S&P World Index as of year-end 2024 (see Exhibit 1).

Truly U.S.?

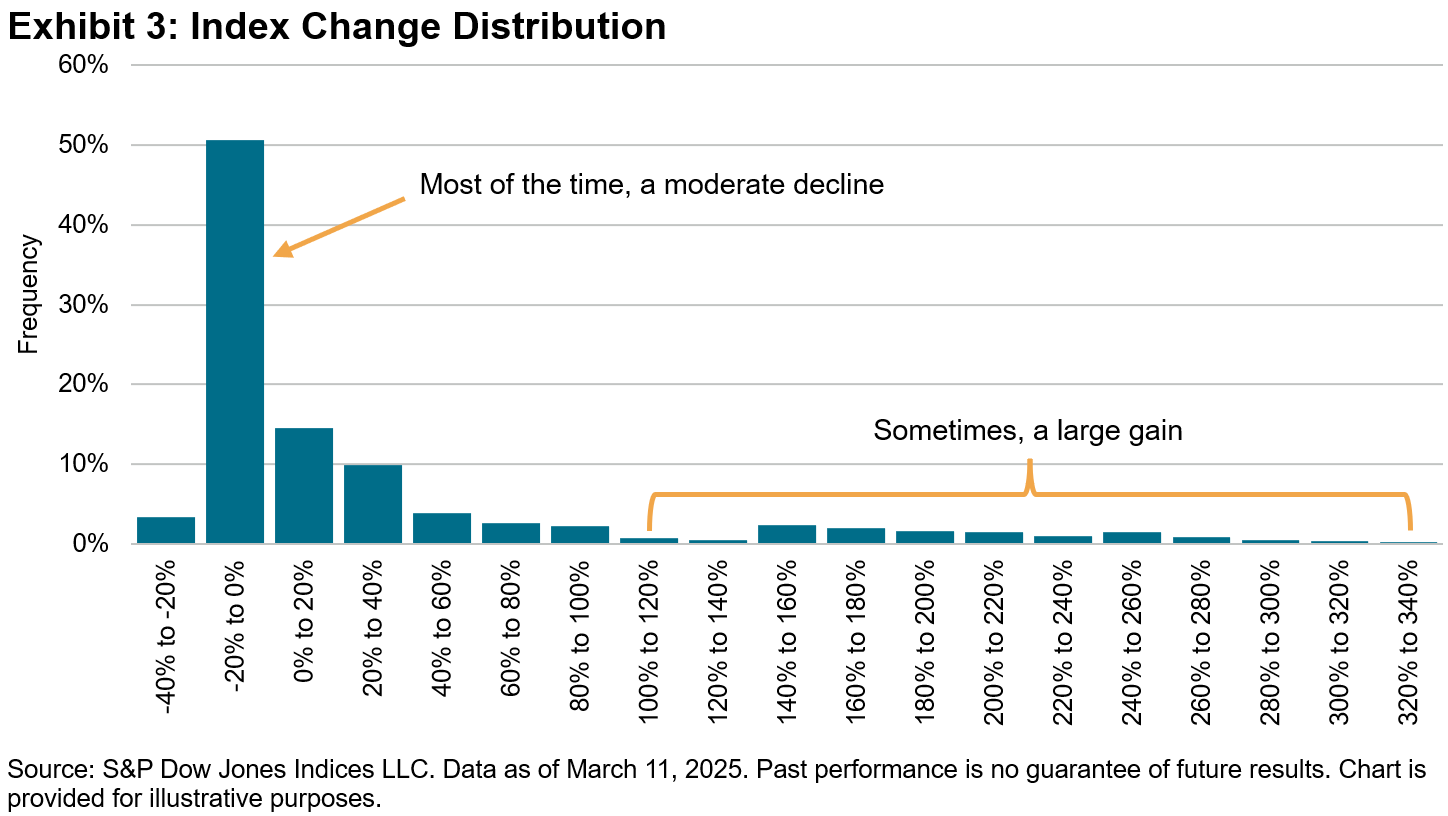
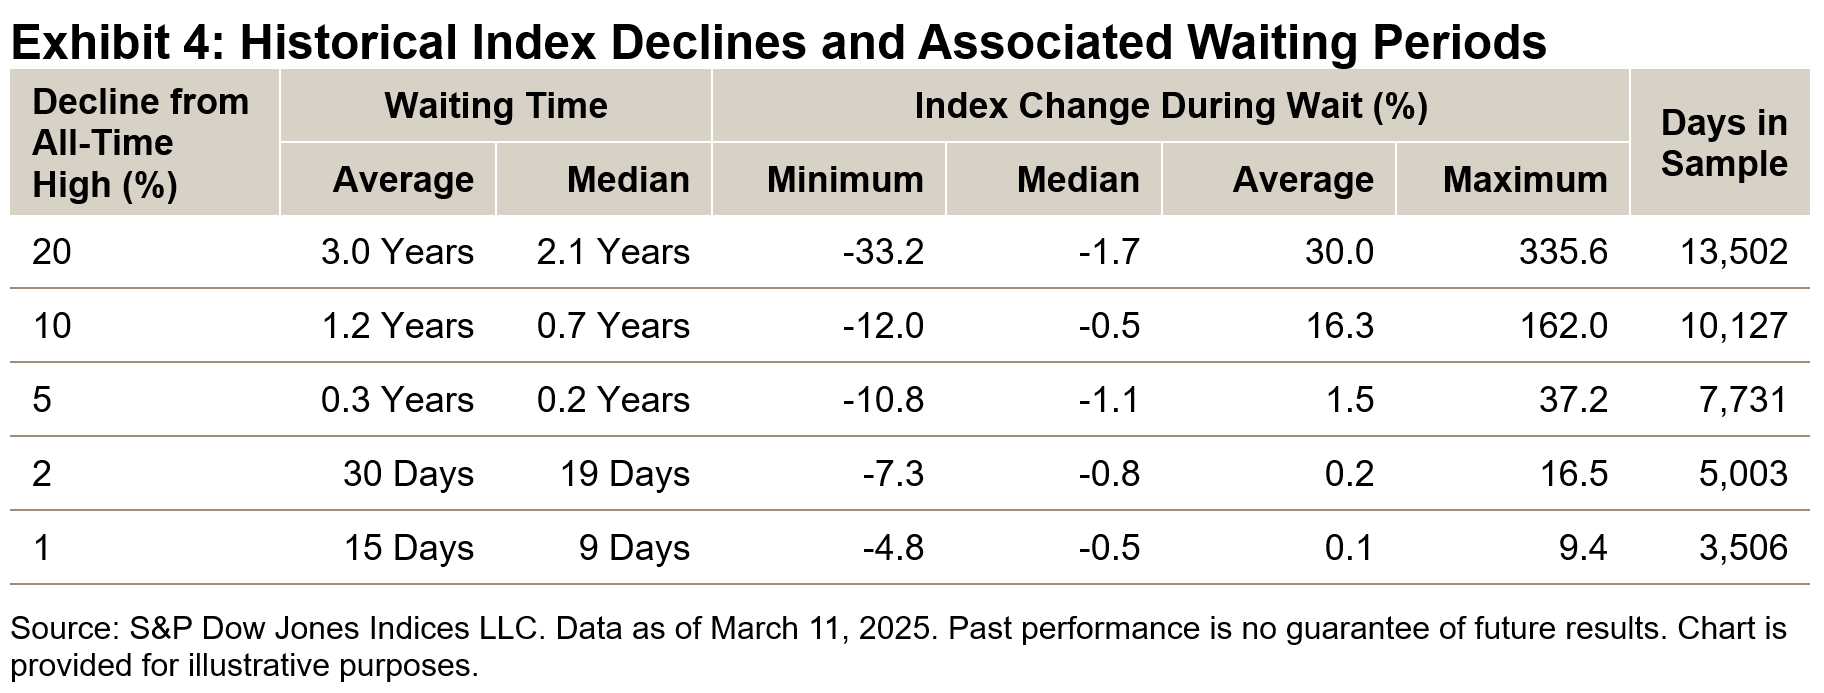
This trend highlights the growing importance of the U.S. in the global market and is a consequence of the strong performance of the U.S. market in recent years. Yet, this raises an important question—how global is U.S. exposure, really? And, conversely, how much of it comes from the U.S.? Analyzing revenue streams from companies in The 500™ reveals an international dimension. With less than 60% of revenue in The 500 generated domestically, international markets represent a material revenue source.

Presenting the S&P 500 U.S. Revenue Leaders Index

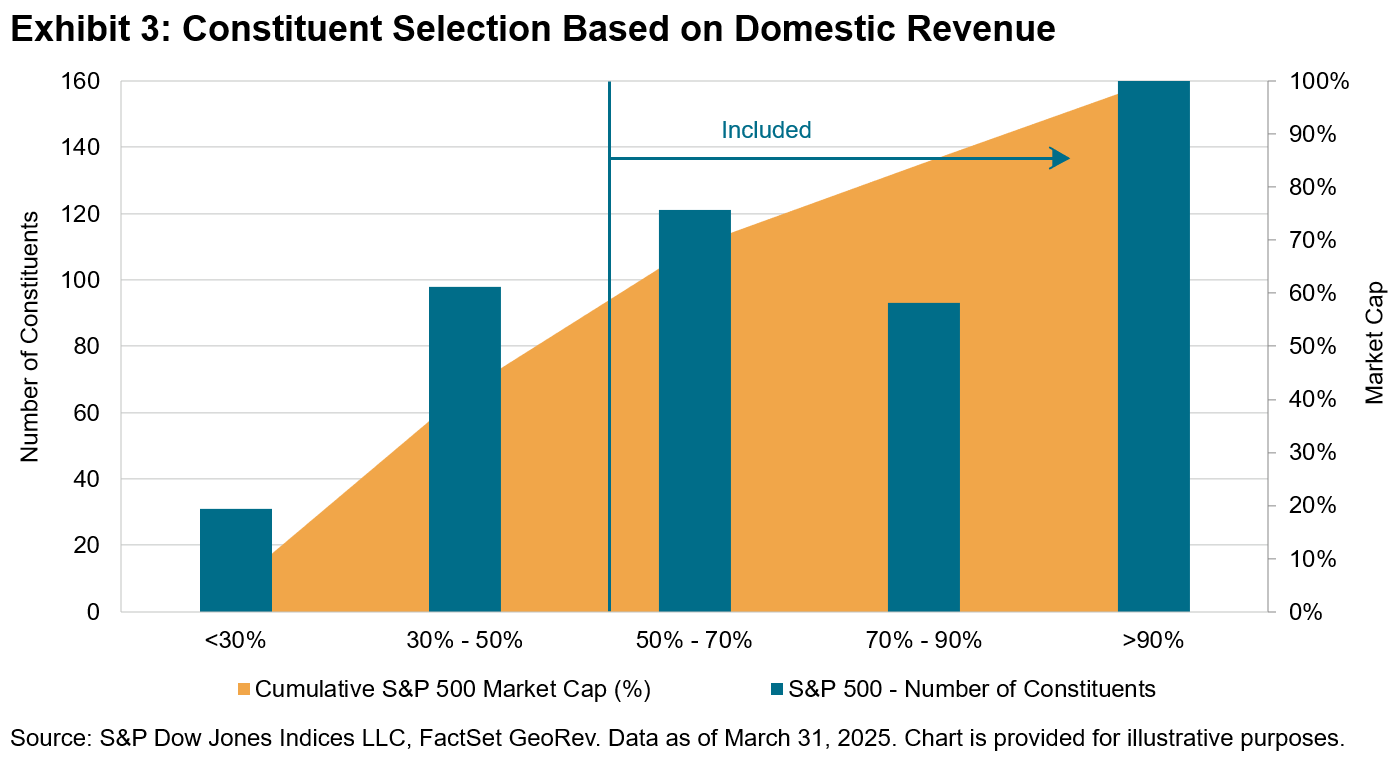
To limit global exposure and provide a more precise representation of U.S. domestic revenue-driven companies, we recently launched the S&P 500 U.S. Revenue Leaders Index. This index focuses on where companies generate their revenue, including only those that derive at least 50% of their revenue from domestic sources.

Sector Difference

An interesting feature of this index is its weighting scheme. The S&P 500 U.S. Revenue Leaders Index rebalances quarterly, in line with its benchmark, but unlike The 500, the index utilizes a modified float-adjusted market capitalization weighting, with sector weights constrained to +/-5% compared to the benchmark.

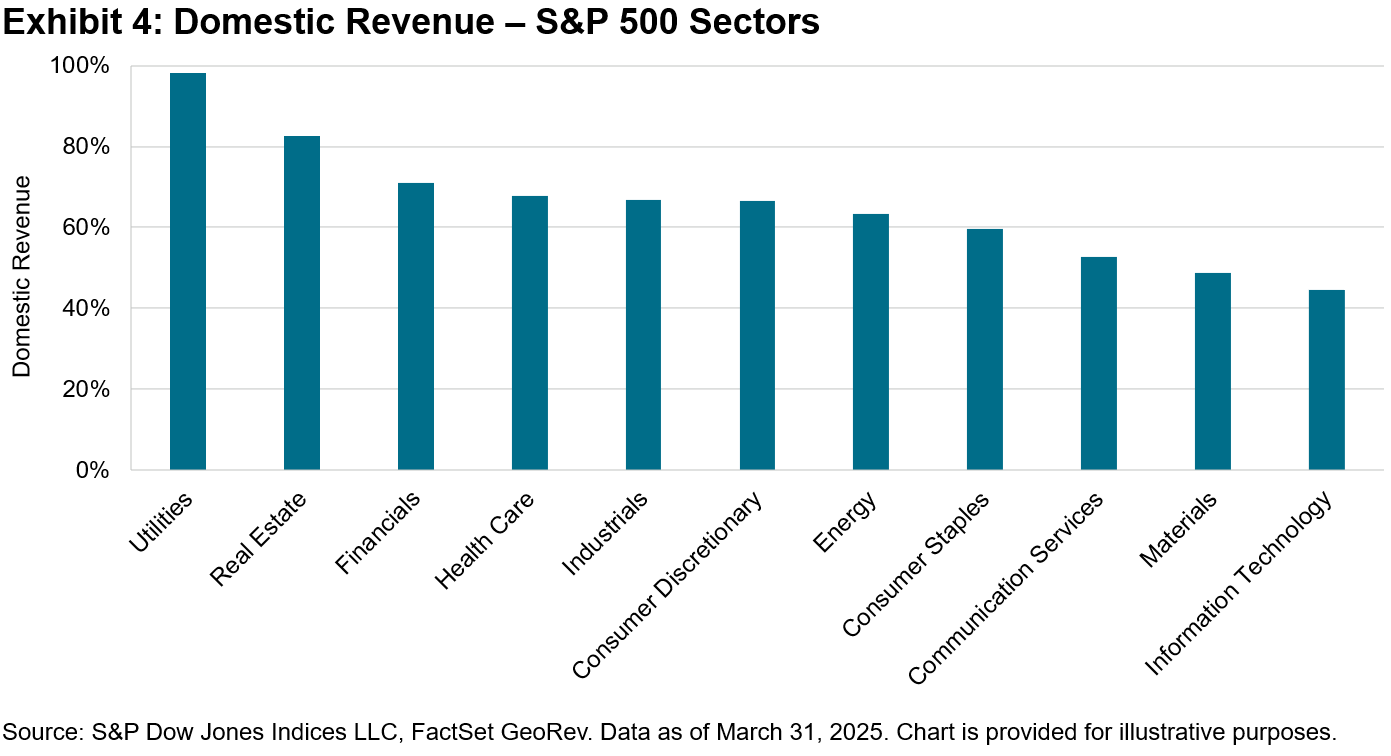
This is because the level of domestic revenue generation varies significantly across different GICS® sectors. For instance, the Utilities sector is unsurprisingly domestic focused, with companies generating almost the entirety of their revenues in the U.S., whereas Information Technology and Materials companies have more global operations, with domestic revenues representing only 44% and 48% of their revenues, respectively.

This differentiation necessitates the use of sector weight constraints to maintain the proportional representation of sectors broadly in line with The 500, reducing the disproportionate impact of any specific underweighted or overweighted sector.

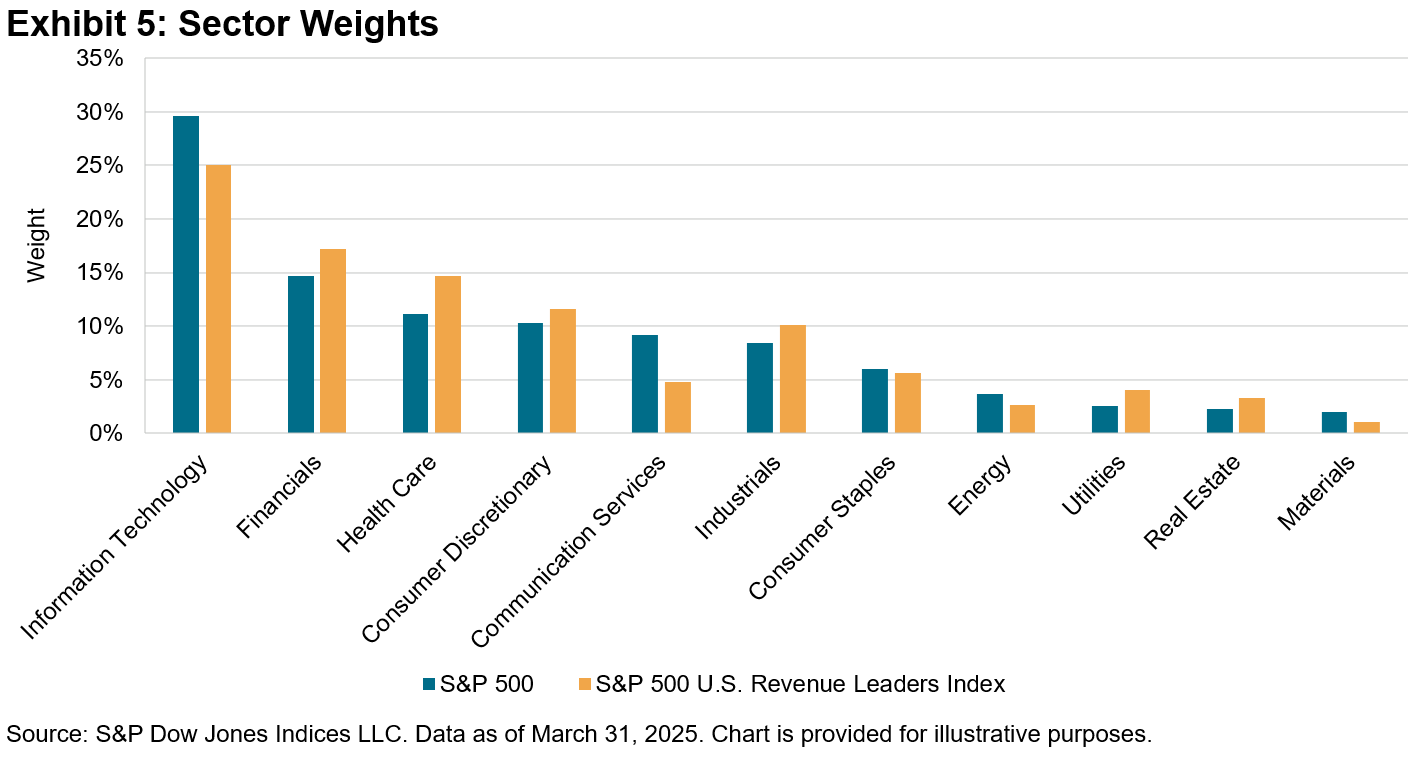
Introducing sector weight constraints allows for a reduction of the active weight difference compared to The 500 and provides a more useful comparison to its benchmark, as well as a more accurate representation of the U.S. economy. By limiting sector weight variations, the index guards against disproportionate influence from any single sector. Comparing the sector weights at the end of March 2025, we observe that Information Technology and Communication Services were underweighted in the S&P 500 U.S. Revenue Leaders Index, whereas Health Care and Financials were more prominently represented (see Exhibit 5).

Conclusion

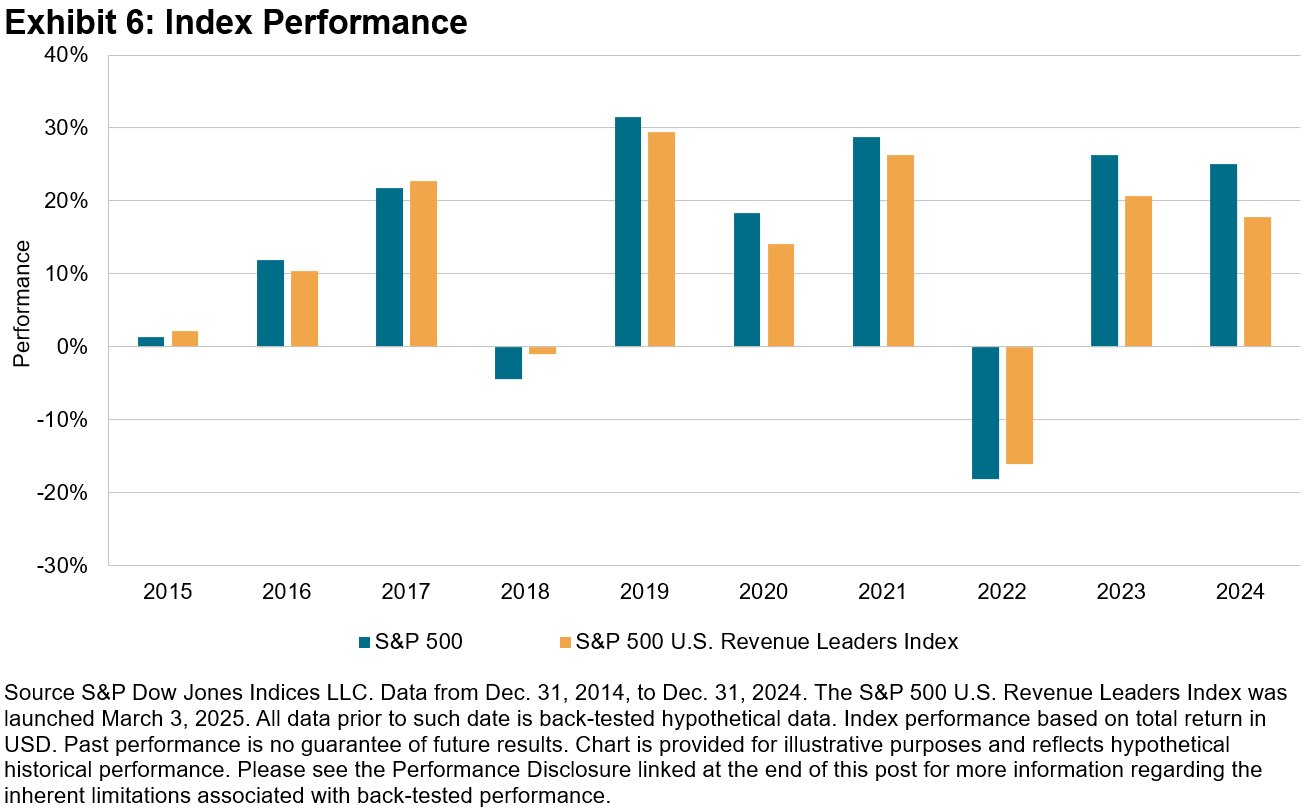
The S&P 500 U.S. Revenue Leaders Index tracks large-cap U.S. companies with at least 50% of their revenue exposure to the U.S. The index focuses on domestic economic activities, catering to those seeking more focused U.S. economic view. By employing sector-specific constraints, the index balances a higher exposure to more domestically focused sectors with maintaining a similar risk and performance profile to the benchmark.

The posts on this blog are opinions, not advice. Please read our Disclaimers.

Above Mexico's Stock Arena

Contributor Image
Maya Beyhan

Global Head of Sustainability, Index Investment Strategy

S&P Dow Jones Indices

Launched in 2021, the S&P/BMV IPC CompMx Trailing Income Equities ESG Tilted Index tracks the performance of constituents in the S&P/BMV IPC CompMx Trailing Income Equities Index, which is designed to measure the performance of large and liquid stocks listed on the BMV that have paid an average dividend greater than zero over the past five years. Constituents of the ESG tilted index must meet sustainability criteria, and the index attempts to improve the overall S&P Global ESG Score of the underlying index by over- or under-weighting components based on their S&P Global ESG Scores.1

Although the index underperformed its underlying benchmark, the S&P/BMV IPC CompMx Trailing Income Equities Index, by a cumulative 7.5% since its launch, it consistently outperformed the S&P/BMV IPC—Mexico’s broad equity benchmark—every calendar year, as demonstrated in Exhibit 2.

Since its launch in August 2021, the S&P/BMV IPC CompMx Trailing Income Equities ESG Tilted Index outperformed the S&P/BMV IPC by 2.5% by the end of 2021. This trend continued in the following years, with the index surpassing the S&P/BMV IPC by 3.6%, 3.4% and 7.8% in 2022, 2023 and 2024, respectively. As of Feb. 28, 2025, its YTD performance matched that of the S&P/BMV IPC, with a gain of 5.1%.

Additionally, the S&P/BMV IPC CompMx Trailing Income Equities ESG Tilted Index obtained an ESG score of 60, surpassing the score of 57 for both its underlying benchmark and the S&P/BMV IPC.

In summary, the S&P/BMV IPC CompMx Trailing Income Equities ESG Tilted Index has presented a blend of annual performance against Mexico’s leading market index, the S&P/BMV IPC, and a higher ESG score. This combination could be useful for those who are weighing both ESG and performance factors in their choices.

For those interested in further examining S&P DJI’s sustainability indices, additional details can be found in the Sustainability Index Dashboard.

1 For more information, see the S&P/BMV Indices Methodology.

The posts on this blog are opinions, not advice. Please read our Disclaimers.

The S&P 500 Futures Quanto USD-BRL Currency Adjusted Index: Measuring Currency Exchange Risk and Interest Rates in Brazil

Contributor Image
Cristopher Anguiano

Associate Director, U.S. Equity Indices

S&P Dow Jones Indices

In order for a Brazilian market participant to track the S&P 500® through equity index futures, they must first convert Brazilian reais to U.S. dollars and then use U.S. dollars to enter a position in equity futures. This transaction involves two sources of risk: equity risk and currency exchange risk.

To address the currency exchange risk faced by Brazilian market participants, S&P Dow Jones Indices launched the S&P 500 Futures Quanto USD-BRL Currency Adjusted Index (S&P 500 Futures Quanto USD-BRL Index) on Nov. 1, 2024. The index provides a measurement of U.S. equities futures for Brazilian market participants. It does this by measuring the performance of the nearest-maturing quarterly E-mini S&P 500 Futures contract trading on the B3 exchange, following a quarterly roll1 schedule.2 Additionally, it integrates a quanto currency adjustment, which settles daily returns in BRL rather than the currency of denomination. This currency adjustment seeks to mitigate currency exchange volatility.

To illustrate the currency risk component, we compared the performance and risk characteristics of the S&P 500 Futures Quanto USD-BRL Index against the S&P 500 Futures Index (B3) (USD), which follows the same futures methodology but without the quanto currency adjustment. Historically, the S&P 500 Futures Quanto USD-BRL Index offered similar cumulative and periodic performance when compared with the unadjusted index (see Exhibit 1).

Moreover, the S&P 500 Futures Index (B3) (USD) had a historically high correlation and a similar risk profile when compared to the underlying index (see Exhibit 2). Since inception, the S&P 500 Futures Quanto USD-BRL Index closely tracked the unadjusted index, having an annualized tracking error of 0.2%.

Furthermore, the quanto adjustment led to outperformance on a total return basis as well. From Jan. 31, 2015, to Feb. 28, 2025, the S&P 500 Futures Quanto USD-BRL Currency Adjusted Index has delivered a cumulative excess total return of 350% relative to the unadjusted index.

This is because futures total return indices incorporate excess return and the interest earned on hypothetical fully collateralized contract positions. Exhibit 3 demonstrates the substantial cumulative impact when incorporating the daily CETIP interbank overnight rate on a fully collateralized3 position to calculate total returns. Historically, the S&P 500 Futures Quanto USD-BRL Currency Adjusted Index earned strong returns on top of the equity index futures return due to an environment where Brazil’s interest rates remain relatively high.

In summary, the S&P 500 Futures Quanto USD-BRL Currency Adjusted Index measures U.S. large-cap equities, and has historically mitigated currency exchange risk, allowing market participants to avoid the impact of BRL/USD fluctuations. Additionally, it has provided additional outperformance due to Brazil’s interest rate environment.

1 Roll refers to the process of closing a position in a futures contract that is nearing its expiration and simultaneously opening a new position in a futures contract with a later expiration date.

2 The roll frequency schedule occurs over a three-day roll period quarterly in March, June, September and December, effective after the close of the third, fourth and fifth business day preceding the last trading date of the futures contract. The index distributes the weights equally each day over a three-day roll period. For more details, please refer to the S&P Futures Indices Methodology.

3 Collateralized refers to a financial arrangement where an asset is pledged as security for a financial obligation, serving as a guarantee.


The posts on this blog are opinions, not advice. Please read our Disclaimers.

The Future of Private Credit

Contributor Image
Greg Vadala

Executive Director, Global Strategic Partnerships

S&P Dow Jones Indices

In recent blogs we examined why private credit has been growing, as well as the potential opportunities and risks associated with the asset class. Now, we turn to the future of this evolving market, examining the trends shaping its growth, the role of institutional investors and how private credit may continue to develop as a mainstream investment strategy.

Scaling and Expanding Private Credit

Private credit could be poised for further expansion as investors seek higher yields and alternative sources of return. To sustain this momentum, private credit firms are refining their strategies, focusing on scalability and diversification. This includes expanding into new geographies and industries, as well as exploring specialized lending approaches like asset-backed lending and opportunistic credit.

Advancements in technology are also playing a role. Data analytics and automation are being integrated into underwriting and risk assessment processes, improving efficiency and allowing firms to manage portfolios more effectively. Additionally, new product structures—such as interval funds and evergreen vehicles—are being explored to attract a broader investor base, offering more flexible access to private credit.

Business Development Companies and Market Evolution

The rise of Business Development Companies (BDCs) has contributed significantly to the growth of private credit in recent years. These investment vehicles provide financing to small- and medium-sized enterprises (SMEs), often through debt or equity investments. Their structure allows investors to gain exposure to private credit without sacrificing the oversight and transparency required by regulators in public markets.

However, since BDCs trade on public exchanges, they can be influenced by broader market fluctuations. This means that while they offer a gateway into private credit, their performance may still be affected by equity market dynamics.

Institutional Investors and Market Maturity

Institutional investors—including pension funds, insurance companies and endowments—are playing an increasingly important role in shaping the private credit market. Their long-term investment horizons and substantial capital commitments may help stabilize the asset class.

As these investors allocate more capital to private credit, they are also driving improvements in governance, transparency and risk management. Their due diligence processes set higher reporting standards, encouraging greater consistency across private credit funds. At the same time, institutional investors are fostering innovation by backing niche strategies and specialized lending platforms, helping to broaden the range of investment opportunities in the space.

As participation from institutional investors continues to grow, the private credit market may benefit from enhanced liquidity, lower volatility and a more structured approach to investment—helping solidify its place as a mainstream asset class.

The Road Ahead for Private Credit

Looking forward, private credit is expected to play an increasingly prominent role in the financial landscape. With banks still facing regulatory constraints that limit lending, private credit is likely to continue to fill financing gaps for businesses—especially in the middle-market segment.

The growing involvement of institutional investors, along with ongoing innovation in product structures and risk management, may contribute to further maturation within the asset class. As a result, private credit may become even more integrated into investment strategies, offering a potential combination of income and diversification.

While challenges remain, including liquidity constraints and market saturation concerns, private credit’s historical performance suggests that it may continue to attract interest. As market participants seek new sources of return in an evolving financial environment, private credit is well-positioned to play an expanding role in the investment landscape in the future.

Learn more in our recent analysis, “The Rapid Rise of Private Credit.”

Learn more about Private Investment Benchmarks

Ask an Expert

This blog was co-authored by Nicholas Godec and Ricky LaBelle.

The posts on this blog are opinions, not advice. Please read our Disclaimers.

Waiting for a Bear

Contributor Image
Tim Edwards

Managing Director, Index Investment Strategy

S&P Dow Jones Indices

The S&P 500® recently entered a “correction,” a term used when the price index falls by more than 10% from its highs. It may yet decline further, the fact of which might tempt market participants to delay equity purchases until, say, the index has declined by 20%—which would define the start of a “bear market.” The potential relative merits of “waiting for a discount,” as examined historically via the nearly seven-decade-long record of the S&P 500, offer an intriguing perspective.

We began with every trading day in The 500™’s history on which the closing index level was not already 20% or more below the prior all-time high. For such days, we then measured how long it was before a 20% decline first occurred and what the overall change in the index level was over that period. Exhibit 1 shows the length of time in years of such waiting periods, historically.

The average waiting time was 3.0 years, while among the smaller sample of days when the index was already 10% or more down from a high (but not yet 20% down), the wait for a bear market was almost as long—equal to 2.1 years.

Sometimes, the index rose more than enough to offset the subsequent decline. At the historical extreme: from Nov. 29, 1988, it was over 12 years until the next bear market began, by which time the index had risen a cumulative 336% (including the final decline). Exhibit 2 shows the change in the index level during the waiting period associated with each starting point in history, and Exhibit 3 shows the accompanying distribution of those index changes, ignoring zero values.

Most of the time, waiting meant a slightly lower index level—the median index change was a decline of 1.7%. However, some of the time, the index change was highly positive, which led to an average index change equal to a 30.0% increase. Restricting to the days when the index was down 10% or more, but not yet 20% down, the average index change during the wait was, again, almost as material, equal to a 22% increase.

Exhibit 4 shows equivalent statistics using declines of 1%, 2%, 5%, 10%, as well as the original 20%. The sample size of “start points” get smaller down the table, as the proportion of days when the index was already in such a decline increases.

Overall, the pattern was similar for smaller declines: the median index change during the wait for a discount was a small decrease, but the average index change was positive, and the maximum index change was much higher. In other words, most of the time, waiting resulted in a small discount. But some of the time, waiting meant missing out on large gains.

The well-known money manager Peter Lynch once quipped that “Far more money has been lost by investors preparing for corrections, or trying to anticipate corrections, than has been lost in corrections themselves.” That may be true. As to whether the current S&P 500 downturn represents a buying opportunity, of course, only time will tell.

The posts on this blog are opinions, not advice. Please read our Disclaimers.