


Discover why the S&P 500 is widely regarded as the best single gauge of U.S. large-cap equities and the world’s most-tracked index by AUM.
The posts on this blog are opinions, not advice. Please read our Disclaimers.The 500™: A Brief Look at an Index Icon
Fixed Maturity in Focus: iBoxx Liquid EUR High Yield and iBoxx EUR Sovereigns
The Market Measure: February 2025
Beyond Large Caps: Exploring the S&P MidCap 400 and S&P SmallCap 600
Carbon Countdown
The 500™: A Brief Look at an Index Icon
- Categories S&P 500 & DJIA
- Tags core, Large-cap U.S. equities, S&P 500, The 500, U.S. Equities, US FA
Fixed Maturity in Focus: iBoxx Liquid EUR High Yield and iBoxx EUR Sovereigns

The author would like to thank Florian Guth for his contributions to this blog.
As fixed income indexing solutions continue to evolve and innovate, one particular area of focus has been fixed maturity indices. Fixed maturity indices have existed in the U.S. for over 10 years, where adoption and growth continue to be strong. However, the market in Europe is newer, with fixed maturity constructs taking shape only over the last 18 months. While the European market remains in its early stages, adoption has accelerated, with total assets in Fixed Maturity ETFs exceeding USD 7 billion1 since the first launch in 2023.
S&P DJI is excited to announce the launch of two new fixed maturity indices:
- The iBoxx EUR Liquid High Yield 2027 3-Year Rolling
- High Yield: This is the first fixed maturity index focusing on European high yield credit in the marketplace, offering a measurement of one of the higher yielding areas of European fixed income, in a fixed maturity construct.
- Liquidity: This index draws from the well-established iBoxx EUR Liquid High Yield Index family, with selection criteria that focus more on liquidity of the bonds than its broader benchmark.
- Rolling Maturity: This fixed maturity index has an innovative feature that is also new to the market in that it continues to roll into a subsequent three-year index, as opposed to expiring the way traditional fixed maturity indices do.
- The iBoxx Sovereigns Italy & Spain Fixed Maturity 2029 Index: Has unique exposure within sovereigns, combining two countries that have historically had higher yields relative to the broader European sovereign benchmark.
As fixed maturity solutions expand across Europe, we take a closer look at the construction and utilization of fixed maturity indices, and how these two new indices offer innovation in construction and exposure.
What is a Fixed Maturity Index? How Does it Differ from a Broad Fixed Income Index?
A fixed maturity index measures bonds that expire within the same maturity year, often mentioned in the name of the index. If the final year of the fixed maturity index is 2030, the index would typically include bonds that mature in 2030. During the final year of the index, 2030, maturing bond proceeds would be invested into money market instruments. By the end of the year, the index would have converted to an index of money market instruments and would then typically expire. The “maturing” nature of a fixed maturity index is a key feature that differentiates it from a broad fixed income index, which typically remain in perpetuity.
Why is it Interesting That a Fixed Income Index “Matures”? How Are Fixed Maturity Indices Used?
The index maturing creates a similar profile to that of a maturing bond. As such, market participants could use fixed income indices in a similar way they use individual bonds with known expiration dates. This can be useful for managing duration and cash flows, or for building bond ladders with a series of maturing years. However, unlike individual bonds, bond indices may provide diversification benefits in that they represent a collection of bonds and may minimize transaction costs as individual bonds may be difficult to access.
How Is the iBoxx EUR Liquid High Yield 2027 3-Year Rolling Different? How Is It the Same?
The iBoxx EUR Liquid High Yield 2027 3-Year Rolling includes bonds with expirations from the same maturity year, from Oct. 1, 2026, to Sept. 30, 2027. This allows for the index to be used in the same manner as any fixed maturity index, whether to manage duration or cash flow needs. Throughout the final months of the maturity year of the index, bond proceeds are moved into an iBoxx EUR T-Bill Index.
After the final year, rather than expiring, the iBoxx EUR Liquid High Yield 2027 3-Year Rolling rolls into another three-year maturity index, putting weight back into high yield bonds with a three-year fixed maturity, extending the index to Sept. 30, 2030. The index continues to roll in three-year increments.
The rolling nature of this index is a unique feature in the fixed maturity market, providing the ability to roll into the next three-year maturity index, without having to experience the expiration of the index or having to reinvest proceeds.
The “Liquid” in the iBoxx EUR Liquid High Yield 2027 3-Year Rolling
The iBoxx EUR Liquid High Yield 2027 3-Year Rolling not only brings a EUR high yield credit option to the market but also does so in a liquidity enhanced way. Drawing upon the well-established iBoxx EUR Liquid High Yield index series, this index deploys the same criteria and methodology in measuring the liquid subset of the broad EUR high yield bond market. The index rules have been designed to offer a broad market coverage with an emphasis on liquidity to be suitable for OTC and exchange-traded derivatives, as well as ETFs. Higher minimum notional amounts and longer time to maturities are some requirements for the index constituents that aim to enhance liquidity in the index. This fixed maturity index takes a one-year maturity slice of the broader liquid EUR high yield index.
How Is the iBoxx Sovereigns Italy & Spain Fixed Maturity 2029 Index Unique versus the Rest of the Market?
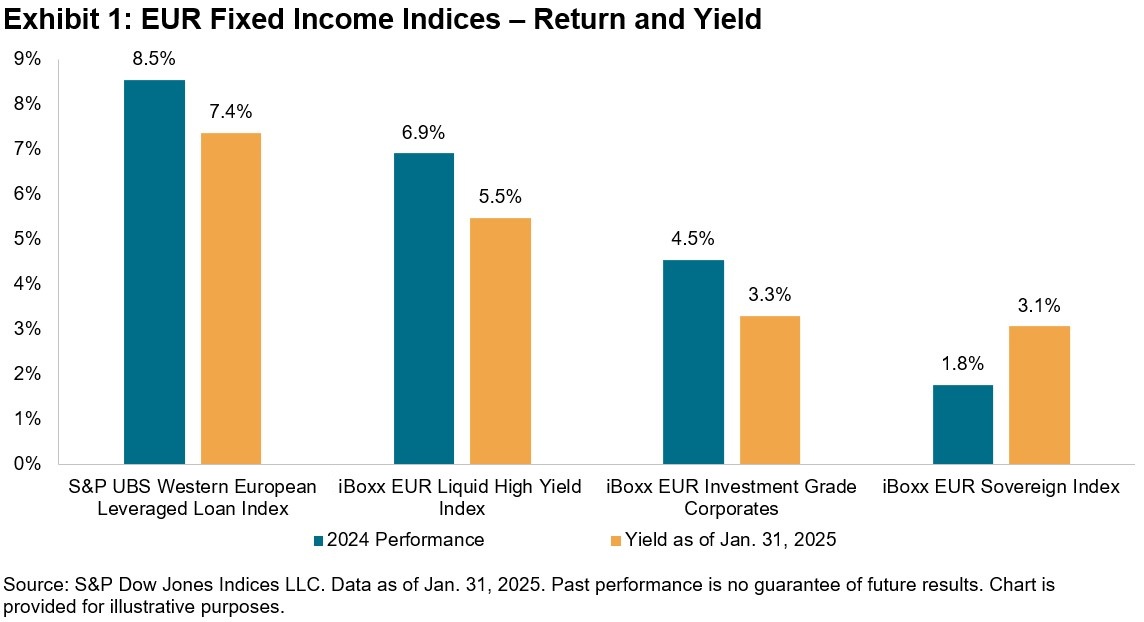
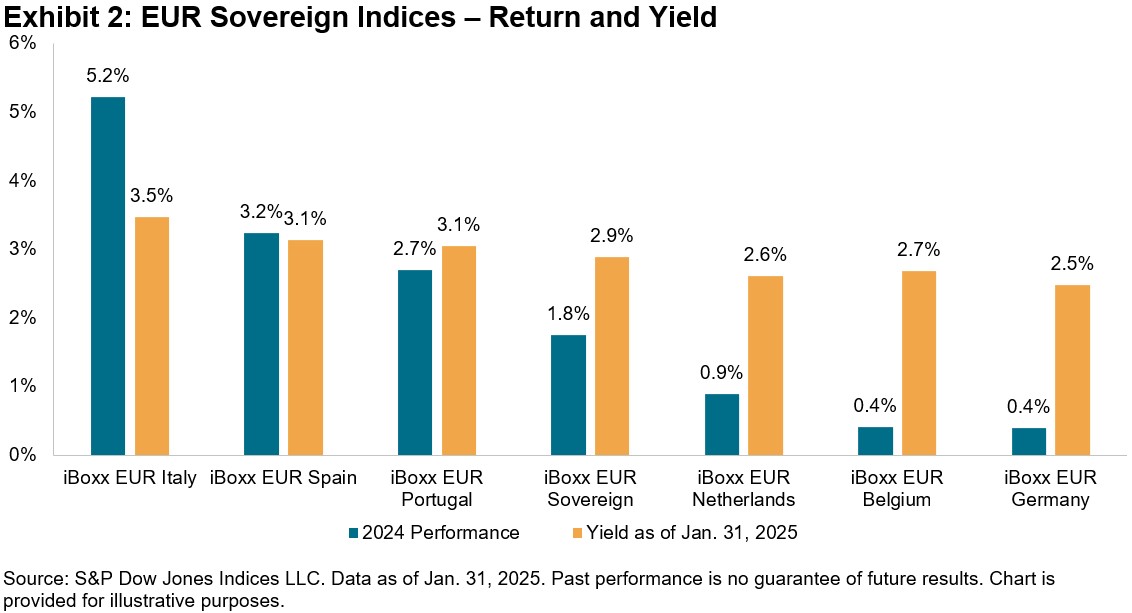
The iBoxx Sovereigns Italy & Spain Fixed Maturity 2029 Index draws from the broader iBoxx EUR index series and includes sovereign debt issued by Spain and Italy with an expiration between Oct. 1, 2028, and Sept. 30, 2029. There is currently no other fixed maturity index that has this combination of sovereign countries. Historically, these two issuers have represented the higher-yielding end of the European sovereign debt spectrum. Both issuers generated higher returns among other Eurozone issuers in 2024.
We expect to see continued expansion in fixed maturity indexing solutions across Europe and other geographies, and S&P DJI is excited to be bringing these two innovative indices to market, offering investors greater insight into fixed income.
1 Source: S&P Dow Jones Indices LLC. Data as of Jan. 31, 2025.
The posts on this blog are opinions, not advice. Please read our Disclaimers.The Market Measure: February 2025
Which sectors are driving market performance, and could dispersion levels signal potential opportunities? Explore global markets, sectors, and yields across the dividend spectrum.
The posts on this blog are opinions, not advice. Please read our Disclaimers.Beyond Large Caps: Exploring the S&P MidCap 400 and S&P SmallCap 600

The S&P Composite 1500® serves as a benchmark for the U.S. equity market, aggregating the performance of large caps, mid caps and small caps. While the S&P 500® has global relevance, there is a universe beyond the S&P 500 that market participants sometimes overlook. The mid- and small-cap segments, as measured by the S&P MidCap 400® and S&P SmallCap 600®, offer distinct views in terms of exposure, sensitivity, diversification and return drivers.
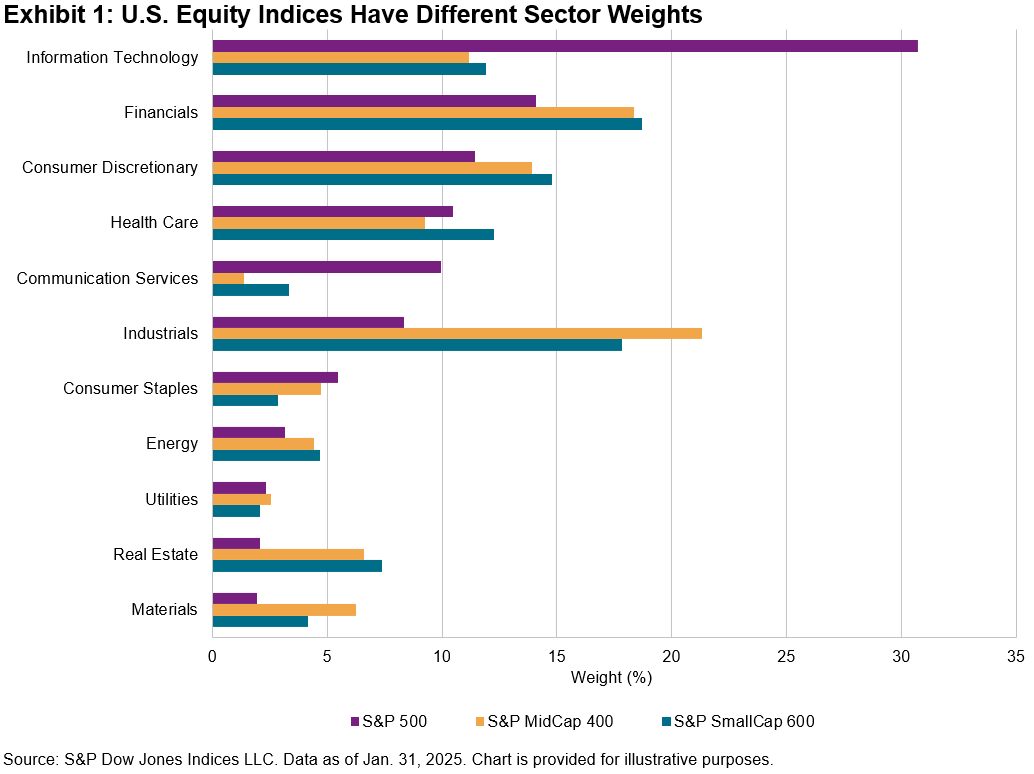
Compared to The 500™, the S&P 400® and S&P 600® indices have different sector weights. As of Jan. 31, 2025, they were primarily underweight in Information Technology and Communication Services, while having greater weight in Industrials, Financials, Real Estate and Materials. Although weights vary across the size spectrum, the mid- and small-cap segments had higher weight in domestically focused sectors.
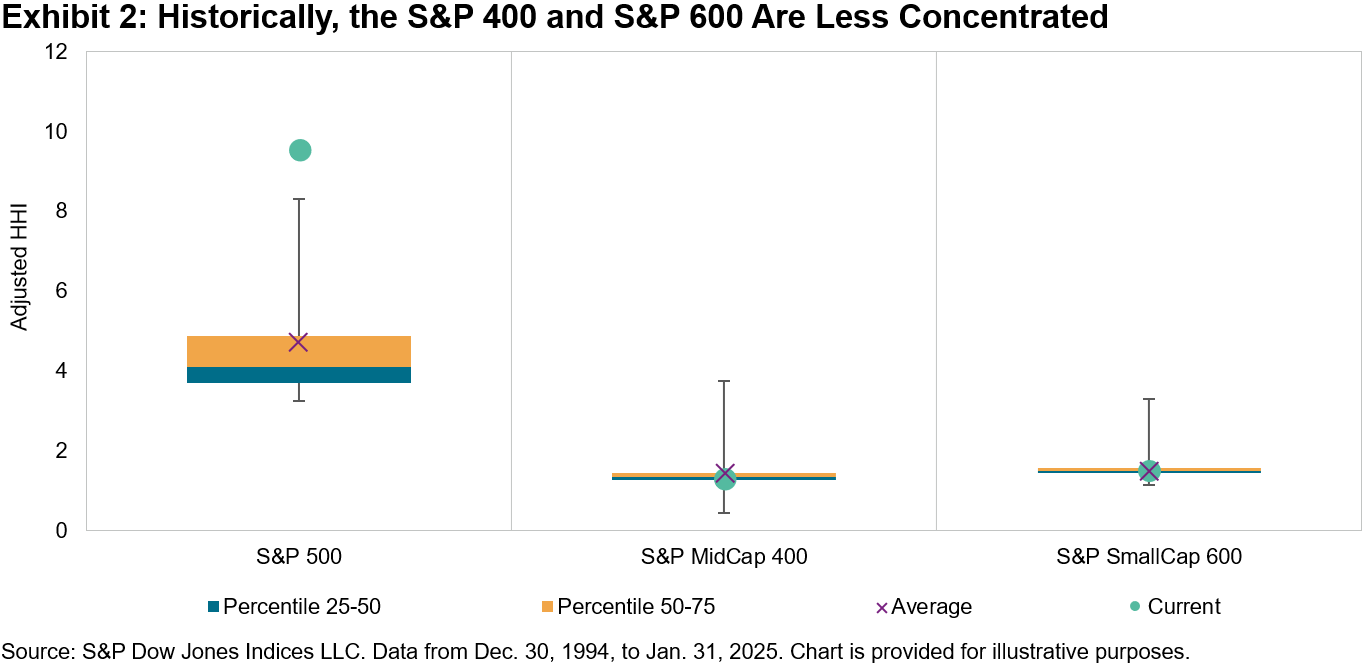
Additionally, the mid- and small-cap segments tend to be more diversified than their large-cap counterpart, which could be relevant for market participants looking to diversify away from large names. Using the adjusted HHI1 to measure concentration, Exhibit 2 shows that the S&P 400 and S&P 600 were less concentrated than The 500.
Moving down the size spectrum presents both opportunities and challenges, resulting in different risk/return profiles. As shown in Exhibit 3, the S&P 400 and S&P 600 outperformed the S&P 500 over various periods but, not surprisingly, exhibited more volatility.
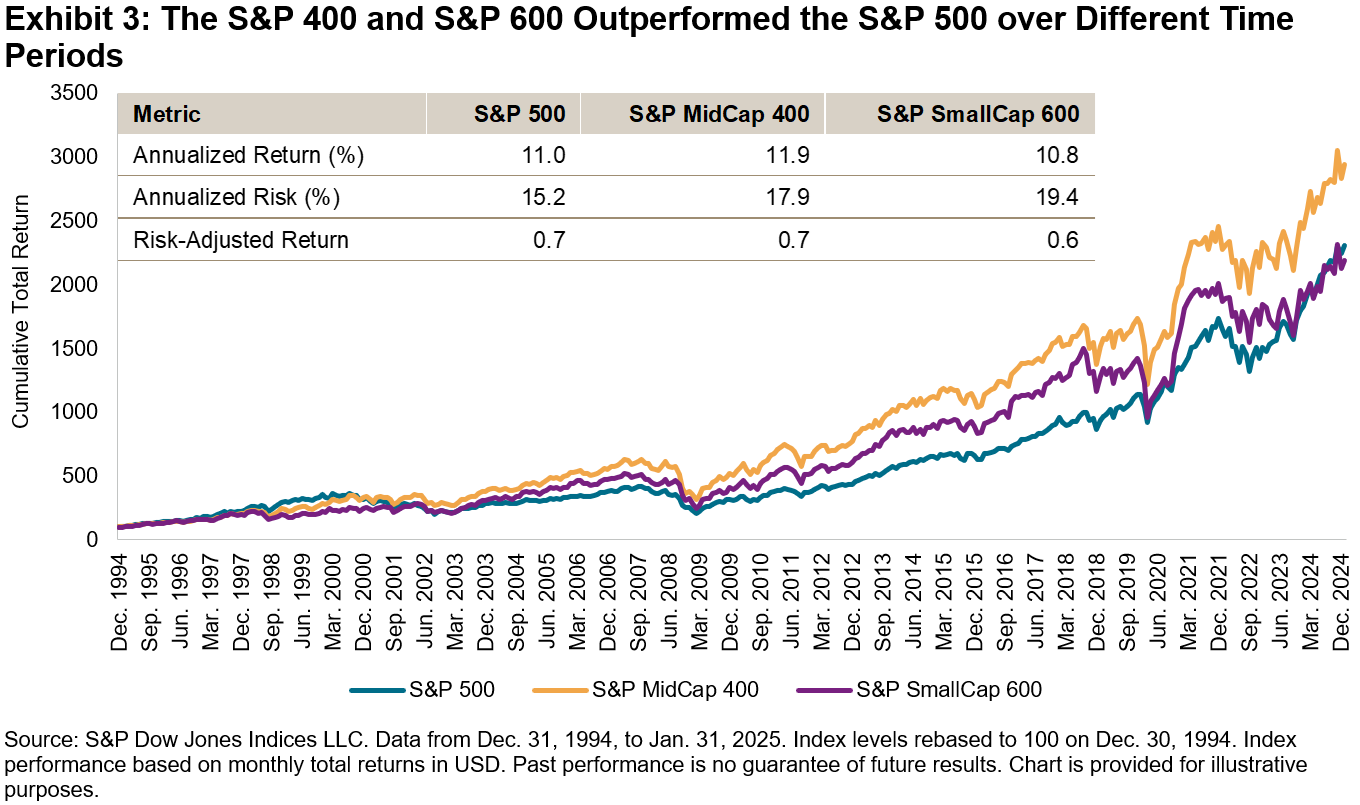
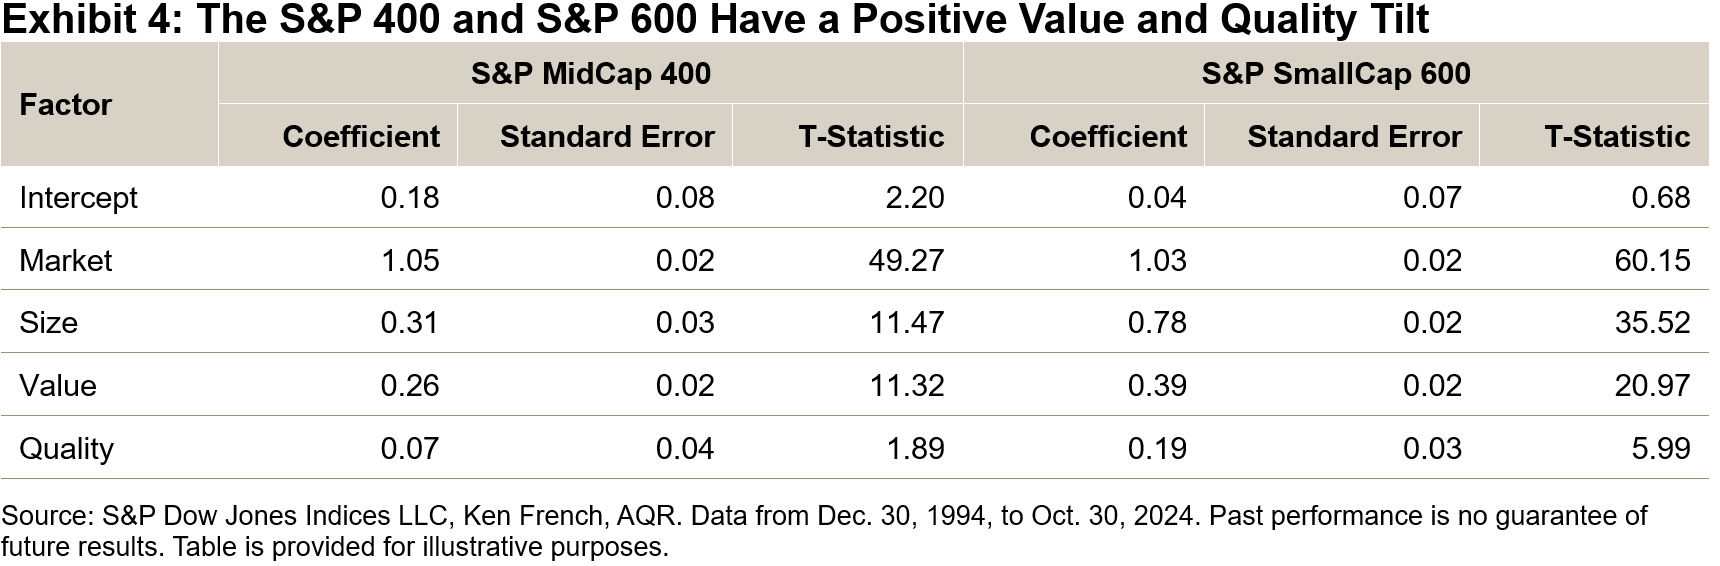
The S&P Composite 1500 is constructed with an earnings screen that requires consistent profitability for its new constituents. Therefore, in addition to the size tilt, the indices also have a positive tilt toward quality. Moreover, the S&P 400 and S&P 600 also tend to have a significant tilt toward value.
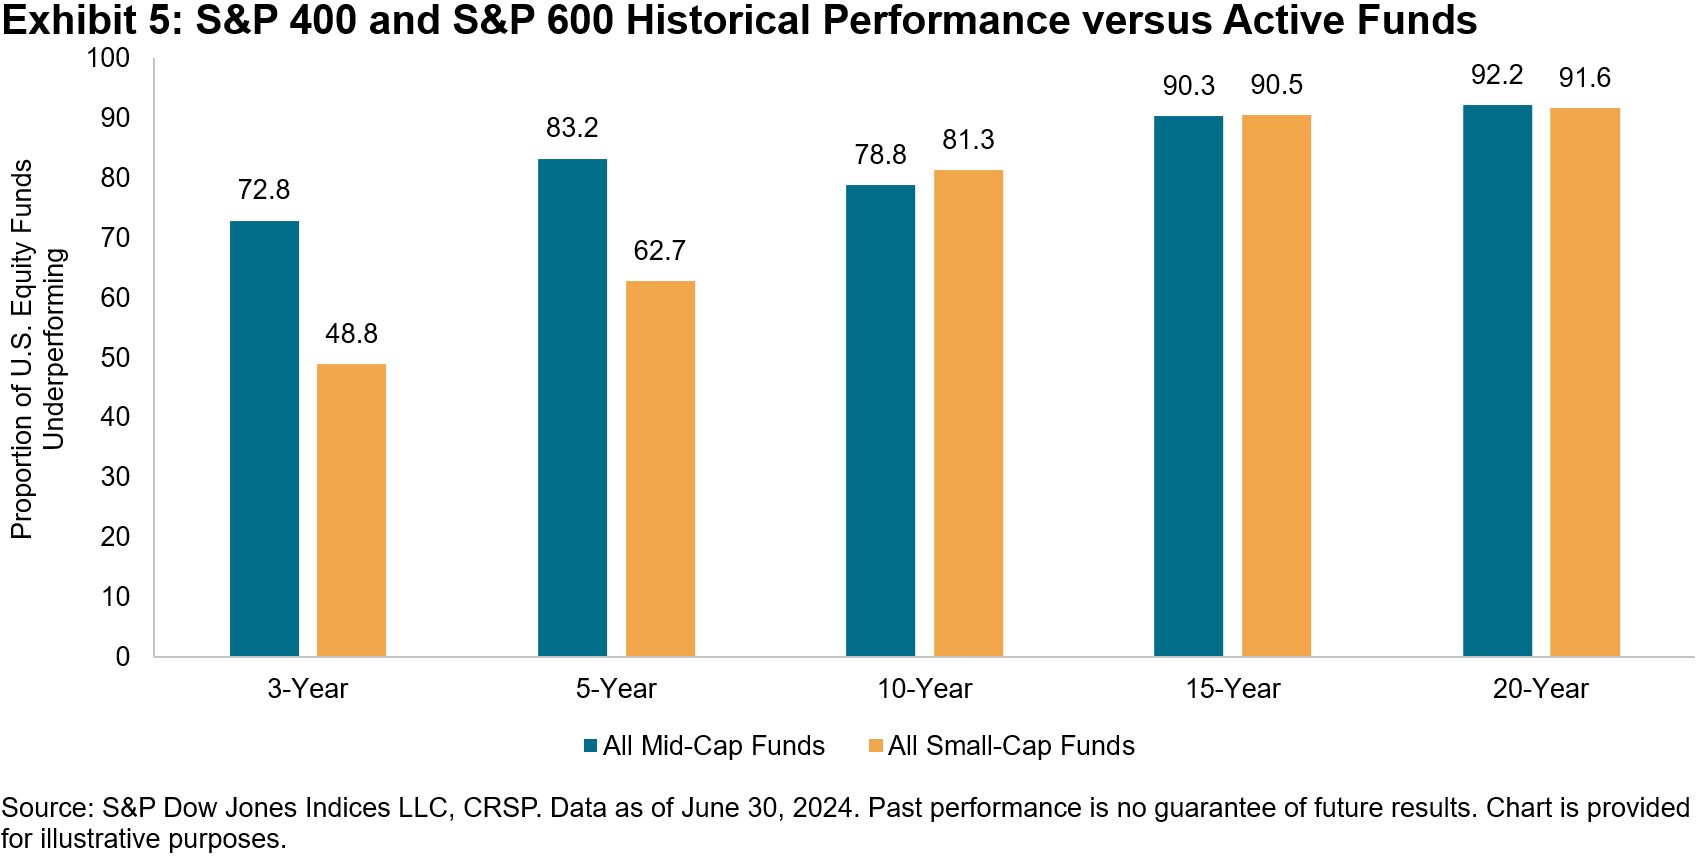
Considering indexing beyond large caps, Exhibit 5 presents data from our SPIVA Scorecards in the mid- and small-cap segments, demonstrating that active managers have found it challenging to outperform the S&P 400 and S&P 600. In fact, the percentage of underperforming funds increased to over 90% for longer time periods.
The S&P 500 is a staple in the U.S. equity market, but the S&P 400 and S&P 600 may offer interesting and distinct characteristics: diversification from mega-cap companies, tilts toward more domestically focused sectors and a reflection of high-growth prospect companies. In addition to these drivers, the indices have historically shown quality and value tilts. Furthermore, most active managers underperformed the indices over different time periods, providing evidence that a low cost, index-based approach can offer outperformance in the mid- and small-cap segments.
1The Herfindahl-Hirschman Index (HHI) is a widely used metric for measuring concentration, determined as the sum of the squared percentage weights of the index constituents. The adjusted HHI is calculated by dividing the index HHI by the HHI of an equally weighted portfolio with the same number of stocks.
For more information, see “Concentration within Sectors and Its Implications for Equal Weighting”, S&P Dow Jones Indices.
The posts on this blog are opinions, not advice. Please read our Disclaimers.
Carbon Countdown

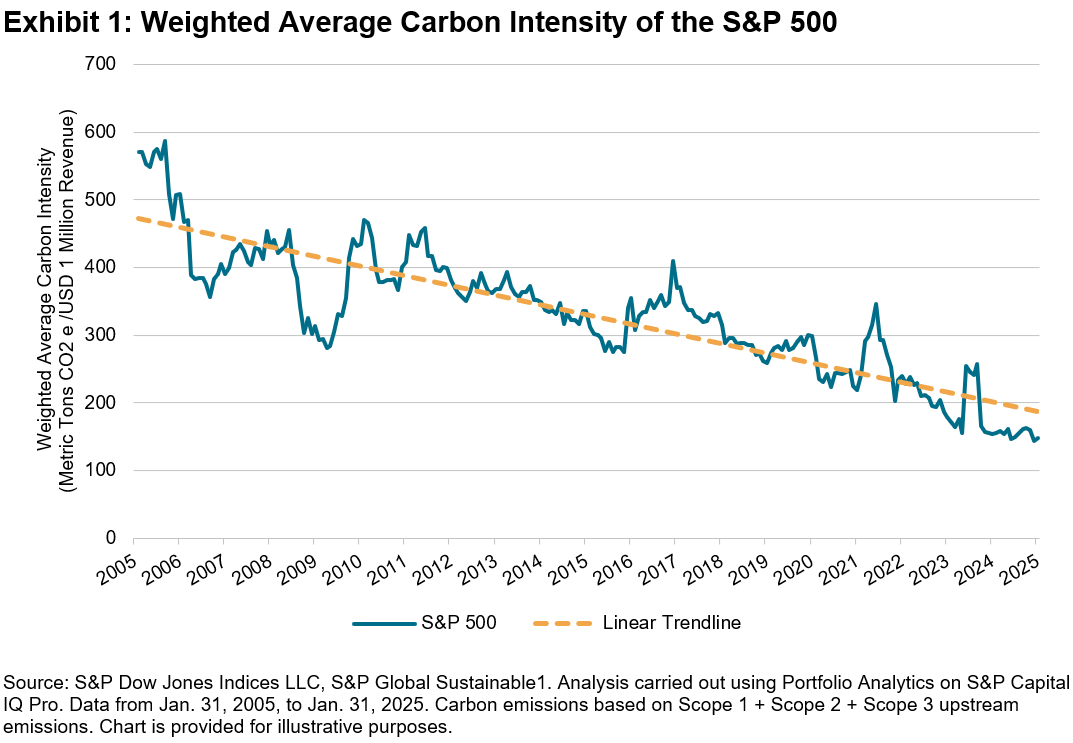
The energy transition represents a crucial market force with the potential to revolutionize our world. Over the two decades from Jan. 31, 2005, to Jan. 31, 2025, the S&P 500® demonstrated a significant decarbonization, evidenced by a 73.9% decrease in its weighted average carbon intensity, as illustrated in Exhibit 1.1 This material decrease highlights a shift in dynamics among The 500™’s constituents.
Central to this decarbonization is the growing adoption of renewable energy sources alongside a reduction in the use of fossil fuels. By utilizing S&P Global Trucost’s Environmental data suite, we analyzed the energy consumption of S&P 500 constituents based on energy source, tracking changes in this energy mix over the past decade.1 The findings of this analysis are summarized in Exhibit 2, which outlines the significant shifts in energy consumption patterns observed in recent years. Over the past decade, the role of renewables—consisting of hydroelectric, biomass and other renewables components—in the S&P 500’s energy mix has more than doubled, jumping from 95.7k GWh to 200.6k GWh.
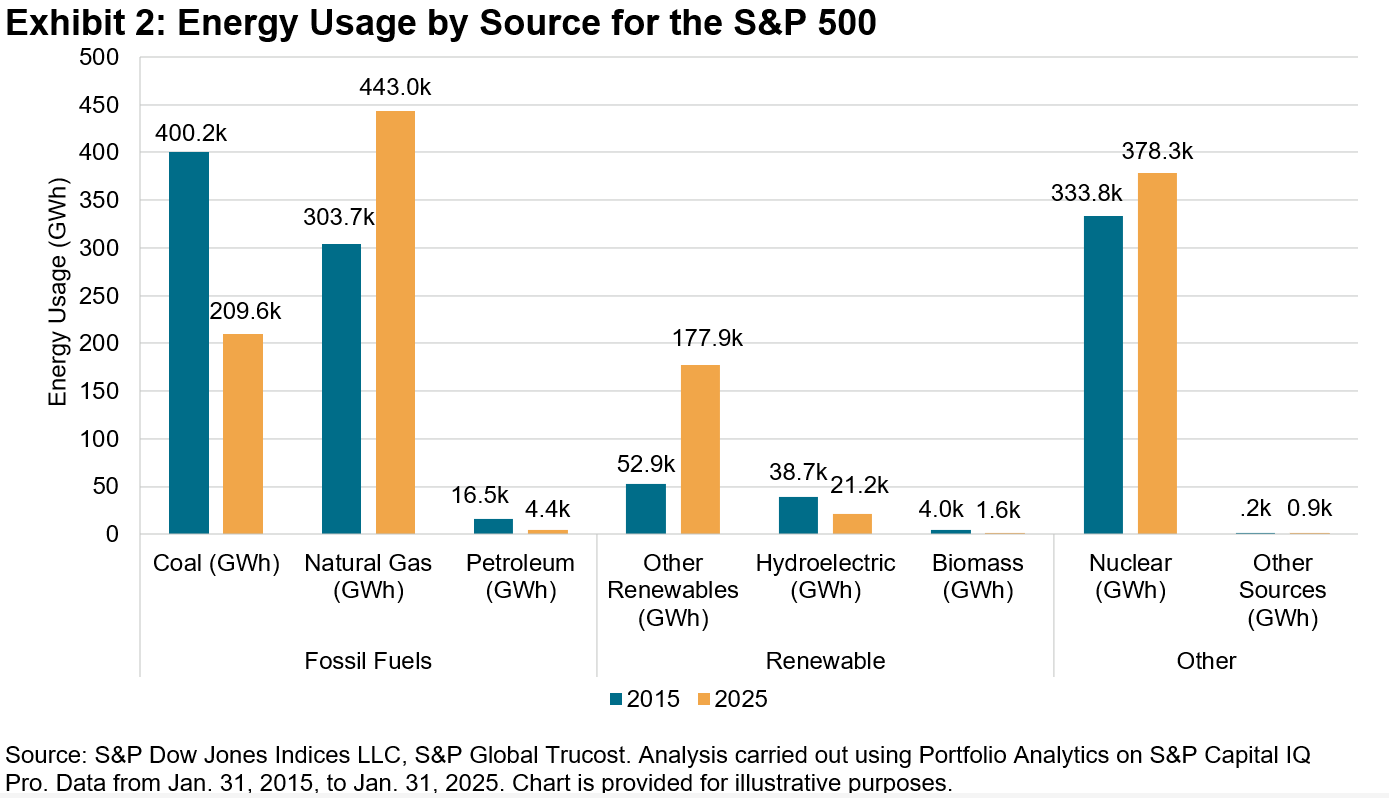
In contrast to the growth in renewables, the consumption of fossil fuel-based energy—consisting of coal, petroleum and natural gas—has declined by 8.8% within The 500, with petroleum usage nearly reduced to a quarter of its previous level, dropping from 16.5k GWh to 4.4k GWh (see Exhibit 2). This transition toward cleaner energy may be indicative of a market that is adapting to new economic conditions and embracing innovation.
In summary, the energy transition appears to be affecting S&P 500 constituents, and this serves as an indicator of how decarbonization is reshaping market dynamics. The insights derived from observing the The 500 during this transformative phase underscore the path the world is on as the energy landscape continues to evolve. For those interested in further examining the carbon metrics and fossil fuel reserves associated with S&P DJI’s indices, additional details can be found in the Sustainability Index Dashboard.
1 Analysis carried out using Portfolio Analytics on S&P Capital IQ Pro.
The posts on this blog are opinions, not advice. Please read our Disclaimers.