The S&P High Yield Dividend Aristocrats® (S&P HYDA) includes large-, mid- and small-cap companies in the U.S. that have consistently raised their dividends for at least 20 consecutive years. This blog will examine the recent rebalance of the S&P HYDA, detailing the changes in its constituents and their distribution by size and sector. Additionally, we will highlight the dividend increase history of these constituents.
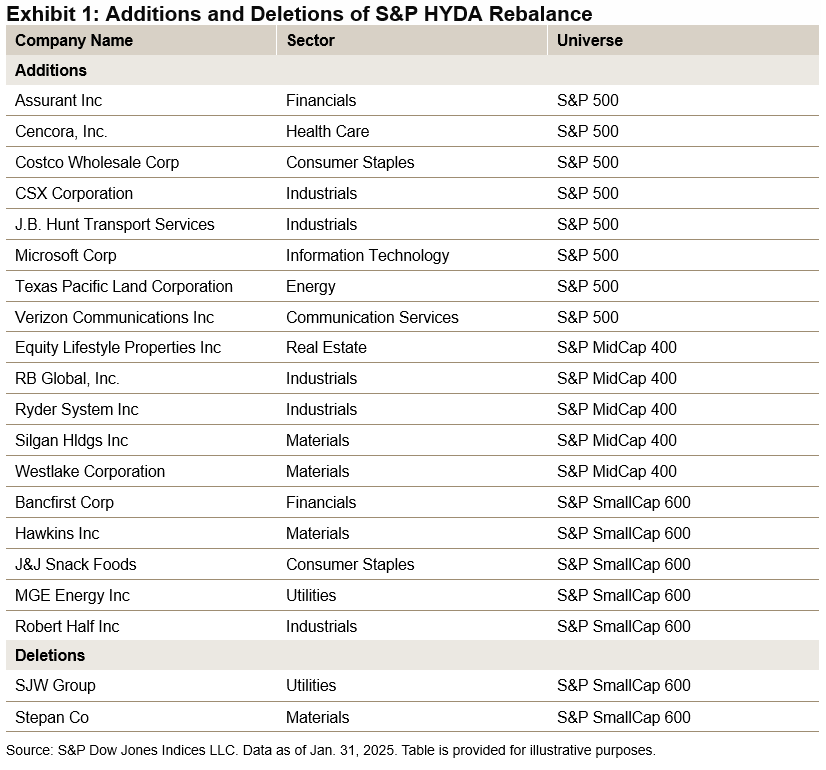
The index recently completed its annual reconstitution on Jan. 31, 2025, welcoming 18 new members into this distinguished group (see Exhibit 1). Following the inclusion of these new members and accounting for two dropouts, the index’s total constituent count has risen from 133 to 149, enhancing its overall diversification and liquidity.
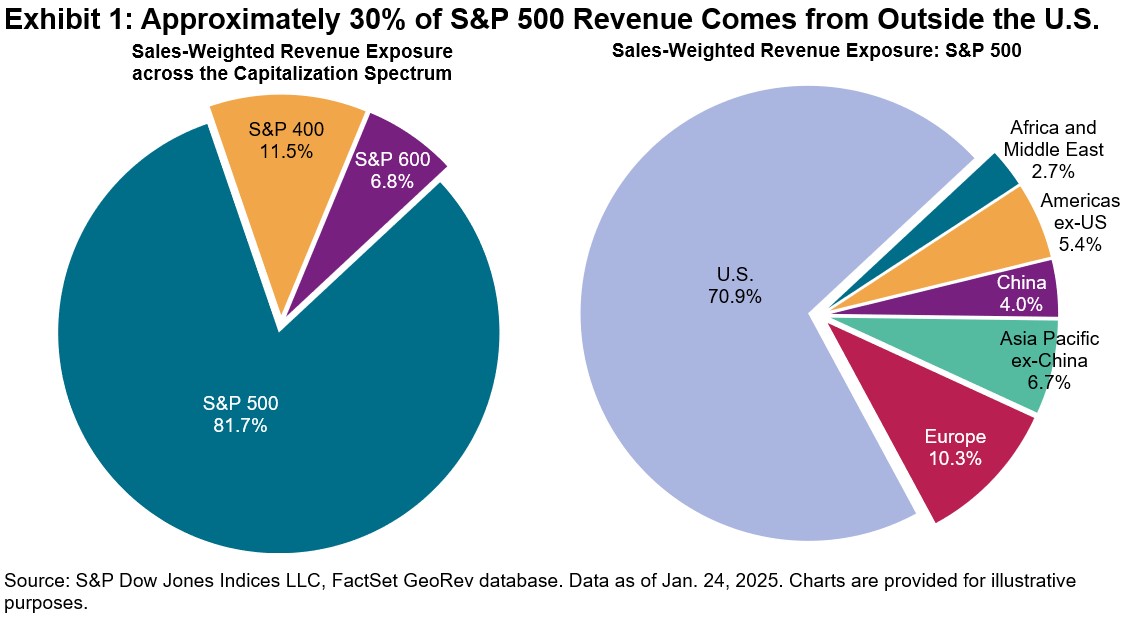
Market-Cap Breakdown
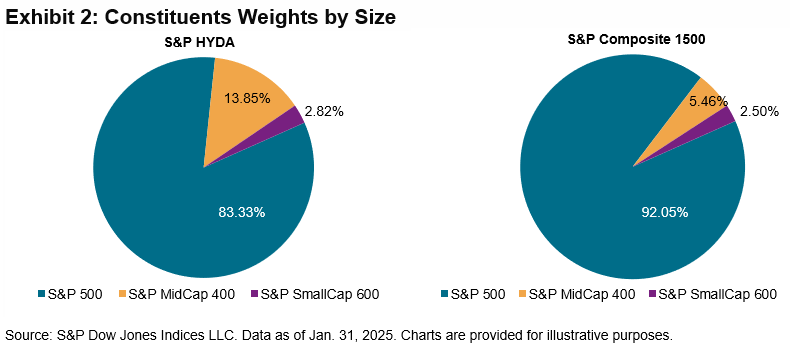
Among the 149 constituents of the S&P HYDA as of the latest rebalance, 96 stocks are sourced from the S&P 500®, 38 from the S&P MidCap 400® and 15 from the S&P SmallCap 600®. In terms of constituent weights, S&P HYDA has a higher weight in the mid-cap and small-cap segments compared to the S&P Composite 1500®, as illustrated in Exhibit 2.
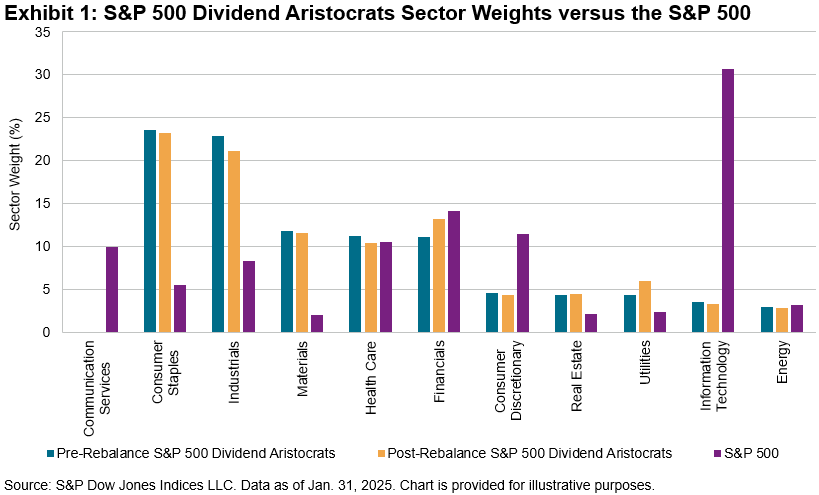
Sector Breakdown
With 149 constituents, the S&P HYDA currently includes representatives from all 11 GICS® sectors: 34 constituents from Industrials, 24 from Financials, 22 from Utilities, 21 from Consumer Staples, 16 from Materials and 32 from the remaining 6 sectors.
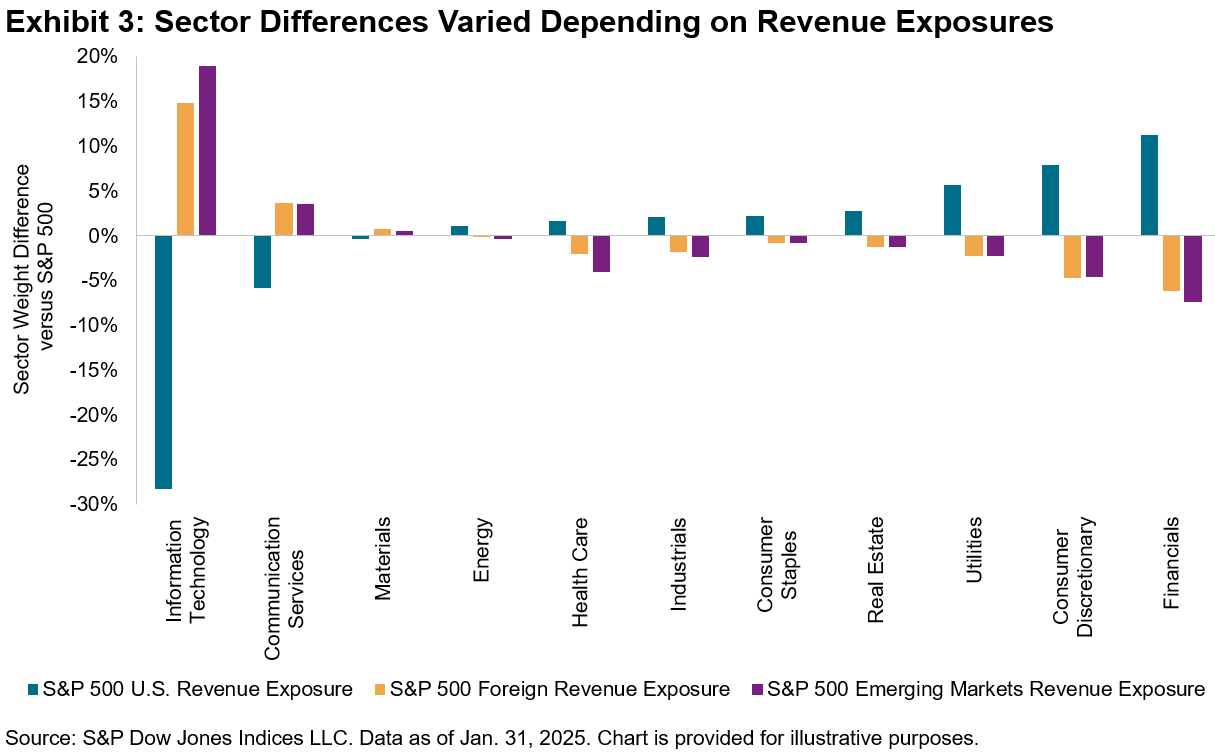
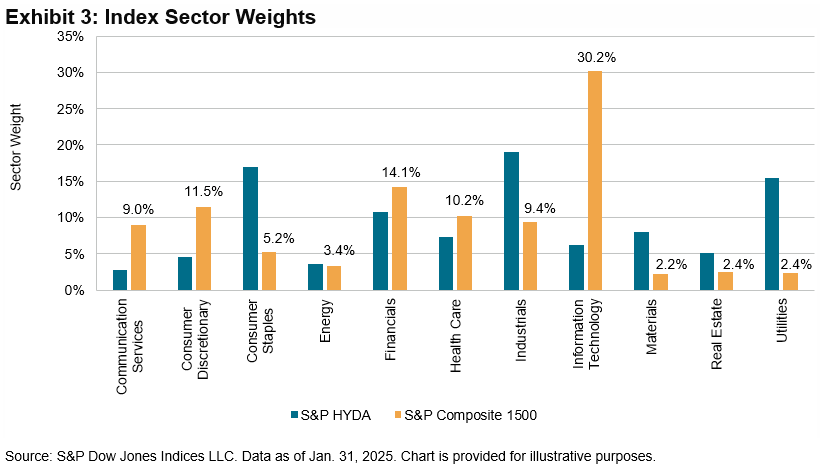
As shown in Exhibit 3, the S&P HYDA significantly underweights the Information Technology (-24.0%), Consumer Discretionary (-6.8%) and Communications Services (-6.2%) sectors. Conversely, the index demonstrates a substantial overweight in Utilities (13.1%), Consumer Staples (11.7%) and Industrials (9.6%).
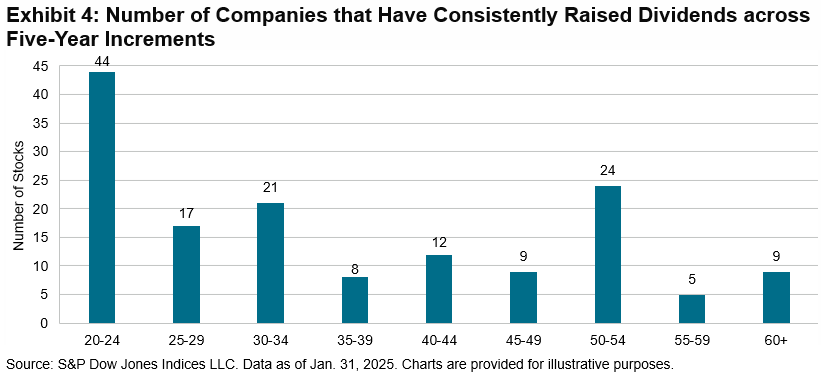
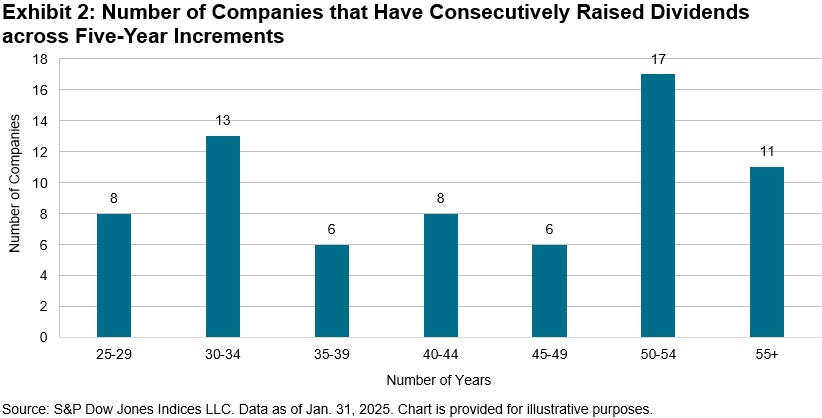
A Long History of Dividend Growth
Exhibit 4 summarizes the number of constituents that have increased their dividends in five-year increments. Approximately 30% of constituents have raised their dividends for 20 to 24 years, while 39% have done so for 25 to 44 years or longer. Additionally, 32% of constituents have achieved this for 45 years or more. These track records illustrate these companies’ historically consistent ability and willingness to return increasing amounts of capital over multiple decades.