Get Indexology® Blog updates via email.

In This List

Uncovering Companies' Climate Resilience

Do Active Funds Outperform in Less-Efficient Markets?

Analyzing the Historical Performance of the S&P Quality FCF Aristocrats Indices across Macroeconomic Environments

Introducing the S&P Commodity Risk Premia Diversifier TCA Index

2024 Open Interest Increase in iBoxx-Linked Futures

Uncovering Companies' Climate Resilience

Contributor Image
Barbara Velado

Former Associate Director, Global Equity Indices

S&P Dow Jones Indices

Climate resilience refers to the ability of a system to anticipate, prepare for and respond to the impacts of climate change.1 As the world grapples with the adverse effects of a changing climate, climate resilience stands front and center in collective efforts from governments, corporations and the investment community2 alike. This blog is the first of a two-part series exploring a forward-looking framework to assess companies’ climate action across different dimensions. Our next blog will examine how this framework can be used to create index strategies in a rules-based, transparent way.

Measuring Companies’ Readiness for the Transition to a Low Carbon Economy

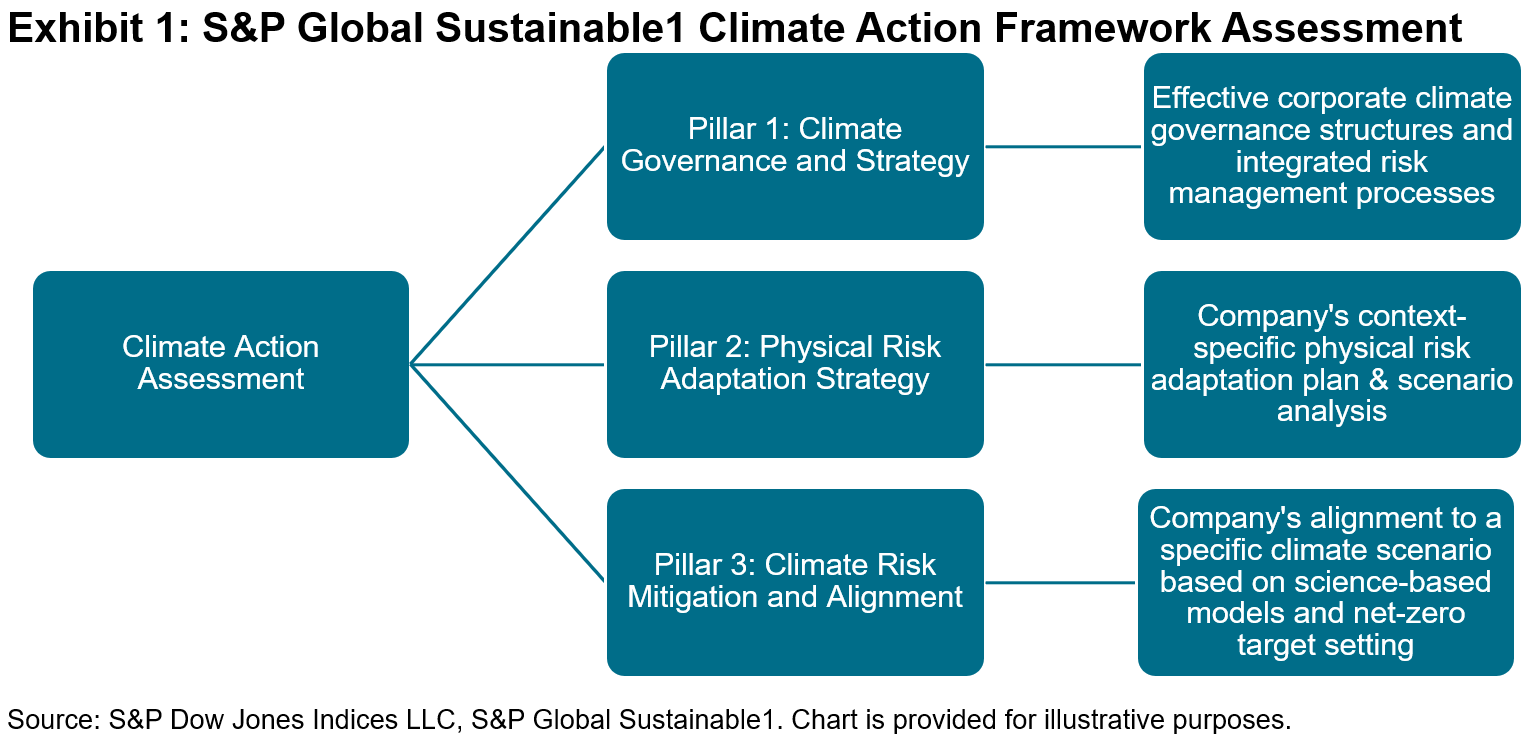
The S&P Global Sustainable1 Climate Action Framework is an innovative dataset that assesses companies’ ability to manage the risks of transitioning to a low-carbon economy through the lens of three key dimensions:

  • Climate Governance and Strategy;
  • Physical Risk Adaptation Strategy; and
  • Climate Risk Mitigation and Alignment.

The assessment leverages raw data collected from S&P Global’s Corporate Sustainability Assessment (CSA), which underpins the S&P Global ESG Scores. Additionally, it integrates established metrics such as implied temperature rise, revenue exposure from business activities and various environmental indicators to provide a comprehensive evaluation of a company’s risk management capabilities, adaptability to physical risks and strategies for mitigating future climate challenges.

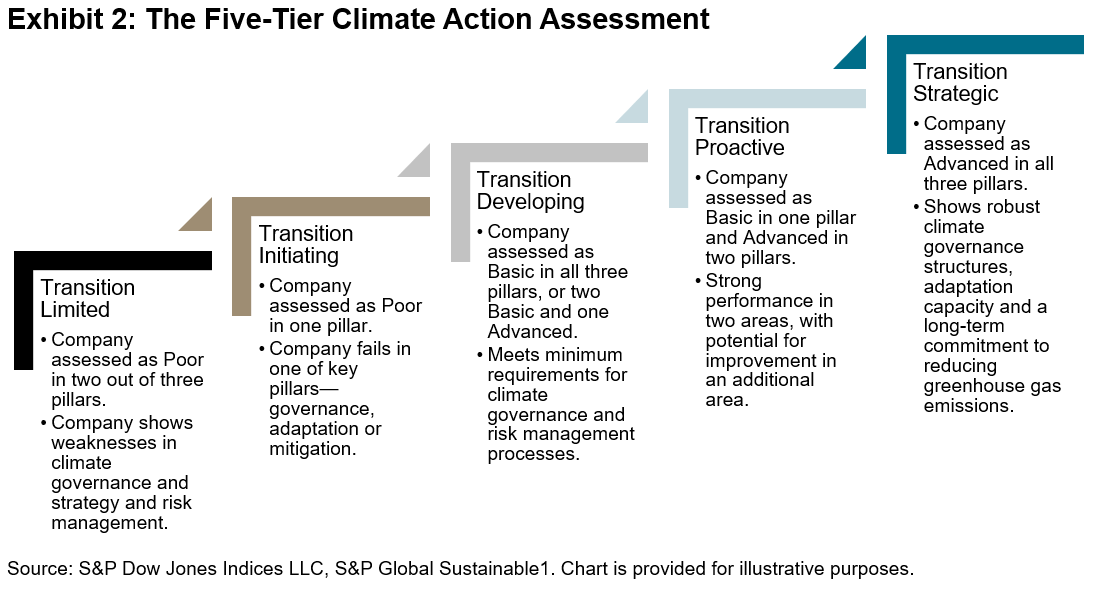
The framework categorizes companies’ performance across each of the three key pillars, as well as on an aggregate-level assessment. Companies can be classified as having “Advanced,” “Basic” or “Poor” performance across the pillars. Combined, these classifications result in a five-tier aggregate assessment (see Exhibit 2) ranging from “Transition Limited,” where companies lack basic governance structures, climate risk management processes and target-setting, to “Transition Strategic,” in which companies demonstrate robust climate strategies, comprehensive risk management plans and a long-term commitment to achieve net zero emissions.

We examined the sectoral breakdown of each of the pillars and the final Climate Action Framework assessment within the S&P World Index (see Exhibit 3). Across sectors, we see a wide distribution of outcomes for each of the categories.

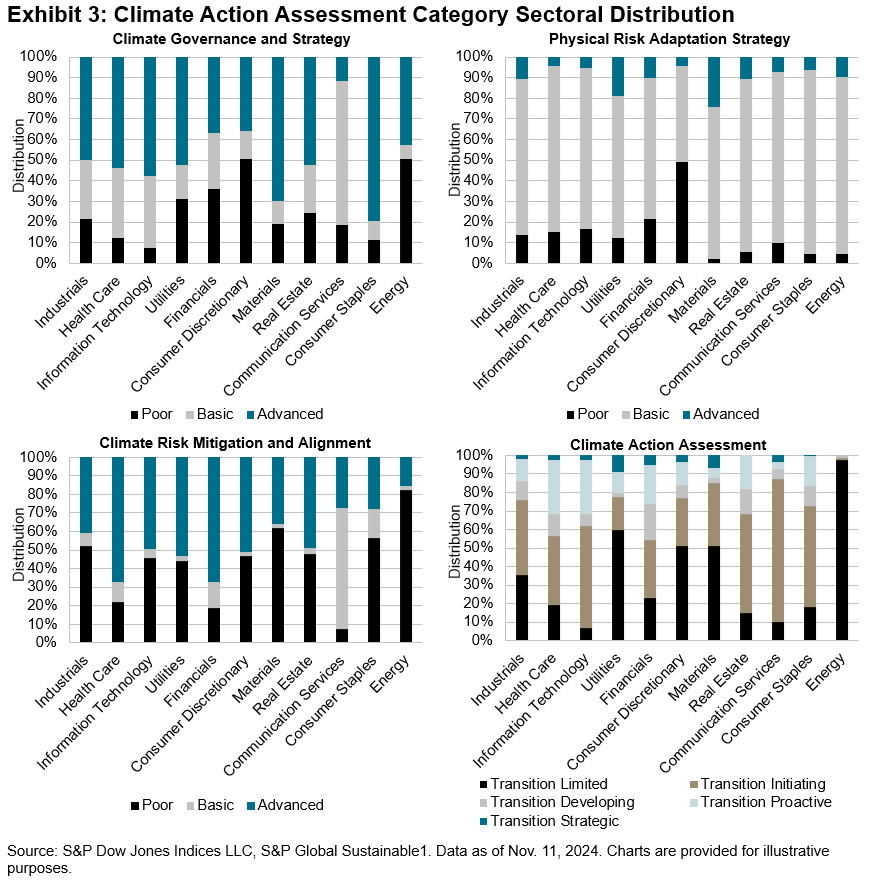
In general, we observe a considerable portion of companies across sectors that were assessed as Poor and Advanced for the Climate Governance and Strategy and Climate Risk Mitigation Pillars. However, most companies have a Basic physical risk adaptation strategy, and very few can be considered Advanced, suggesting that generally, companies lack context-specific adaptation plans. Aggregating the pillars, we see most companies classified at the bottom two tiers as either Transition Limited or Transition Initiating, reflecting the increasing climate action ambition required by the top tiers.

Taking the Energy sector as an example, we see that:

  • Roughly 50% of companies lack adequate climate governance practices, classifying them as Poor within Pillar 1;
  • The vast majority have sufficient overall physical risk adaptation plans and conducted scenario analysis, classifying them as Basic within Pillar 2; and
  • Approximately 80% of companies are classified as Poor within Pillar 3, most likely due to their higher implied temperature alignment and the lack of net zero targets covering Scope 3 emissions.

On an aggregate level, we observe that 97% of energy companies are ranked as Transition Limited, suggesting that there is still much room for improvement on the climate front for most companies in the sector.

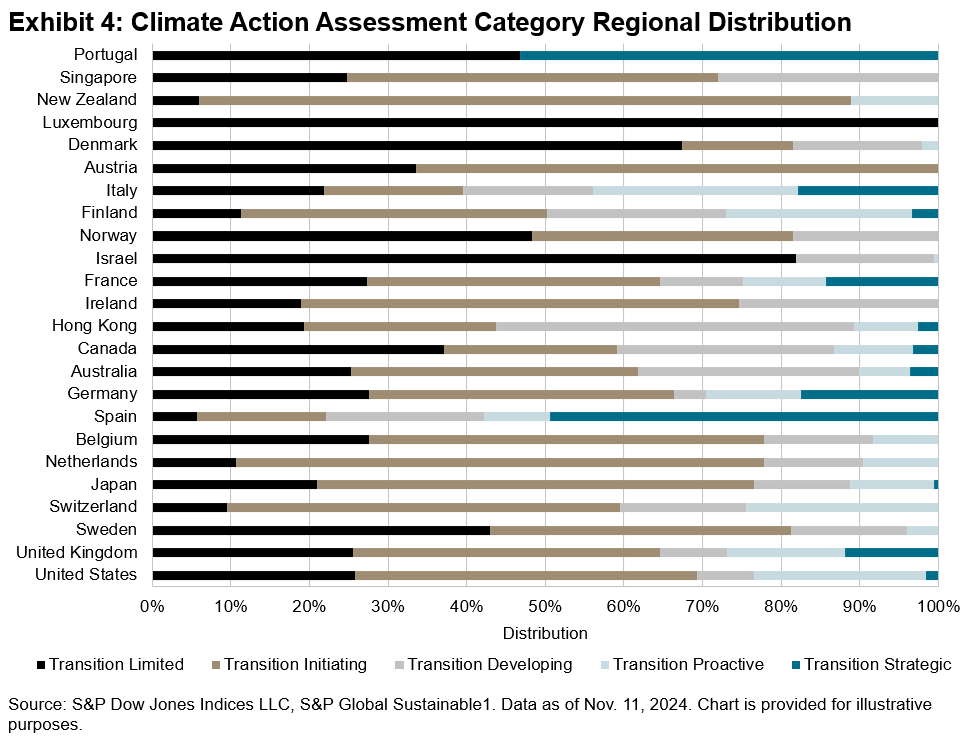
From a regional perspective, we observe a similar pattern in which there is a varied distribution of categories across regions (see Exhibit 4). Exploring the U.S., which comprises around 70% of the S&P World Index by market capitalization, we see most companies classified as either Transition Limited or Transition Initiating (i.e., the bottom two categories), and only 2% achieved the highest rank of Transition Strategic.

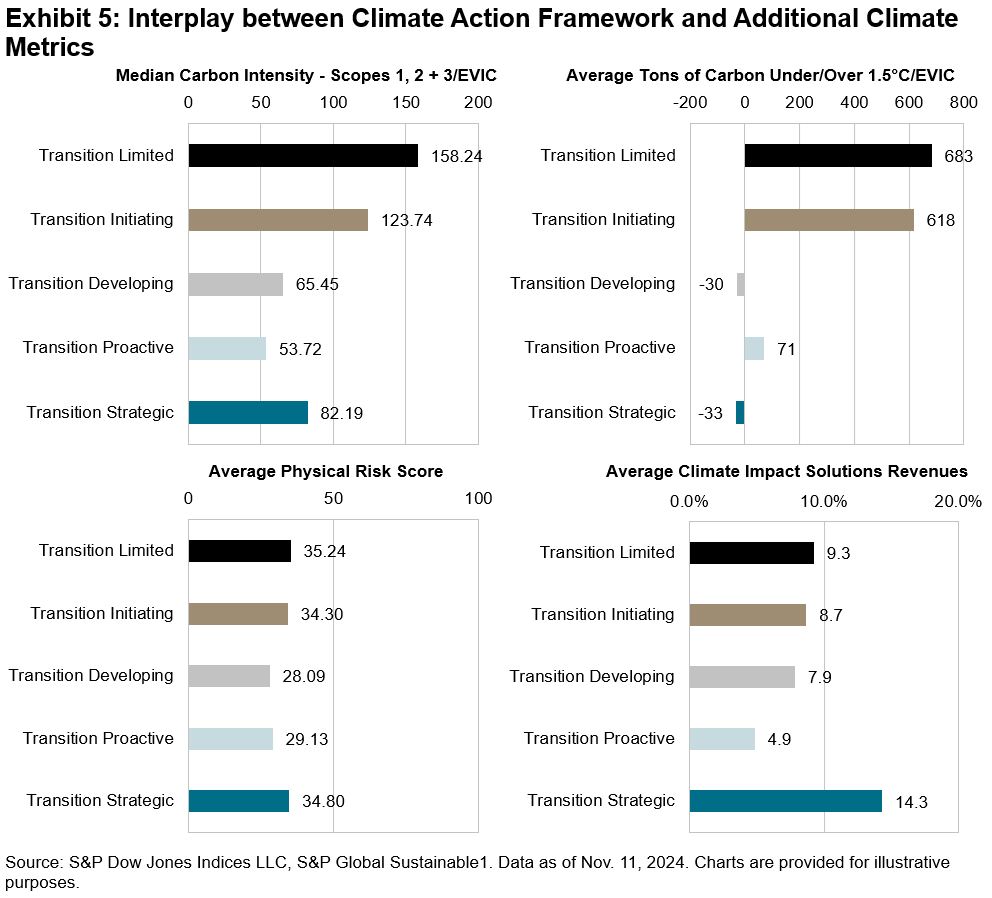
Analyzing the interplay between the Climate Action Framework assessment and other climate data points reveals interesting insights (see Exhibit 5).

  • There was a positive pattern between carbon efficiency and climate action, in which companies with enhanced climate governance and risk management structures also tend to be relatively more carbon efficient.
  • There was a relationship between forward-looking temperature rise and climate action practices—we see that Transition Strategic companies were under their 1.5°C carbon budget, indicating forward-looking alignment with the Paris Agreement goals.
  • There was not a strong pattern regarding physical risk, suggesting that physical risk may need to be addressed separately in an index that incorporates climate action assessments, to mitigate tail risk.
  • It is worth noting that Transition Strategic companies displayed the highest revenue alignment with climate impact solutions, such as renewable energy, sustainable transportation and battery technology.

In the second part of this blog series, we will explore the recently launched S&P World Climate Resilience Tilted Index, which incorporates elements of the S&P Climate Action Framework and additional climate datapoints to tilt toward companies that are relatively more climate resilient and carbon efficient, and that have higher exposure to climate impact solutions.

1 Intergovernmental Panel on Climate Change. “Climate Change 2022: Impacts, Adaptation and Vulnerability.” 2022.

2 Vijayakumar, C. “Collective action is the key to drive urgency in building climate resilience.” World Economic Forum. Jan. 19, 2025.

The posts on this blog are opinions, not advice. Please read our Disclaimers.

Do Active Funds Outperform in Less-Efficient Markets?

Contributor Image
Michael Brower

Former Associate Director, Index Investment Strategy

S&P Dow Jones Indices

Active managers sometimes tout their ability to select stocks in markets that are considered less informationally efficient and those that offer larger rewards to successful stock pickers. Smaller companies and those in emerging markets are typically presented as examples. What are the grounds for debate, and what do over 20 years of SPIVA® Scorecards tell us about the historical record?

First, consider the efficiency argument. It is true that research coverage is broader and deeper in some markets than others, and it is intuitive to suppose that the likelihood of misvaluations is higher among more obscure companies. However, there is no reason to assume that the likelihood of undervaluation is higher than the likelihood of overvaluation; determining which is which may be no easier in well-researched markets than in less-researched ones.

Second, some markets do indeed offer larger rewards for successful active choices than other markets. One way to understand the magnitude of the opportunity set in a given market is through dispersion, which measures the degree of variation in the returns of an index’s components over a specific period of time and at a specific level of granularity. When stock returns are more similar, dispersion is lower and the value of stock selection skill is accordingly lower. Conversely, when dispersion is high, opportunities may be greater.

In Exhibit 1, we plot monthly dispersion for the S&P SmallCap 600®, the S&P Emerging BMI and the S&P 500®. Over the past 23 years, dispersion was consistently higher in the first two indices compared to the third.

Drilling down, Exhibit 2 groups U.S.-based small-cap and emerging market active funds by the average dispersion registered in the category benchmark. We defined “low dispersion” as values falling below the 25th percentile, “high dispersion” as those above the 75th percentile and a third grouping encompassing all dispersion environments. In low dispersion environments, performance proved to be more challenging for large-cap and small-cap managers, with 67% and 73% of funds underperforming on average, respectively. However, even in high dispersion regimes, more than half of funds still underperformed in all three categories.

Exhibit 3 shows that only two years—2012 and 2019—saw the majority of managers in the Emerging Markets Equity category outperform, both of which coincided with relatively low dispersion environments. In contrast, there were only three years of majority outperformance for large-cap managers and six years for small-cap managers.1

All told, the rare success of active funds confirms that while there may be greater potential for outperformance in some markets, greater opportunity for outperformance is no guarantee of actual outperformance.

Over the long term, the statistics become even clearer. As summarized in Exhibit 4, regardless of the level of dispersion and whether managers are seeking alpha in widely researched markets like large-cap equities or more specialized areas, outperforming the benchmark over longer horizons remained particularly challenging.

The posts on this blog are opinions, not advice. Please read our Disclaimers.

Analyzing the Historical Performance of the S&P Quality FCF Aristocrats Indices across Macroeconomic Environments

Contributor Image
Wenli Bill Hao

Director, Factors and Dividends Indices, Product Management and Development

S&P Dow Jones Indices

S&P DJI recently launched a new family of indices known as the S&P Quality FCF Aristocrats which includes the S&P 500® Quality FCF Aristocrats® Index and the S&P Developed Quality FCF Aristocrats Index. A more comprehensive introduction to this family of indices can be found in this blog post.

Gaining insights into the historical performance of factor strategies across various macroeconomic environments is essential for risk mitigation and informed investment decisions.  In this blog, we will begin by analyzing the performance of these two newly launched indices across different economic regimes. Following that, we will compare the performance of the S&P 500 Quality FCF Aristocrats Index with that of another Aristocrats-branded index, the S&P High Yield Dividend Aristocrats, across the same four economic scenarios.

Macroeconomic Framework1

To assess performance across different economic environments, we use a framework that defines four distinct regimes based on whether growth2 and inflation3 are rising or falling. These regimes are organizing into four quadrants which are illustrated in Exhibit 1.

Considering the longer back-tested history available for the U.S. market compared to other developed markets, we present two distinct time horizons in our analysis (see Exhibit 2). The first time horizon spans 282 calendar months from May 31, 2001, to Oct. 31, 2024 for U.S. markets, while the second covers 222 calendar months from May 31, 2006, to Oct. 31, 2024, for developed markets. Exhibit 2 displays the number of months and relative frequency across each regime.

Performance Across Growth and Inflation Regimes

The historical risk/return characteristics of the S&P Quality FCF Aristocrats Indices and their respective benchmarks across the four economic regimes are illustrated in Exhibit 3. Historically, all the indices presented demonstrated highest absolute returns and risk-adjusted returns in the Rising Growth and Falling Inflation regime, followed by the Rising Growth and Rising Inflation regime. Conversely, these indices experienced much lower returns in the Falling Growth and Falling Inflation regime, with the worst returns—often negative—occurring in the Falling Growth and Rising Inflation regime.

Excess Returns4 in Four Economic Regimes

In this section, we analyze the macroeconomic performance of the S&P Quality FCF Aristocrats Indices in terms of their excess returns (ER) relative to their benchmarks (see Exhibit 4).

The S&P 500 Quality FCF Aristocrats Index consistently outperformed the S&P 500 in a Falling Growth environment, regardless of inflation trends. In the Rising Growth and Falling Inflation regime, its performance was comparable to that of the S&P 500. However, in the Rising Growth and Rising Inflation regime, it underperformed. This behavior indicates that the S&P 500 Quality FCF Aristocrats Index exhibits strong defensive characteristics whilst still meaningfully participating in market upside.

The S&P Developed Quality FCF Aristocrats Index consistently outperformed the S&P Developed LargeMidCap index by a wide margin in a Falling Growth environment, regardless of inflation trends. In the Rising Growth regime, its performance was slightly better than its benchmark. The results indicate that the S&P Developed Quality FCF Aristocrats index outperformed S&P Developed LargeMidCap in all economic regimes, meaning it was defensive in down markets while keeping pace strongly in up markets.

Comparison with the S&P High Yield Dividend Aristocrats

In a previous blog, we compared the S&P 500 Quality FCF Aristocrats Index with the S&P High Yield Dividend Aristocrats, demonstrating that these two indices provide differentiated exposure and track companies with distinct profiles. Now, let’s examine how they perform across the defined macroeconomic regimes.

Overall, the indices have differentiated exposure across these regimes. The S&P High Yield Dividend Aristocrats achieved its highest excess returns during the Falling Growth and Rising Inflation environment. In contrast, the S&P 500 Quality FCF Aristocrats led the way during both Falling Growth regimes, regardless of the inflation regime. However, both indices underperformed relative to the broad market during the Rising Growth and Rising Inflation regime.

In conclusion, the S&P Quality FCF Aristocrats Indices have historically outperformed during periods of falling economic growth, regardless of the inflation regime. In times of rising growth, both indices performed in line with the benchmark during falling inflation; however, the S&P 500 Quality FCF Aristocrats lagged when inflation was rising. Furthermore, our analysis shows that the S&P 500 Quality FCF Aristocrats offer differentiated exposure compared to the S&P High Yield Dividend Aristocrats, highlighting their potential as complementary tools.

1 Hao, Wenli Bill and Rupert Watts, “A Historical Perspective on Factor Index Performance across Macroeconomic Cycles,” S&P Dow Jones Indices LLC, Nov. 14, 2024.

2 Rising growth is defined as a positive monthly change in the U.S. Composite Leading Indicator (CLI) compared to the previous month, while falling growth is defined as a negative monthly change.

3 Rising inflation occurs when the three-month average of U.S. Consumer Price Index (CPI) exceeds that of three-year moving average, while falling inflation occurs when falling below.

4 Excess return measures how much the average monthly total return of each index exceeds that of its corresponding benchmark in each regime.

The posts on this blog are opinions, not advice. Please read our Disclaimers.

Introducing the S&P Commodity Risk Premia Diversifier TCA Index

Contributor Image
Grant Collins

Director, Multi-Asset Indices

S&P Dow Jones Indices

The author would like to thank Arlene Habib for her contributions to this blog.

Diversification is a foundational principle within asset allocation, as it seeks to reduce risk and mitigate drawdowns by combining exposure across different asset classes—like equities, fixed income and commodities—that generally do not move in tandem. Commodities, like energy and precious metals, tend to exhibit low correlations to equities and fixed income. Therefore, they have long played a part in asset allocation for their potential diversification and inflation protection benefits.

The recently launched S&P Commodity Risk Premia Diversifier TCA Index offers diversified commodity exposure via four underlying alternative risk premia indices, based on the S&P GSCI. Commodity alternative risk premia strategies refer to isolating exposure to specific risk sources, typically categorized by style, such as carry and momentum.

The S&P Commodity Risk Premia Diversifier TCA Index targets an annualized volatility of 5% by combining commodity elements with cash and adjusts its weight to its underlying individual alternative risk premia indices (see Exhibit 1).

The index aims for a risk contribution of 50%-25%-25% based on realized volatility across the underlying strategies of carry-congestion, momentum and backwardation, respectively.

Based on back-tested data, the index reduced sensitivity to large equity market movements and demonstrated low or even negative correlations to other leading indices found within index-linked insurance products.

A comparison of annual returns of the S&P Commodity Risk Premia Diversifier TCA Index and several other mainstream indices highlights the potential diversification benefits of the index during market downturns. For example, in 2008 and 2022, which were particularly challenging years for equity markets, the S&P Commodity Risk Premia Diversifier TCA Index gained 14.37% and 3.45%, respectively, based on back-tested data.

In conclusion, the framework of the S&P Commodity Risk Premia Diversifier TCA Index seeks to stabilize volatility through diversified commodity risk premia exposure. By employing alternative risk premia strategies, the index may help mitigate risk during equity market downturns and provide protection during inflationary environments. This index emphasizes the importance of diversification in achieving a well-rounded strategy.

The posts on this blog are opinions, not advice. Please read our Disclaimers.

2024 Open Interest Increase in iBoxx-Linked Futures

Contributor Image
Nicholas Godec

Senior Director,​ Head of Fixed Income Tradables & Commodities

S&P Dow Jones Indices

In 2024, open interest in futures tracking the iBoxx iShares $ High Yield Corporate Bond Index and iBoxx iShares $ Investment Grade Corporate Bond Index rose considerably. Open interest in futures referencing the iBoxx $ Liquid Emerging Markets Sovereigns & Sub-Sovereigns Index also increased following its June 17, 2024, launch.

For the iBoxx iShares $ High Yield Corporate Bond Index, 2024 open interest expanded by 245% to USD 414.9 million, while the iBoxx iShares $ Investment Grade Corporate Bond Index realized growth of 238% to USD 267.4 million in 2024. This occurred alongside trading volumes of USD 12.4 billion and USD 10.1 billion, respectively, for futures tied to the iBoxx iShares $ High Yield Corporate Bond Index and iBoxx iShares $ Investment Grade Corporate Bond Index throughout the year.

Futures tracking the iBoxx $ Liquid Emerging Markets Sovereigns & Sub-Sovereigns Index have traded USD 466.3 million in notional value since their June 17, 2024, launch. Average daily open interest initially rose from USD 3.5 million in July to a peak of USD 12.8 million in September, moderated to USD 9.8 million in October and USD 10.3 million in November, and ended the year at USD 5.9 million in December.

The growth in iBoxx-linked futures open interest highlights the uptake of these indices within the tradable credit ecosystem, while the launch of futures tracking the iBoxx $ Liquid Emerging Markets Sovereigns & Sub-Sovereigns Index indicates demand for additional measures and trading tools across credit market segments. As index-based solutions evolve, these developments underscore an ongoing shift toward broader, more flexible mechanisms for managing and accessing credit exposures.

For more information, please see 2024 Fixed Income Review: Elevated Yields and Increase in Index-Linked Futures Trading.

The posts on this blog are opinions, not advice. Please read our Disclaimers.