Get Indexology® Blog updates via email.

In This List

Introducing the S&P Commodity Risk Premia Diversifier TCA Index

2024 Open Interest Increase in iBoxx-Linked Futures

Rates, Risk and Relative Value

Performance Insights: The S&P 500 Equal Weight ESG Index

The Market Measure

Introducing the S&P Commodity Risk Premia Diversifier TCA Index

Contributor Image
Grant Collins

Director, Multi-Asset Indices

S&P Dow Jones Indices

The author would like to thank Arlene Habib for her contributions to this blog.

Diversification is a foundational principle within asset allocation, as it seeks to reduce risk and mitigate drawdowns by combining exposure across different asset classes—like equities, fixed income and commodities—that generally do not move in tandem. Commodities, like energy and precious metals, tend to exhibit low correlations to equities and fixed income. Therefore, they have long played a part in asset allocation for their potential diversification and inflation protection benefits.

The recently launched S&P Commodity Risk Premia Diversifier TCA Index offers diversified commodity exposure via four underlying alternative risk premia indices, based on the S&P GSCI. Commodity alternative risk premia strategies refer to isolating exposure to specific risk sources, typically categorized by style, such as carry and momentum.

The S&P Commodity Risk Premia Diversifier TCA Index targets an annualized volatility of 5% by combining commodity elements with cash and adjusts its weight to its underlying individual alternative risk premia indices (see Exhibit 1).

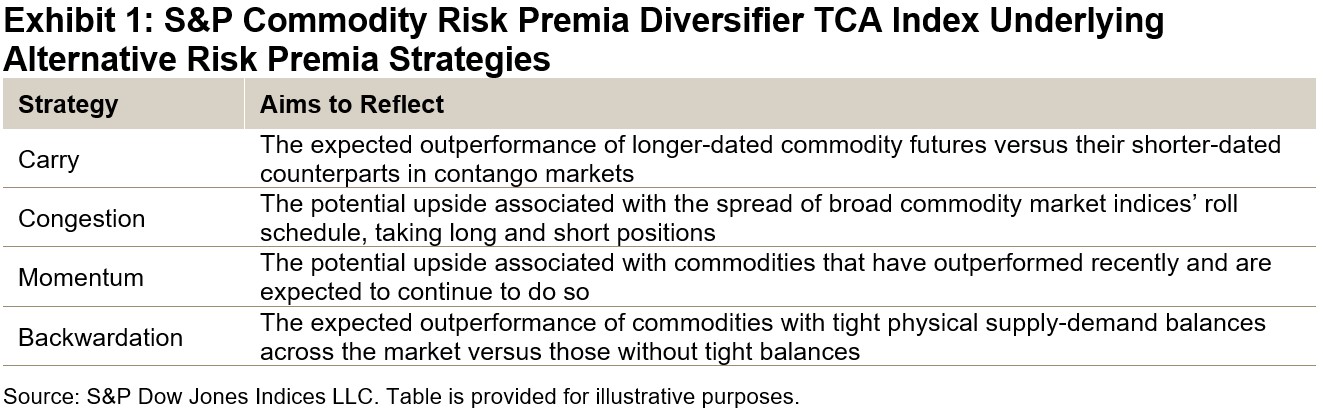
The index aims for a risk contribution of 50%-25%-25% based on realized volatility across the underlying strategies of carry-congestion, momentum and backwardation, respectively.

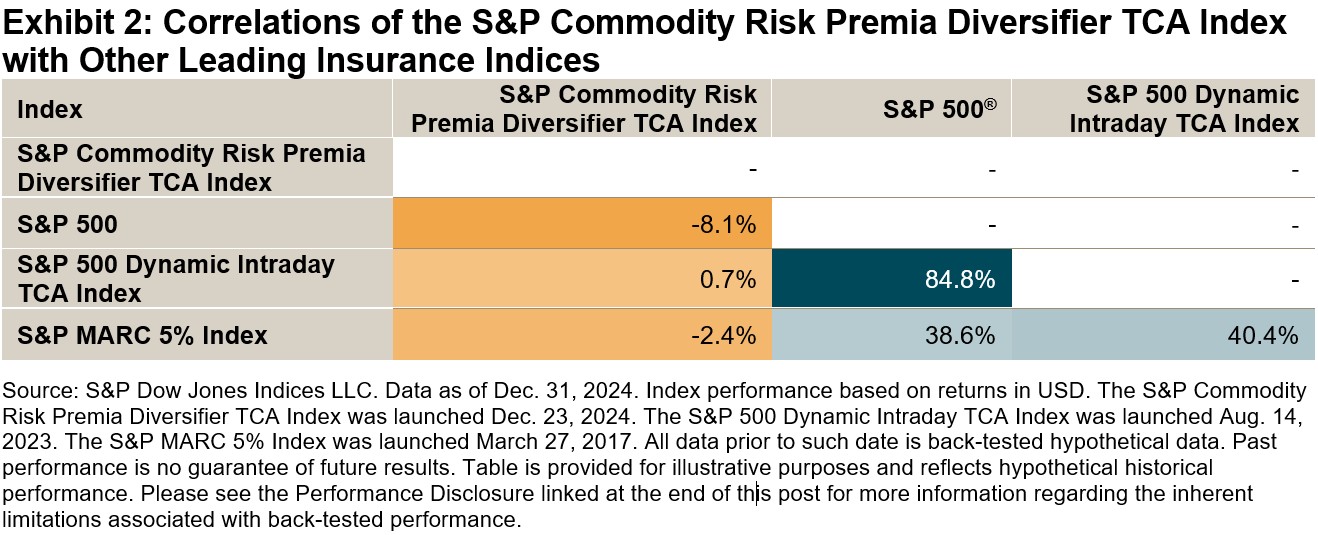
Based on back-tested data, the index reduced sensitivity to large equity market movements and demonstrated low or even negative correlations to other leading indices found within index-linked insurance products.

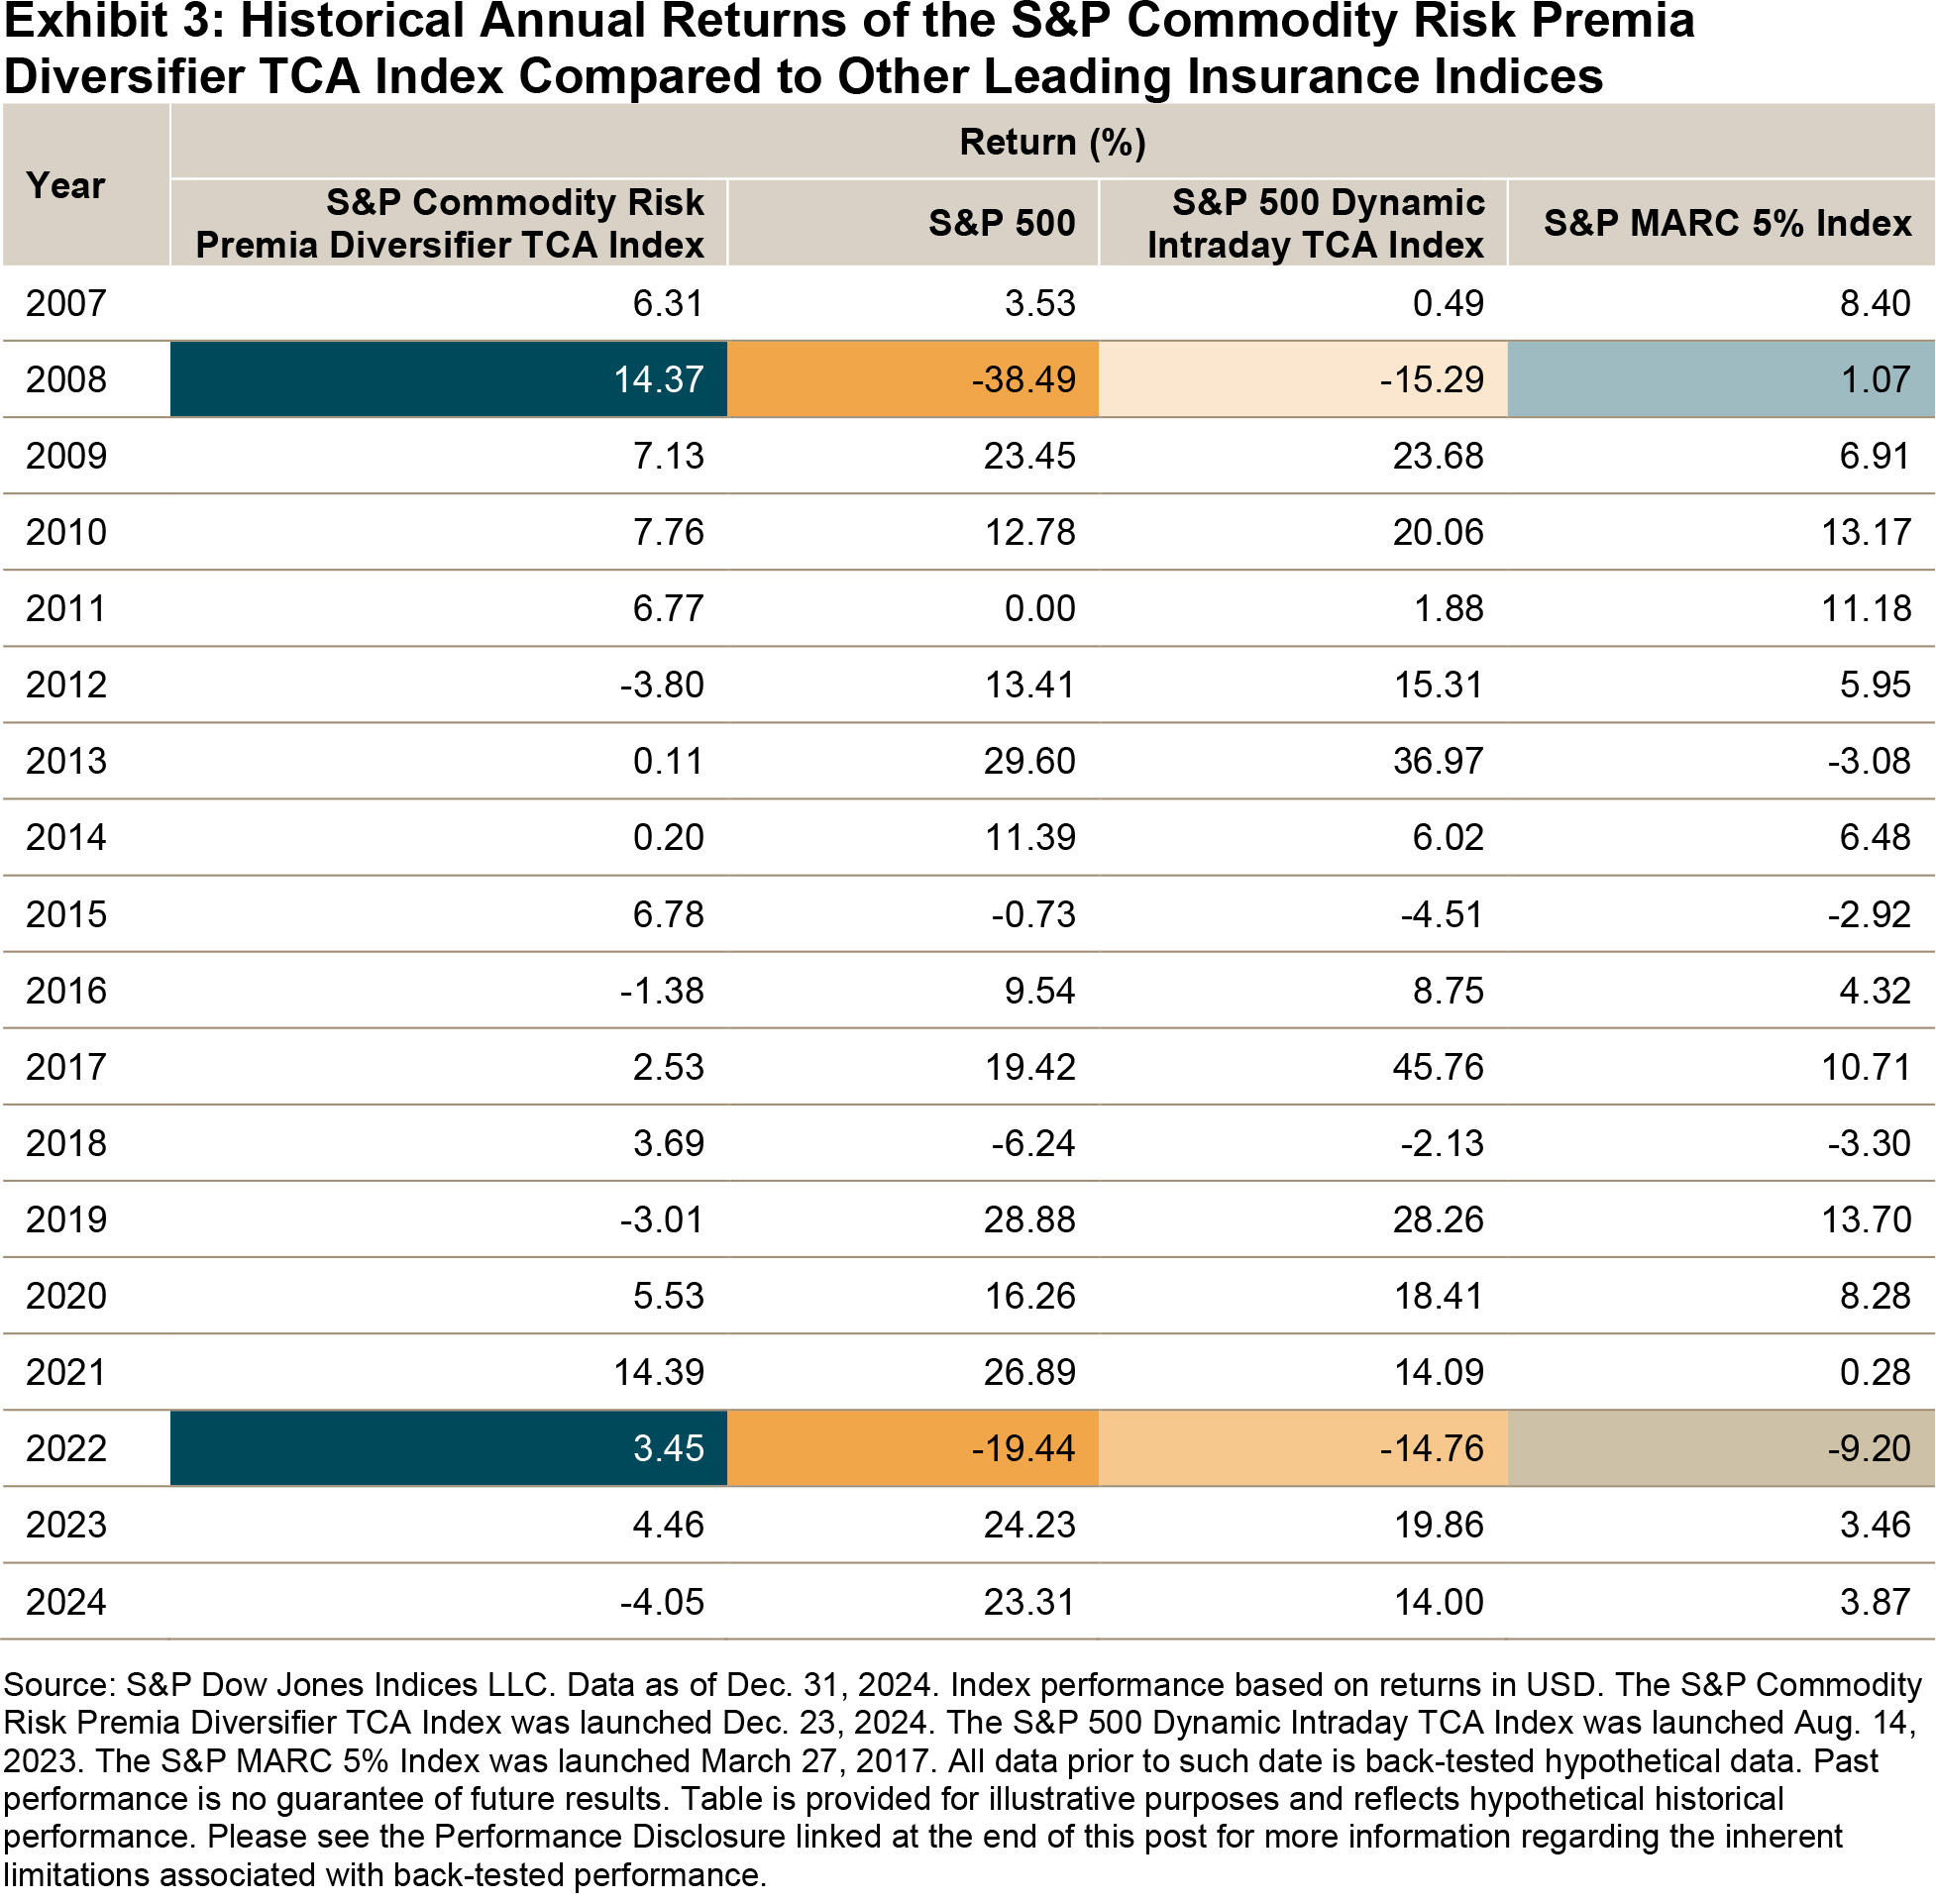
A comparison of annual returns of the S&P Commodity Risk Premia Diversifier TCA Index and several other mainstream indices highlights the potential diversification benefits of the index during market downturns. For example, in 2008 and 2022, which were particularly challenging years for equity markets, the S&P Commodity Risk Premia Diversifier TCA Index gained 14.37% and 3.45%, respectively, based on back-tested data.

In conclusion, the framework of the S&P Commodity Risk Premia Diversifier TCA Index seeks to stabilize volatility through diversified commodity risk premia exposure. By employing alternative risk premia strategies, the index may help mitigate risk during equity market downturns and provide protection during inflationary environments. This index emphasizes the importance of diversification in achieving a well-rounded strategy.

The posts on this blog are opinions, not advice. Please read our Disclaimers.

2024 Open Interest Increase in iBoxx-Linked Futures

Contributor Image
Nicholas Godec

Senior Director,​ Head of Fixed Income Tradables & Commodities

S&P Dow Jones Indices

In 2024, open interest in futures tracking the iBoxx iShares $ High Yield Corporate Bond Index and iBoxx iShares $ Investment Grade Corporate Bond Index rose considerably. Open interest in futures referencing the iBoxx $ Liquid Emerging Markets Sovereigns & Sub-Sovereigns Index also increased following its June 17, 2024, launch.

For the iBoxx iShares $ High Yield Corporate Bond Index, 2024 open interest expanded by 245% to USD 414.9 million, while the iBoxx iShares $ Investment Grade Corporate Bond Index realized growth of 238% to USD 267.4 million in 2024. This occurred alongside trading volumes of USD 12.4 billion and USD 10.1 billion, respectively, for futures tied to the iBoxx iShares $ High Yield Corporate Bond Index and iBoxx iShares $ Investment Grade Corporate Bond Index throughout the year.

Futures tracking the iBoxx $ Liquid Emerging Markets Sovereigns & Sub-Sovereigns Index have traded USD 466.3 million in notional value since their June 17, 2024, launch. Average daily open interest initially rose from USD 3.5 million in July to a peak of USD 12.8 million in September, moderated to USD 9.8 million in October and USD 10.3 million in November, and ended the year at USD 5.9 million in December.

The growth in iBoxx-linked futures open interest highlights the uptake of these indices within the tradable credit ecosystem, while the launch of futures tracking the iBoxx $ Liquid Emerging Markets Sovereigns & Sub-Sovereigns Index indicates demand for additional measures and trading tools across credit market segments. As index-based solutions evolve, these developments underscore an ongoing shift toward broader, more flexible mechanisms for managing and accessing credit exposures.

For more information, please see 2024 Fixed Income Review: Elevated Yields and Increase in Index-Linked Futures Trading.

The posts on this blog are opinions, not advice. Please read our Disclaimers.

Rates, Risk and Relative Value

Contributor Image
Anu Ganti

Head of U.S. Index Investment Strategy

S&P Dow Jones Indices

It is clear that the rapid rise of the 10-year U.S. Treasury yield could have significant implications for active bond manager performance, as well as bond market volatility dynamics. But how might this affect the equity market? Another important role of U.S. Treasury yields is to act as a risk-free rate to compare to the market return, the excess return of which is known as the equity risk premium.

Coupled with rising yields and continuous record highs for the stock market, Exhibit 1 shows that the S&P 500® equity risk premium, measured here as the difference between the S&P 500 trailing 12-month earnings yield versus the 10-year U.S. Treasury yield, has plummeted over the past year, most recently entering negative territory. The last time the equity risk premium was below zero was following the burst of the Tech bubble during the early 2000s.

While the equity risk premium may indicate that equities seem relatively expensive compared to bonds, we do caveat that as of Jan. 21, 2025, Q4 2024 S&P 500 earnings season has started off on a solid note, particularly among the big banks, and if earnings growth continues, that might help to support current valuations.

We can also analyze equities and bonds from an income lens by comparing the market’s dividend yield to 10-year U.S. Treasury yields. Exhibit 2 illustrates that the yield on the 10-year U.S. Treasury of 4.6% has significantly outpaced the S&P 500 trailing 12-month dividend yield, which has declined over the past couple of decades to 1.3% as of Jan. 17, 2025.

Bonds may seem relatively better positioned from a valuation and income vantage point, but their diversification potential is also interesting to examine. We observe in Exhibit 3 that correlations between equities and bonds, as measured by The 500™ and S&P U.S. Treasury Bond Current 10-Year Index, have recently turned negative. After witnessing positive correlations for most of 2024, this reversal, if sustained, might be indicative of a tailwind for enhanced risk-adjusted performance for combinations of both asset classes.

As we enter a new presidential regime, filled with many uncertain variables, we may not know the future trajectory of bonds or equities, but understanding their historical value, income and diversification characteristics could aid investors to adapt accordingly.


The posts on this blog are opinions, not advice. Please read our Disclaimers.

Performance Insights: The S&P 500 Equal Weight ESG Index

Contributor Image
Maya Beyhan

Global Head of Sustainability, Index Investment Strategy

S&P Dow Jones Indices

Since its launch in July 2022 to year-end 2024, the S&P 500® Equal Weight ESG Index achieved a cumulative outperformance of 0.86% compared to its benchmark, the S&P 500 Equal Weight Index. Gaining insight into the factors behind this outperformance highlights important aspects of environmental, social and governance (ESG) attributes that function differently from those in market-cap indices like the S&P 500 ESG Index.

To investigate the ESG attributes contributing to the S&P 500 Equal Weight ESG Index’s performance, we created hypothetical ESG quintile compositions by count and reconstituted them annually. This was done by ranking the S&P 500 Equal Weight Index’s constituents based on their ESG scores and assigning them to one of the five compositions, from highest to lowest ESG score, akin to previous assessments1 conducted on the S&P 500 ESG Index. The hypothetical equal-weighted performance of these compositions was then calculated and used to create a Brinson-like ESG attribution analysis,2 teasing out the importance of ESG score exposures in the performance of the S&P 500 Equal Weight ESG Index.

Exhibit 1 illustrates the results of this analysis, measuring the contribution of ESG quintile weighting and stock selection effects to the S&P 500 Equal Weight ESG Index’s excess return relative to the S&P 500 Equal Weight Index since its launch.3 To emphasize the relative impact of ESG quintile weighting and stock selection effects, the exhibit shows the proportion of the total impact, with their absolute values summing to 100% and the actual return impact shown in the labels.

Our findings reveal that the S&P 500 Equal Weight ESG Index’s performance was predominantly driven by stock selection effects rather than ESG quintile weighting effects. Specifically, stock selection contributed 2.65% to the index’s excess return, while ESG quintile weighting had a negative impact of 1.79%. This resulted in a total cumulative excess return of 0.86%. Of the five ESG quintiles, the ESG quintile weighting effect exceeded the stock selection effect in just one: Quintile 1.

This conclusion contrasts with the performance drivers observed in the S&P 500 ESG Index during the same period, as illustrated in Exhibit 2. The S&P 500 ESG Index achieved a cumulative excess return of 0.91% against the S&P 500, with more than 60% of this excess return driven by ESG quintile weighting effects. 4

The varied performance drivers highlight the significant impact that index construction methodologies can have on performance. The S&P 500 Equal Weight ESG Index5 can benefit from an approach that emphasizes the selection of companies with higher ESG scores across market capitalizations. This could enable it to tap into the value generated by smaller firms, which can be overlooked in cap-weighted indices.

As the growing emphasis on sustainable investing continues to shape market participants’ preferences and the drivers of relative performance in the S&P 500 Equal Weight Index6 continue to attract attention, these findings could serve as a crucial reference for market participants looking into this index’s ESG variant. For those interested in exploring more about S&P DJI’s sustainability-focused indices, additional information is available in the Sustainability Index Dashboard.

The posts on this blog are opinions, not advice. Please read our Disclaimers.

1 For a thorough description of the hypothetical ESG quintile compositions and the drivers behind the excess return in the S&P 500 ESG Index, see Beyhan, Maya, “Charting New Frontiers,” S&P Dow Jones Indices LLC, Sept. 06, 2024.

2 For more information on this widely used performance attribution model, see Brinson, Gary P., L. Randolph Hood and Gilbert L. Beebower, “Determinants of Portfolio Performance,” Financial Analysts Journal, July-August, 1986.

3 Analysis carried out using Portfolio Analytics on S&P Capital IQ Pro.

4 Analysis carried out using Portfolio Analytics on S&P Capital IQ Pro.

5 See the S&P Equal Weight ESG Indices Methodology.

6 For a thorough overview of the potential sources and drivers of relative performance in the S&P 500 Equal Weight Index, see Ganti, Anu R., Tim Edwards and Hamish Preston, “Worth the Weight,” S&P Dow Jones Indices LLC, July 23, 2024.

The posts on this blog are opinions, not advice. Please read our Disclaimers.

The Market Measure

Explore the dynamics that drove performance trends around the world in 2024 as well as the potential implications of all-time highs for market participants.

The posts on this blog are opinions, not advice. Please read our Disclaimers.