Get Indexology® Blog updates via email.

In This List

Rebalance Review of the S&P Global Clean Energy Index – H2 2024

A Balanced Approach: Inside the S&P 500 Equal Weight Index

S&P Israel 100 Index: Reflecting Israel's Potential

Direct Indexing: Launch of MyIndex™ with S&P DJI and Brooklyn Investment Group

Carbon Intensity in the Middle East – An Index Perspective

Rebalance Review of the S&P Global Clean Energy Index – H2 2024

Contributor Image
Abbie Zhang

Senior Analyst, Thematic Indices

S&P Dow Jones Indices

Launched in 2007, the S&P Global Clean Energy Index has been a headline benchmark for measuring clean energy-related companies’ performance over the past 16 years. In April 2021, we launched the S&P Global Clean Energy Select Index to measure the 30 largest companies in global clean energy businesses listed on developed market exchanges.

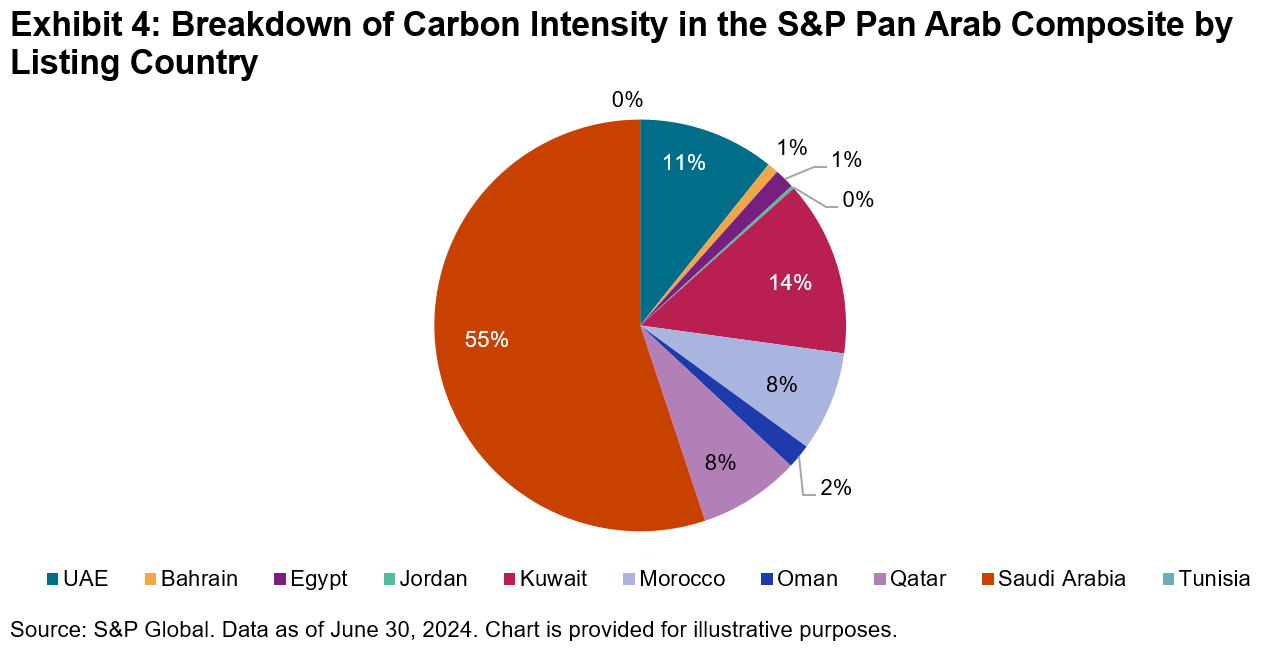
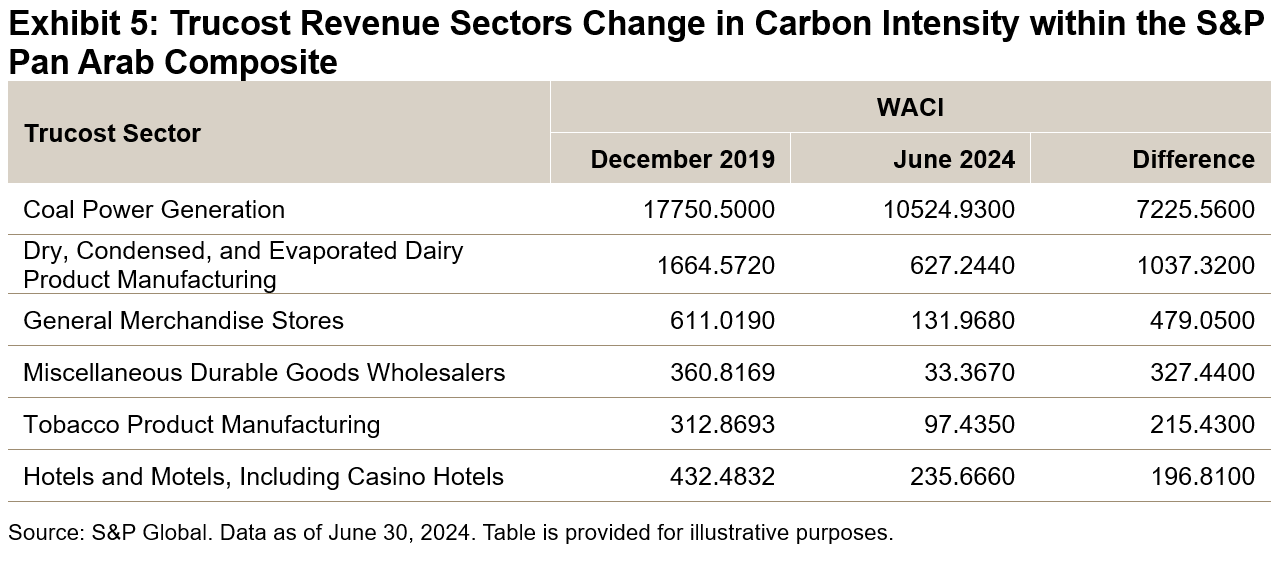
Both indices had their semiannual rebalances on Oct. 18, 2024. The index methodology categorizes companies into four exposure score buckets ranging from 0 to 1, with a 0.25 increment, to measure their clean energy business purity. Exhibits 1 and 2 show the change in exposure before and after the October rebalance for both indices. For the S&P Global Clean Energy Index, the weighted average exposure score of the index increased slightly from 0.92 to 0.93. The S&P Global Clean Energy Select Index consists of 30 companies with an exposure score of 1 listed in the developed market exchanges (see Exhibit 2).

In the market allocation breakdown, significant changes in the S&P Global Clean Energy Index following the rebalance include a 6.41% increase in the weight of the U.K. and a 2.13% increase for Brazil, alongside an 8.80% decrease for the U.S. Meanwhile, for the S&P Global Clean Energy Select Index, Portugal’s weight rose by 4.04%, while the weights of South Korea and Brazil experienced declines of 3.11% and 2.92%, respectively.

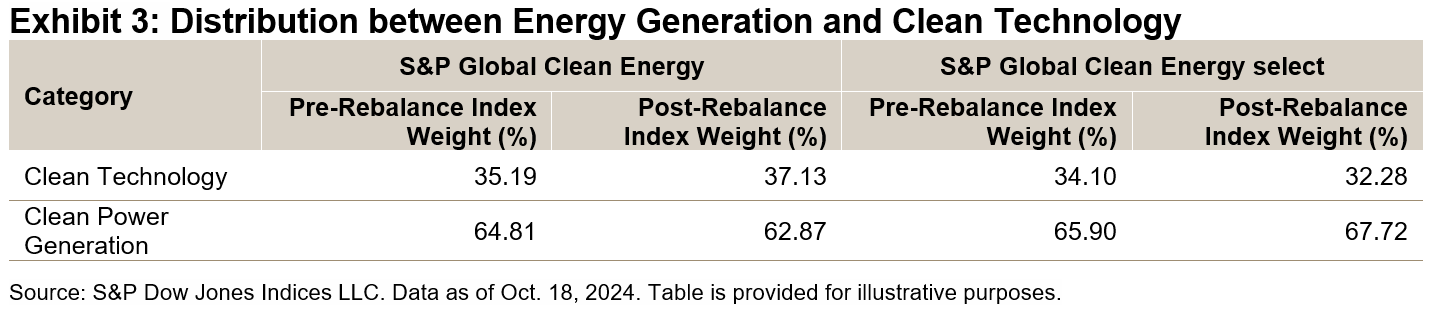
The S&P Global Clean Energy Index and the S&P Global Clean Energy Select Index track both the performance of clean energy technology firms and clean power generation companies (see Exhibit 3). During the recent rebalance, the index weight of clean technology in the S&P Global Clean Energy Index increased, primarily driven by a 1.12% rise in the index weight for the FactSet Revere Business Industry Classifications System (RBICS) subindustry of Wind Energy Equipment Manufacturing. Conversely, the index weight for clean power generation decreased, largely due to a 7.4% weight decrease in the RBICS subindustry of United States Northeast Electric Utilities.

The composition change of the S&P Global Clean Energy Select Index was different, featuring a decrease in clean technology weight alongside an increase in clean power generation weight. Within clean technology, there was a 3.39% drop in the RBICS subindustry of Photovoltaic and Solar Cells and Systems Providers. Meanwhile, clean power generation saw a 3.3% increase in the RBICS subindustry of Europe Mixed Alternative Wholesale Power and a 1.6% rise in the RBICS subindustry of Europe Solar Wholesale Power.

The inclusion or exclusion of constituents within the S&P Global Clean Energy Select Index could be a result of the change on exposure score, or it could be due to the market movements that changed the relative float market capitalization ranking of companies within the S&P Global Clean Energy Index. For exposure score information, please refer to S&P DJI’s Client Resource Center.

S&P Global Clean Energy Index Performance YTD in 2024

Underperforming the S&P Global BMI YTD, the S&P Global Clean Energy Select Index was down 25.78% and the S&P Global Clean Energy Index was down 19.93% in USD total return terms. Dispersion was high among constituents of the S&P Global Clean Energy Index. SolarEdge Technologies (-83.12%), Shoals Technologies (-66.41%) and Hanwha Solutions Corporation (-61.58%) were among the lagging performers, while Suzlon Energy (up 61.24%) and NHPC (up 23.55%) made positive contributions, partially offsetting some of the losses.

We recently published the paper “Navigating the Clean Energy Transition: Market Dynamics and Performance Insights,” which delves into the market dynamics around the clean energy transition. The paper outlines the energy transition process, provides an overview and performance review of the S&P Global Clean Energy Indices, discusses ongoing policy support for the energy transition and presents a quantitative analysis of performance. For those seeking a deeper understanding of these topics, the paper offers valuable perspectives on the current state and future potential of the clean energy transition.

The posts on this blog are opinions, not advice. Please read our Disclaimers.

A Balanced Approach: Inside the S&P 500 Equal Weight Index

How can an equal weight approach to U.S. equities help to address concerns around mega-cap concentration? S&P DJI’s Anu Ganti and CME Group’s Joe Hickey explore the S&P 500 Equal Weight Index’s historical performance trends and its potential applications for market participants seeking enhanced diversification.

The posts on this blog are opinions, not advice. Please read our Disclaimers.

S&P Israel 100 Index: Reflecting Israel's Potential

Contributor Image
Diego Zurita

Analyst, Global Equities & Thematics

S&P Dow Jones Indices

The Israeli stock market has a unique landscape, offering stability and liquidity comparable to other well-established markets, while also providing regional diversification as the only developed market in the Middle East. In recent years, Israel has been a spotlight for technology and innovation, hosting many high-tech companies from industries like cybersecurity, biotechnology and software development. To highlight the significance of this market, S&P Dow Jones Indices offers the S&P Israel 100 Index.

The S&P Israel 100 Index measures the performance of the 100 largest and most liquid companies listed and domiciled in the Israeli stock market. Following a float-adjusted market capitalization weighting, the index is reconstituted and rebalanced quarterly to capture market trends. To reduce overconcentration, single constituent weights are capped at 8% and single GICS sectors are capped at 30% at each rebalancing. For more details about the index construction, the methodology can be found on the S&P Dow Jones Indices website.

Launched in August 2023, the S&P Israel 100 Index is calculated in U.S. dollars and new Israeli shekels with more than 12 years of daily index level data available. The index includes all 11 GICS sectors, with Financials having the biggest market cap weight at 31.9%, followed by Information Technology (19.0%) and Real Estate (13.0%), as of the end of November 2024 (see Exhibit 2).

After a year of volatility and an accompanying modest annual return of 4.8% in 2023, 2024 YTD returns for the S&P Israel 100 Index have seen multiple all-time highs. Having returned 23.4% YTD (as of November 2024), the index has maintained a similarly positive trend as the S&P 500 (up 28.1% YTD) and the S&P World Index (up 22.4% YTD), as seen in Exhibit 3.

The main contributors to the YTD performance of the S&P Israel 100 Index vary across sectors, with Financials playing a significant role, along with Teva Pharmaceutical Industries from the Health Care sector, whose growth has been attributed to an increase in revenue from both their generic and branded drugs, as well as semiconductor manufacturers (Tower Semiconductor Ltd and Nova Ltd) from the Information Technology sector, which have been boosted by increased interest around the AI space. The top 10 contributors of the index accounted for 72.3% of its performance (see Exhibit 4).

The Tel Aviv 125 Index, also known as the TA-125 Index, is one of the most broadly used benchmarks to reflect the performance of Israeli markets. The S&P Israel 100 Index has provided a differentiated return profile compared to the TA-125 Index, while exhibiting improved performance over the most recent 10-year period.

The S&P Israel 100 Index measures Israel’s leading companies across the sector landscape. With a transparent, rules-based methodology, this index offers the possibility of geographical diversification among developed markets, given its focus on a country with unique characteristics. As the only developed market in the Middle East, the index reflects the distinct characteristics of Israel’s dynamic economy.

The posts on this blog are opinions, not advice. Please read our Disclaimers.

Direct Indexing: Launch of MyIndex™ with S&P DJI and Brooklyn Investment Group

What’s fueling the growing interest in direct indexing? S&P DJI’s Robby Ross and Brandon Hass sit down with Erkko Etula from Brooklyn Investment Group to explore how direct indexing solutions can enable investment managers to customize leading indices like the S&P 500 to meet specific objectives.

The posts on this blog are opinions, not advice. Please read our Disclaimers.

Carbon Intensity in the Middle East – An Index Perspective

Contributor Image
Aran Spivey

Senior Analyst, Global Exchange Indices

S&P Dow Jones Indices

In December 2023, the COP28 UN Climate Change Conference was hosted in Dubai, once again putting the spotlight on global climate change action and handing the Middle East hosting responsibilities. Describing the current period as “the beginning of the end” of the fossil fuel era,1 this iteration of COP not only gave us the first global stocktake of progress against the 1.5°C by 2023 global warming target, but more specifically a unique opportunity to assess how the host region, the Middle East, stacks up in terms of both contribution to global warming and reduction of corporate carbon emissions.

Indices are a useful way to measure the performance of a basket of stocks, but they can also provide insight into the environmental credentials of listed companies. In this blog, we explore the carbon characteristics of the region via the S&P Pan Arab Composite and the S&P/Hawkamah ESG Pan Arab Index. The latter index measures the performance of the 50 top-performing stocks in the region, while incorporating environmental, social and governance (ESG) factors. The former index is a broad, float-adjusted, market-capitalization-weighted index with no specific ESG criteria incorporated, and acts as the benchmark for the ESG index.

Using S&P Global Trucost environmental data, we can assess how constituents of these indices have historically contributed to overall emissions and related metrics. This analysis enables us to explore a number of facets of climate transition. For example, which industries are the heaviest CO2 polluters? Which companies are leading the charge from a decarbonization perspective? How does the inclusion of ESG criteria in index design affect its carbon performance when compared to the benchmark?

Exhibit 1 provides us an overview of how the weighted-average carbon intensity (WACI) of the S&P Pan Arab Composite has increased over time.2 One noteworthy observation here is that corporate disclosure has improved with time, with more companies providing more thorough disclosure of their carbon performance. This is combined with improved modeling techniques on non-disclosing corporates.3

With overall emissions rising, which companies are most heavily contributing? Exhibit 2 provides an overview of which stocks have the greatest WACI, meaning that based on their weight in the index, they have the highest proportional CO2 emissions.

The S&P Pan Arab Composite has more stocks, meaning weights within the index are generally smaller than in the S&P/Hawkamah Pan Arab ESG Index. As a result, although ACWA Power Co has a WACI of 839.8, its smaller index weight minimizes its contribution to the overall WACI of the S&P Pan Arab Composite. Conversely, in the S&P/Hawkamah Pan Arab ESG Index, the lower number of stocks mean that they have greater weight in the index, leading to greater concentration. As a result, the overall index-level WACI of the ESG index has historically been higher.

As depicted in Exhibit 3, due to concentration within the S&P/Hawkamah Pan Arab ESG Index, it had a greater carbon intensity than its benchmark in 2021, 2022 and 2023.

Exhibit 4 depicts the overall country-level contribution of carbon intensity of the S&P Pan Arab Composite. As of June 2024, over one-half of the emissions of the index came from Saudi Arabia, while Kuwait was the second-largest contributor, at 14% of overall index emissions. This is aligned with country representation by market capitalization.

To identify sectors that are making progress, it is possible to compare the sector-level intensity and observe which sectors have seen reductions over time. Exhibit 4 shows the Trucost Revenue Sectors that have made the most progress since December 2019.

Coal Power Generation has experienced the largest reduction in intensity over this period, driven by Taqa Morocco’s declining carbon intensity. However, overall emissions at an index level have increased, highlighting the need for corporate action on CO2 emissions.

This carbon analysis reveals that the S&P/Hawkamah ESG Pan Arab Index exhibited a higher WACI than its benchmark over the five-year period studied. While this finding highlights a notable disconnect between ESG scoring and actual carbon performance, it also emphasizes the evolving nature of ESG indices as they adapt to the complexities of sustainability metrics. While the S&P/Hawkamah ESG Pan Arab Index represents a significant step forward in promoting responsible investment practices in the region, encouraging companies to enhance their ESG performance and transparency, for those market participants seeking an improved carbon reduction at an index level, it may be the case that this should be factored into specific index design principles.

Ultimately, the S&P/Hawkamah ESG Pan Arab Index can serve as a valuable tool for assessing the ESG performance of companies within the region, as it integrates considerations for environmental, social and governance issues. As expectations on corporate sustainability proliferate, the index continues to act as a robust measurement of these crucial topics.


1See a summary of COP28 here: https://unfccc.int/cop28/5-key-takeaways

2For more information on metric calculation please see Index Carbon Metrics Explained.

3The full methodology available at Trucost Environmental Data: Methodology.

The posts on this blog are opinions, not advice. Please read our Disclaimers.