“Be thankful I don’t take it all, cause I’m the taxman.”
George Harrison (The Beatles) in “Taxman”
For over 20 years, S&P Dow Jones Indices has compared index performance against actively managed funds and published the results in the SPIVA® Scorecards. Active funds have often struggled to match the returns of capitalization-weighted benchmarks like the S&P 500® or the S&P Composite 1500® (see the SPIVA Global Mid-Year 2024). But even outperforming active managers have faced headwinds, including typically higher fees and particularly taxes, which can significantly erode performance, leaving even fewer managers capable of outperforming in the long run.
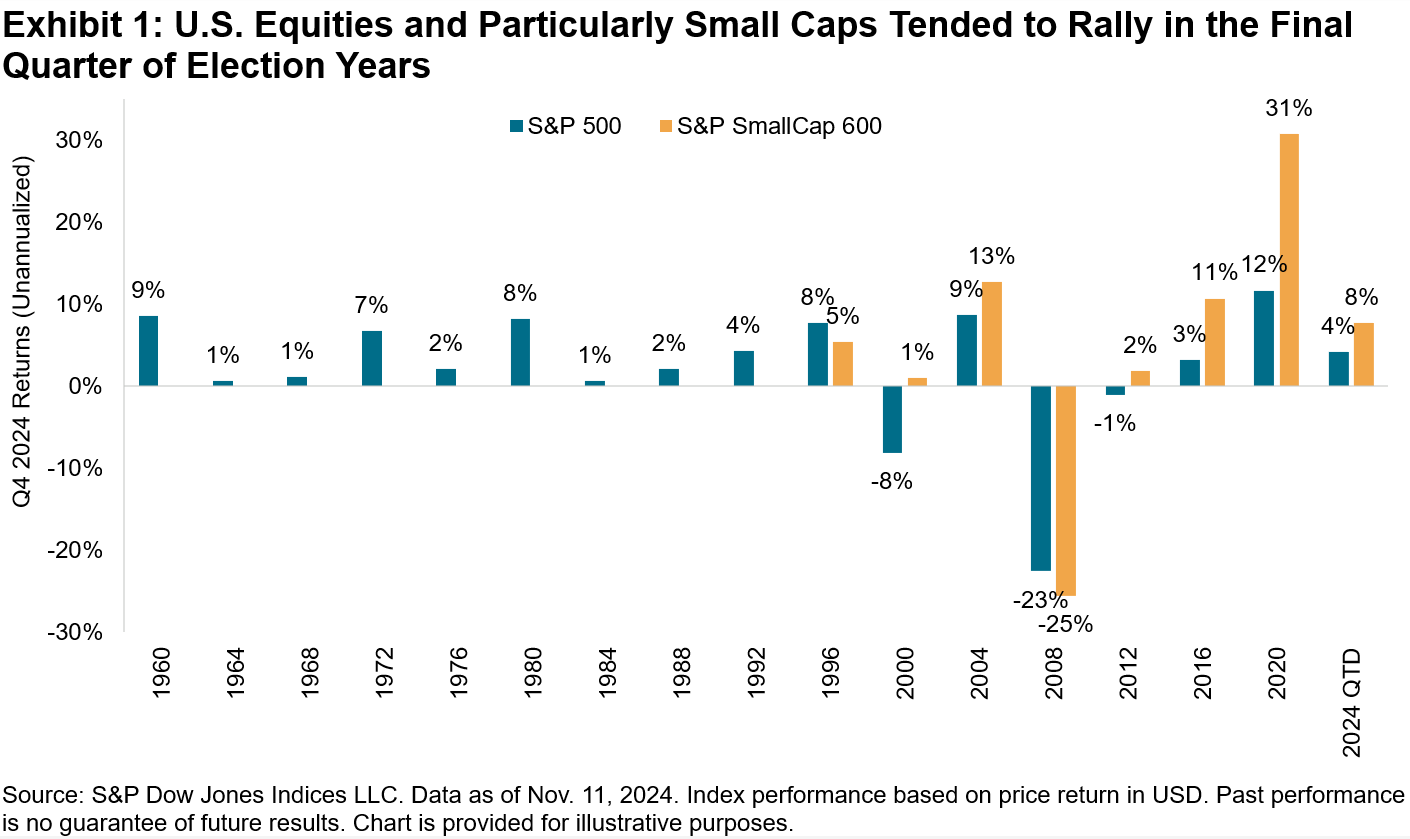
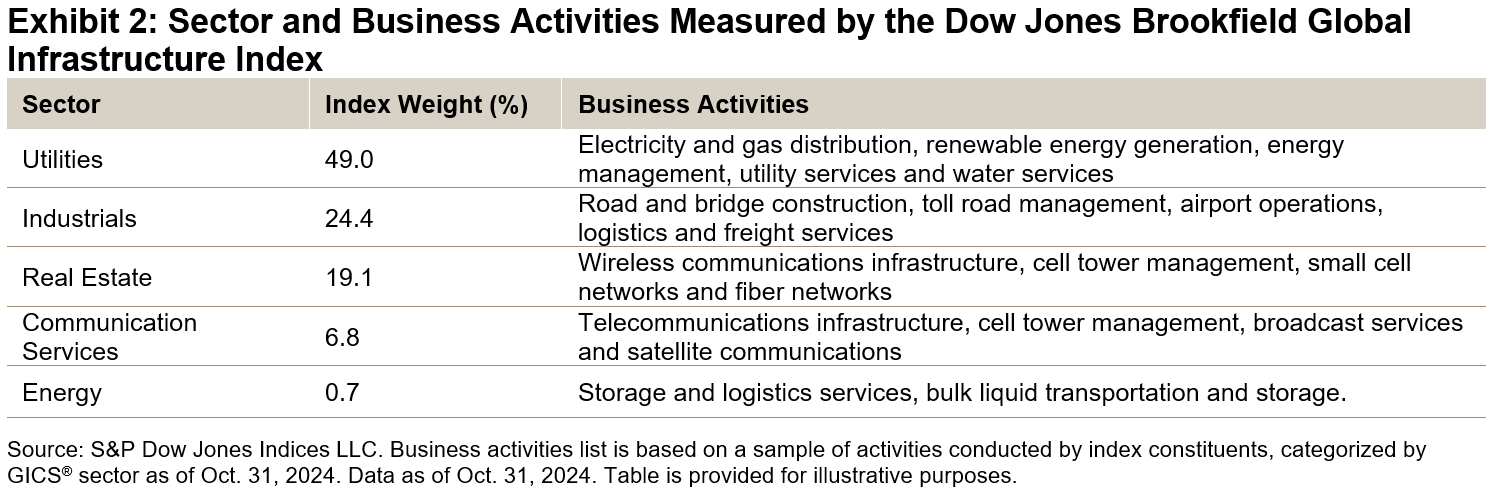
The SPIVA After-Tax Year-End 2023 Scorecard analyzes the cumulative effect of taxes on investor returns for broad U.S. domestic equity categories, demonstrating the improbability of beating a benchmark after accounting for taxes on capital gains and other distributions. In 2023, across the All Domestic Funds, All Large-Cap Funds and Large-Cap Core Funds categories, 79%, 66% and 74% of active managers underperformed their benchmarks after taxes, respectively. Fund manager underperformance rates worsened considerably compared to 2022, particularly for All Domestic Funds (see Exhibit 1).
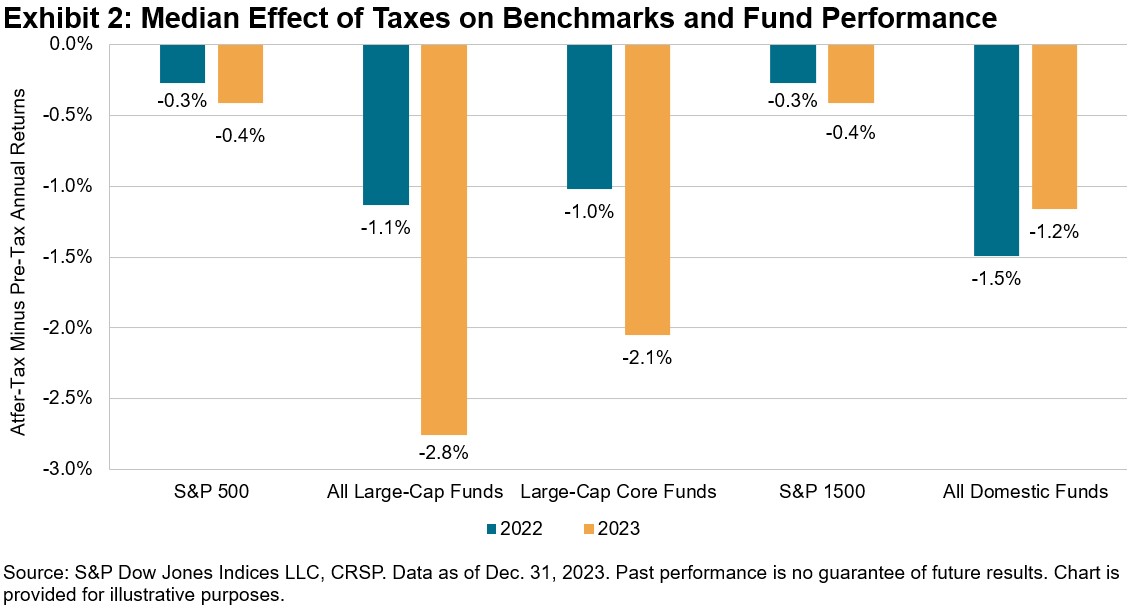
A key reason for the higher underperformance rates in 2023 is that the impact of taxes on the returns of active funds was generally greater compared to the equivalent tax impact on the respective benchmarks. The 2023 median after-tax returns for All Domestic Funds, All Large-Cap Funds and Large-Cap Core Funds lagged their pre-tax medians by 1.2%, 2.8% and 2.1%, respectively, compared to 1.5%, 1.1% and 1.0%, respectively, in 2022. These differentials were considerably larger compared to the less than 0.5% impact for both the benchmark S&P 1500® and S&P 500.
If the impacts of taxation on actively managed funds weren’t damaging enough, the sharp increase in long-term mutual fund outflows over the past couple years may have led to another unfortunate scenario for taxable investors. During 2022 and 2023, long-term U.S. mutual funds experienced a combined USD 1.765 trillion in net outflows.1 These persistent outflows may have triggered tax bills for investors even in strong-performing markets.
While 2023 was a much different market regime than 2022 (characterized by a sharp rise of 26.3% and a severe downturn of 18.1%, respectively, for the S&P 500), one thing was the same in both years: active managers in broad U.S. equity categories found it difficult to beat their benchmarks, particularly when tax bills came due. To learn more about the effect of taxes on fund performance, please see the SPIVA After-Tax Year-End 2023 Scorecard.
The author would like to thank Joe Nelesen, Davide Di Gioia and Grace Stoddart for their contributions to this post.
1 For more detail on long-term U.S. mutual fund flows, please see figures 3.3 and 3.4 (pages 46-48) in the 2024 Investment Company Fact Book.
The posts on this blog are opinions, not advice. Please read our Disclaimers.