Get Indexology® Blog updates via email.

In This List

The S&P/BMV IPC during Each Presidential Administration in Mexico

Creative Cacophony

What Makes the S&P/B3 Ingenius Index Different?

What Makes the S&P/BMV Ingenius Index Different?

A Grain of Wisdom: S&P DJI Launches S&P GSCI Minneapolis Wheat and S&P GSCI Composite Wheat

The S&P/BMV IPC during Each Presidential Administration in Mexico

Contributor Image
Eduardo Olazabal

Associate Director, Global Exchange Indices

S&P Dow Jones Indices

On Oct. 1, 2024, a new presidential administration took office in Mexico amid a series of constitutional reforms and a new political landscape. Political change can create uncertainty, so it is useful to analyze past periods to identify trends and gain insights on the effects of similar events.

How did the S&P/BMV IPC and the MXN/USD exchange rate perform during the outgoing administration and how did this compare to other periods? Exhibit 1 shows a summary of the performance of the S&P/BMV IPC and the MXN/USD exchange rate since 2000.

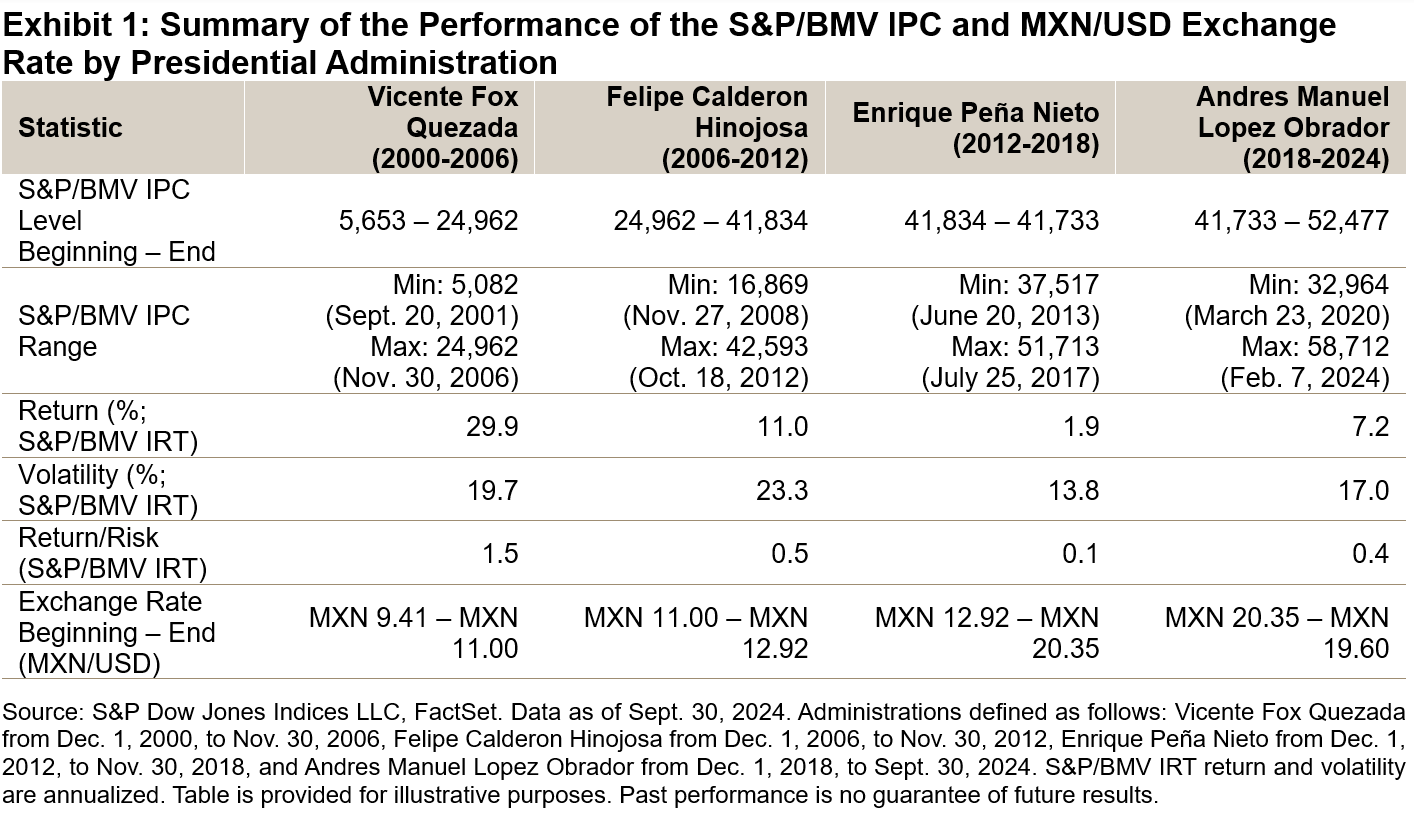
The S&P/BMV IPC has delivered varied but positive returns in the past four administrations. We can observe that the annualized performance of the S&P/BMV IRT increased significantly in the past administration, going from 1.9% to 7.2%, though still below what we saw in the 2000s. In terms of volatility, the past six years saw a slight increase compared to the previous period; however, if we look at the return/risk ratio, the additional risk was offset by higher returns.

The exchange rate closed with a marginal appreciation when compared to its 2018 level, although just before the 2024 elections, it had appreciated by over 16%. In any case, this is noteworthy as this was the first administration in which the Mexican peso did not depreciate.

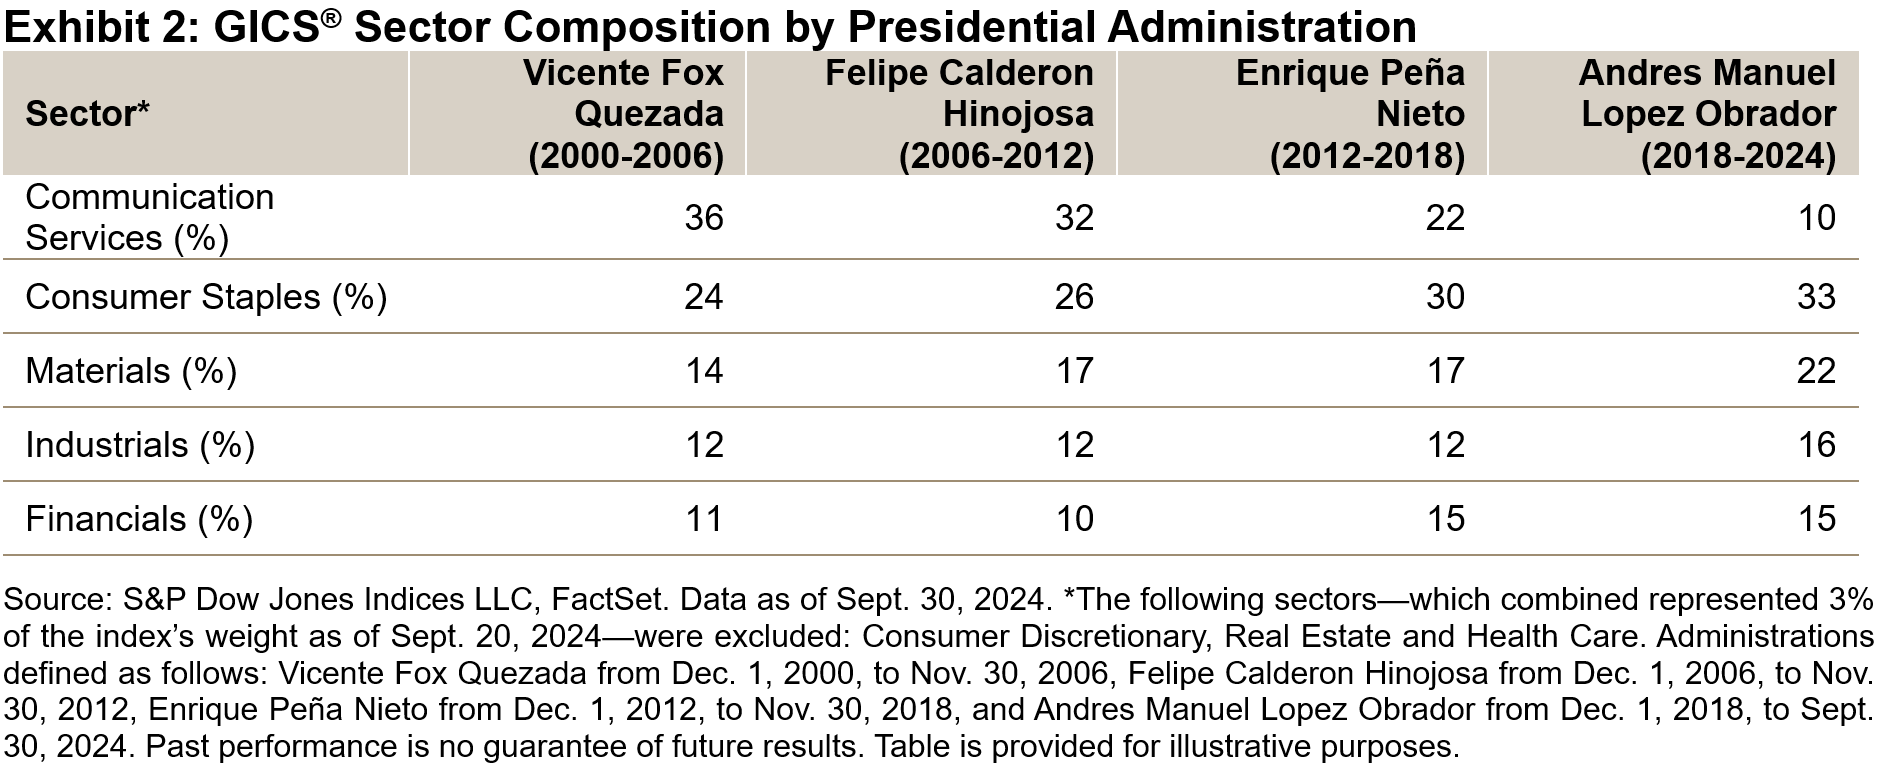
From a sector perspective, there have been notable changes in the largest sectors these past six years. Communication Services continued to shrink in share, from a high of 37% in 2006 to 10% in 2024. In the period from 2018-2024, Materials and Industrials gained 6% and 4%, respectively, while Financials decreased by 3% and Consumer Staples remained flat at 33%.

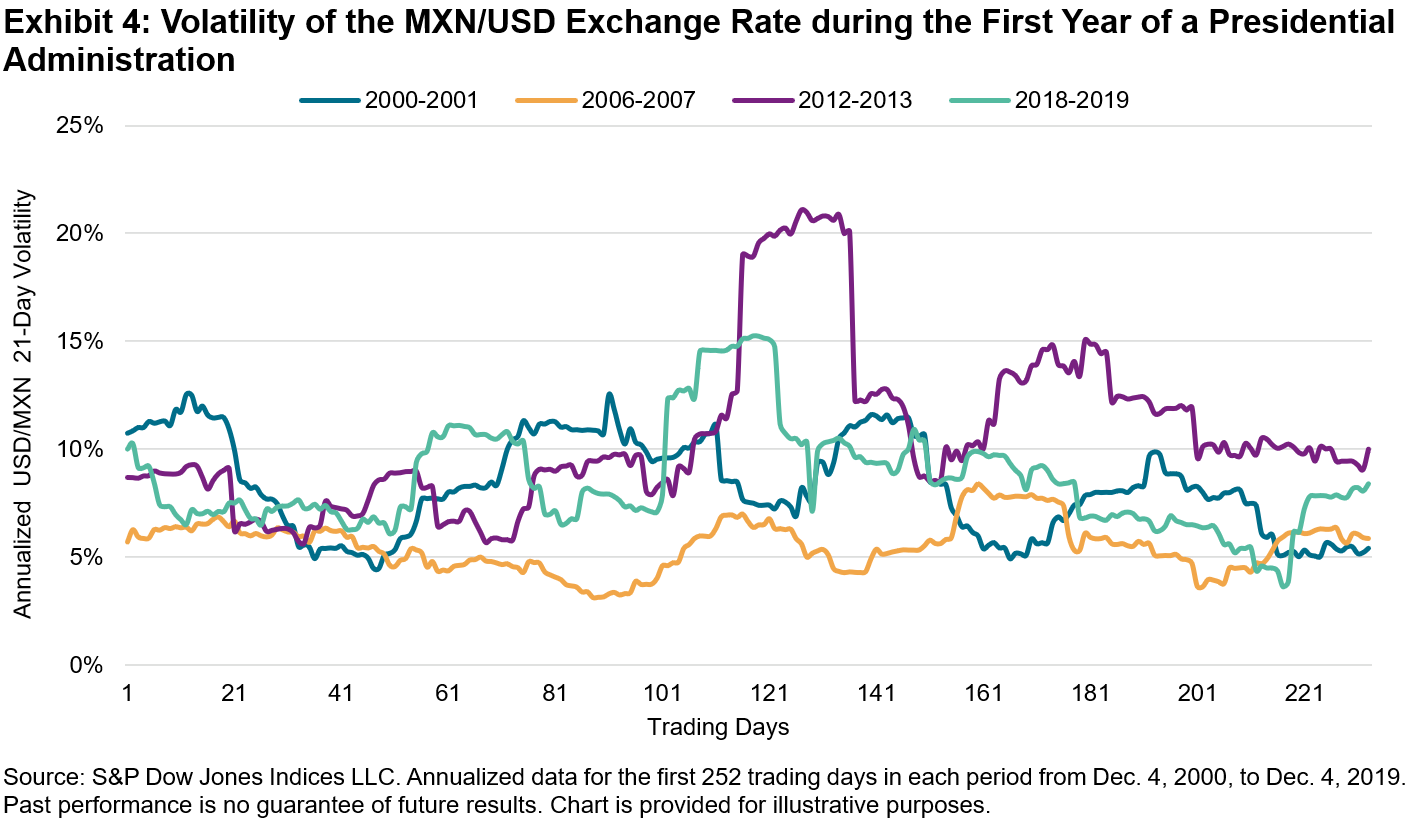
The first year of a new administration in Mexico tends to be eventful, as there are often major changes in policy. In addition, this can be exacerbated by external events, such as a global financial downturn or the U.S. presidential elections.

In Exhibit 3 we see the cumulative performance of the S&P/BMV IRT during the first year of each administration since 2000. Though each administration faced its own challenges, one thing they all have in common is that the S&P/BMV IRT ended their first year with positive returns.

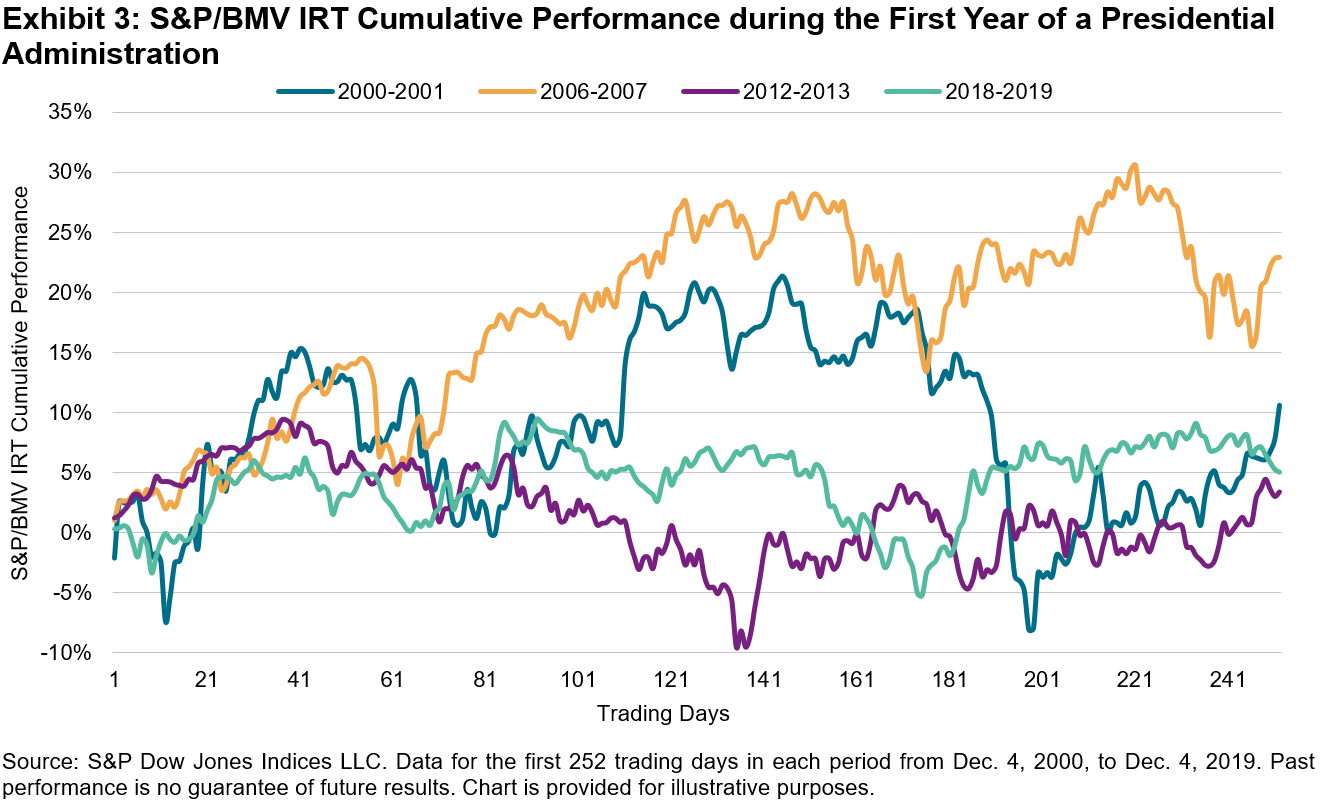
Exhibit 4 illustrates the exchange rate volatility during the first year of each administration. While many factors influence exchange rates it is interesting that the level of MXN/USD volatility ended each administration’s first year roughly where it started, despite some short-term bouts of volatility during the year. The most volatile first year of an administration was seen in the period from 2012-2013, where annualized 21-day volatility reached 21%.

In conclusion, an administration’s effect on the equity market and the exchange rate in Mexico is better observed from a long-term perspective, as high levels of volatility, which tend to be short-lived, can create uncertainty but not necessarily mark a trend. Insights gained from these analyses could help market participants make informed decisions in the face of change.

The posts on this blog are opinions, not advice. Please read our Disclaimers.

Creative Cacophony

Contributor Image
Anu Ganti

Head of U.S. Index Investment Strategy

S&P Dow Jones Indices

The ETF industry has hit a major milestone, reaching USD $10 trillion in assets under management in the U.S. Commentary on the rise of index-based or passive investing may be widespread, but it is harder to find estimates of how truly “passive” their holders are. Secondary market volumes offer a fascinating, important and complementary perspective.

Our new paper “The Liquidity Landscape: Trading Linked to S&P DJI Indices,” shows that volumes associated with listed products tracking S&P DJI’s indices dramatically exceed the corresponding USD 6.6 trillion level of listed index-linked assets,1 with volumes almost doubling from four years ago to exceed USD 246 trillion in 2023.2 Index-based products are increasingly among the most traded securities, with ETFs representing 42% of the most-traded U.S.-listed equity securities by U.S. dollar volumes as of 2023.

The S&P 500® was the primary contributor to the volumes cited above and was associated with the largest number of distinct products. Volumes associated with the S&P 500 totaled approximately USD 224 trillion, the bulk of which was contributed by options and futures, as we observe from the left side of Exhibit 1. The right side of the exhibit shows volumes in indices derived from the S&P 500 such as our suite of sector or factor indices.

The S&P 500 ecosystem stands out because of its liquidity globally. The network of products tied to the S&P 500 or indices derived from it can form an interconnected web of pricing and trading activity through arbitrage mechanics or risk transference. For example, market makers in S&P 500-linked ETFs, which are listed in markets ranging from New Zealand to Brazil, might use futures to hedge their inventory positions. Or a holder of S&P 500 sector ETFs can weight them accordingly to replicate exposure to the benchmark. This same holder could use options to manage their downside risk or generate income from call overwriting. The resulting benefits in transparency and pricing efficiency stemming from these connections demonstrate the potential network effects of liquidity.

To better understand the behavior of such users of index-linked products, we can divide assets by volumes to arrive at an estimate of the average holding period among market participants.4 For example, for a fund with assets of USD 100 million, an aggregate annual trading volume of USD 200 million would imply an average holding period of six months. Exhibit 2 shows the distribution of assets across the S&P DJI universe by their respective trading frequencies: products with an average holding period of more than one year, one month to one year, one week to one month, and those with an average holding period of less than one week.

Exhibit 2 illustrates several notable observations. First, approximately 60% of assets were associated with products with an average holding period of less than one month, confirming the presence of some relatively active users. Second, options and futures along with leveraged ETPs tended to have shorter average holding periods, indicating heavier usage of these product types among shorter-frequency investors. Finally, while ETPs tended to have longer holding periods, only roughly 20% of ETP assets were associated with products with an average holding period of more than one year. The holders of index funds should not always be equated with “passive” investors.

The S&P DJI ecosystem has benefited from the network effects of liquidity offered by market participants operating on a wide range of trading frequencies, resulting in a creative cacophony of perspectives. This may provide long-term investors with greater confidence in the prices they experience, while more active traders may benefit from increased liquidity. Find out more about how our robust trading ecosystems are promoting price transparency, market efficiency and confidence all around the world in “The Liquidity Landscape: Trading Linked to S&P DJI Indices.”

1 See S&P Dow Jones Indices Annual Survey of Assets, Dec. 31, 2023.

2 See “A Window on Index Liquidity: Volumes Linked to S&P DJI Indices,” S&P Dow Jones Indices, Aug. 29, 2019.

3 Index equivalent trading volume (IET) reflects the economic exposure to the index that is being transacted at the time a trade occurs; it is determined by the instrument’s short-term responsiveness to movements in the underlying index. See Appendix of “The Liquidity Landscape: Trading Linked to S&P DJI Indices”, S&P Dow Jones Indices, Sept. 16, 2024.

4 We caution that any security can have a mix of investors who trade with different frequencies.

The posts on this blog are opinions, not advice. Please read our Disclaimers.

What Makes the S&P/B3 Ingenius Index Different?

See how the S&P/B3 Ingenius Index provides the Brazilian market with a dynamic lens for tracking global innovation. 


The posts on this blog are opinions, not advice. Please read our Disclaimers.

What Makes the S&P/BMV Ingenius Index Different?

See how the S&P/BMV Ingenius Index provides the Mexican market with a dynamic lens for tracking global innovation.

The posts on this blog are opinions, not advice. Please read our Disclaimers.

A Grain of Wisdom: S&P DJI Launches S&P GSCI Minneapolis Wheat and S&P GSCI Composite Wheat

Contributor Image
Rebecca Kaufman

Associate Director, Commodities and Fixed Income Tradables

S&P Dow Jones Indices

With Oktoberfest just around the corner, S&P DJI has announced the launch of the S&P GSCI Minneapolis Wheat and S&P GSCI Composite Wheat. S&P DJI recently acquired the rights to futures data from Minneapolis Grain Exchange (MGEX), on which Minneapolis Wheat futures contracts are traded.

Minneapolis Wheat is one of the three most actively traded wheat futures contracts in the U.S.; the other two being Chicago Wheat and Kansas City Wheat, both of which are current constituents of the broad-based benchmark, the S&P GSCI. The futures contracts are named after the primary exchange on which they are traded:  Minneapolis Grain Exchange (MGEX), Chicago Mercantile Exchange (CME) and the Kansas City Board of Trade (KCBT, now part of CME). The futures contracts have vastly different liquidity profiles, with Chicago Wheat being the most actively traded of the three.

The specific wheat classes underlying the contracts are differentiated by factors such as when and where they are planted, the protein content and uses. Minneapolis Wheat, or hard red spring wheat, is the second most produced wheat in the U.S., with 12.7 million metric tons (MMT) produced in 2023. It is planted in the Northern Great Plains region of the U.S. in the spring and harvested in the summer. Its high protein content of 14.2%, adjusted to a standard moisture basis of 12% (12% mb) in 2023, makes it ideal for making breads, rolls and pasta, which are staple components of many consumer diets. It is also frequently mixed into flour blends to enhance quality.

Exhibit 2 shows the production levels for the different wheat classes, and Exhibit 3 compares the protein content.

Minneapolis Wheat had the highest protein content and the second-highest production levels in the U.S. However, its futures contracts represented only 5.5% of the total quantity traded. The S&P GSCI Minneapolis Wheat offers investors greater insight into this under-utilized commodity and its performance.

In addition to the S&P GSCI Minneapolis Wheat, S&P DJI has also launched the S&P GSCI Composite Wheat. The S&P GSCI Composite Wheat includes all three wheat contracts and uses the same production-weighted methodology of the S&P GSCI by weighting each component based on the five-year world production average for wheat and the total quantity traded for each contract (see Exhibit 1). The index rebalances annually in January during the designated roll period.

On an annualized basis, the S&P GSCI Minneapolis Wheat’s back-tested performance has shown lower volatility than the S&P GSCI Wheat (which measures Chicago Wheat) and the S&P GSCI Kansas Wheat, resulting in lower annualized back-tested volatility for the S&P GSCI Composite Wheat, compared to the S&P GSCI All Wheat, which only includes Chicago Wheat and Kansas City Wheat contracts (see Exhibit 4).

Including the S&P GSCI Minneapolis Wheat in the S&P GSCI Composite Wheat increases exposure to a domestic wheat class that has differentiated returns, volatility and characteristics.

Recent wheat performance, based on back-tested data of the S&P GSCI Composite Wheat, was down 24% year-over-year as of Aug. 22, 2024. However, wheat pricing has faced several anomalous headwinds, including the beginning of the Russia-Ukraine conflict in February 2022, which shifted the purchasing behavior of key U.S. wheat importers, and historically high U.S. wheat production. The USDA forecasts the U.S. will produce 1,982 million bushels in the 2024-2025 marketing year, an eight-year high.

U.S. wheat prices can also be seen as a normalization of the high wheat prices in May 2022 (see Exhibit 5) due to the COVID-19 pandemic, the Russia-Ukraine conflict and adverse weather conditions. Meanwhile, wheat remains a staple grain in many diets and demand could stabilize or increase as populations grow, developing countries continue to diversify diets and weather conditions turn unfavorable. Wheat prices are also highly dependent on the performance of substitutable grains, such as soybeans and corn.

Minneapolis Wheat is not a current constituent of the S&P GSCI; however, the S&P GSCI Minneapolis Wheat and S&P GSCI Composite Wheat are both part of the S&P GSCI series of indices. The S&P GSCI is the first major investable commodity index and measures the most liquid commodity futures, which provides diversification with low correlation to other asset classes.

For more information about the S&P GSCI Series and its methodology, please visit https://www.spglobal.com/spdji/en/index-family/commodities/.


The posts on this blog are opinions, not advice. Please read our Disclaimers.