Get Indexology® Blog updates via email.

In This List

Beyond Diversification: U.S. Equity and Sector Relevance in Mexico

Indexing Covered Calls for Insurance

Equal Weight Indexing in Canadian Equities

Maintaining Low Tracking Error: The Construction of the S&P 500 ESG Index

Explaining Changes to Select Sector Indices

Beyond Diversification: U.S. Equity and Sector Relevance in Mexico

Contributor Image
Cristopher Anguiano

Associate Director, U.S. Equity Indices

S&P Dow Jones Indices

Many investors tend to overweight domestic equities, a phenomenon known as home bias. Mexican investors may be inadvertently neglecting the breadth of global equity markets by focusing primarily on local options. The significant representation of the U.S. equity market means that some investors risk overlooking a significant portion of the global equity market and the potential diversification benefits from incorporating U.S. equity exposures.

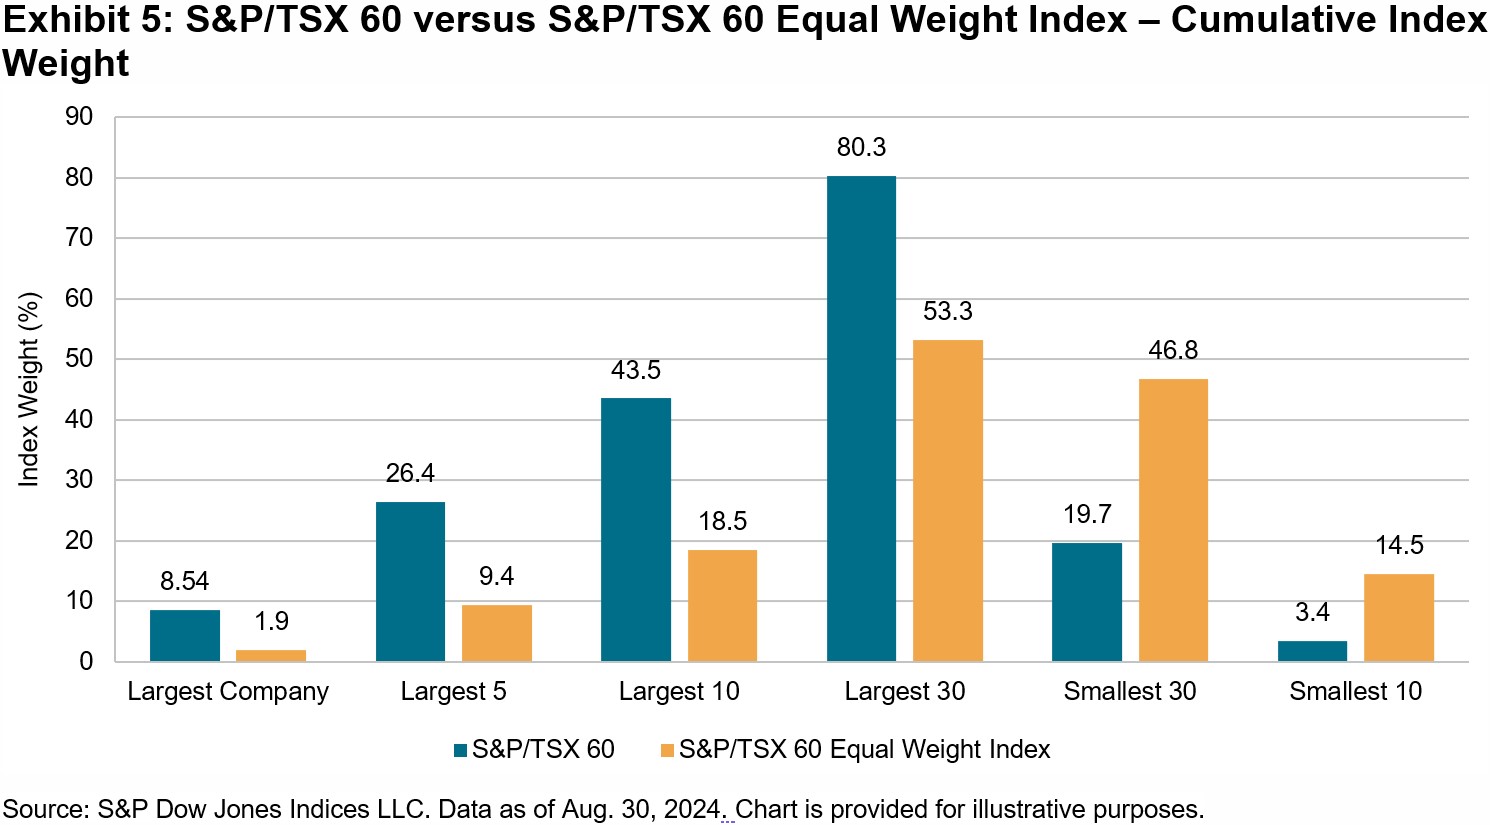
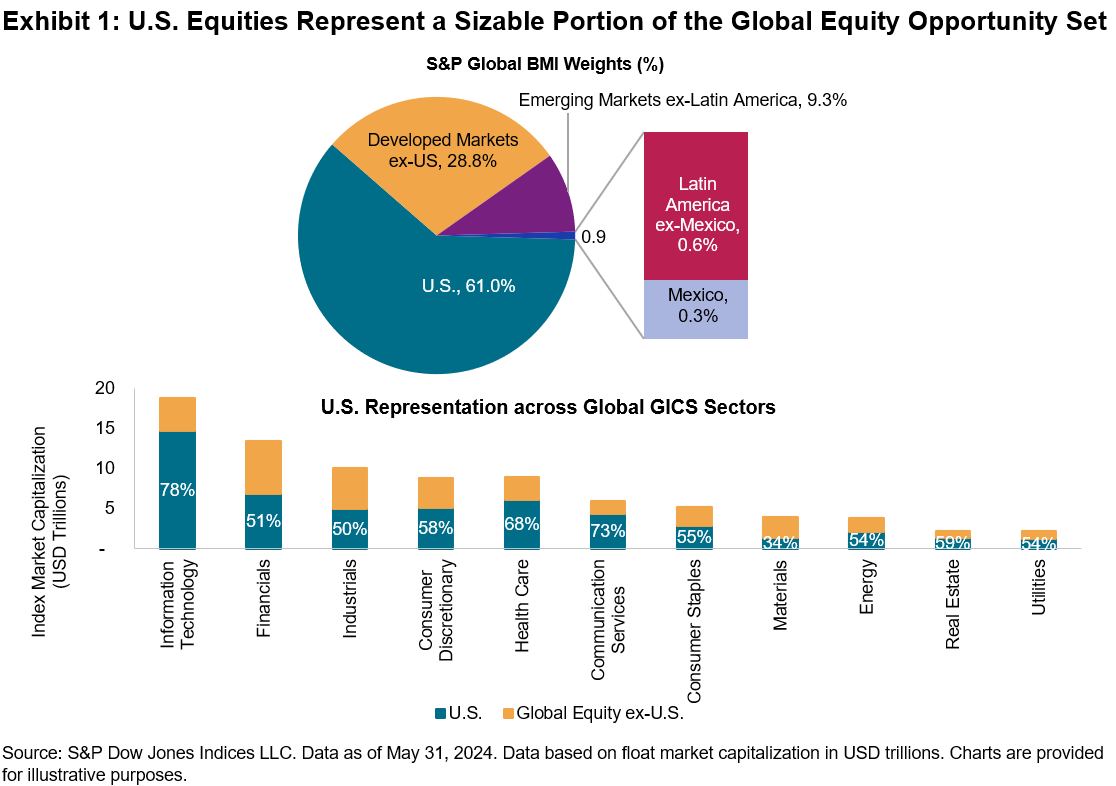
The global relevance of the U.S. equity market can be illustrated by its size: U.S.-domiciled companies represent around 60% of the global equity market capitalization, as represented by the S&P Global BMI. This representation is far higher than the weight of Latin America (0.9%) and Mexico (0.3%). As a result, the consideration of U.S. equities can help investors gain a clearer understanding of global equity performance and support the expression of strategic and tactical views. This is also relevant at a sector level: U.S. companies account for most of the global equity opportunity set in 10 out of 11 global GICS® sectors.

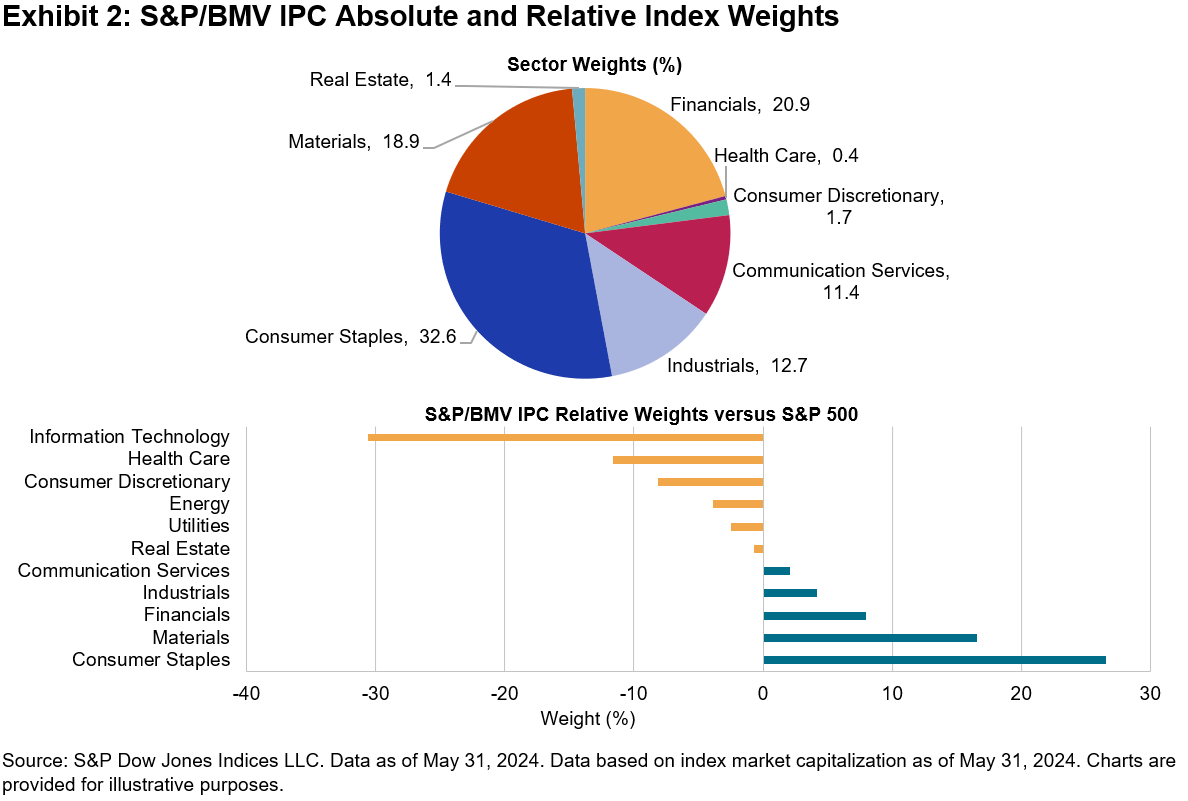
To further illustrate the relevance of U.S. equity exposure, we compare the distinct sectoral compositions of the S&P/BMV IPC and the S&P 500®. The S&P/BMV IPC tracks the performance of the largest and most liquid Mexican stocks. Exhibit 2 shows that, as of May 2024, the index had significant weightings in Consumer Staples, Financials and Materials. Conversely, the S&P 500 had higher exposure to Information Technology, Health Care, Consumer Discretionary, Energy and Utilities. Incorporating U.S. equities could therefore help Mexican investors to diversify domestic sector biases.

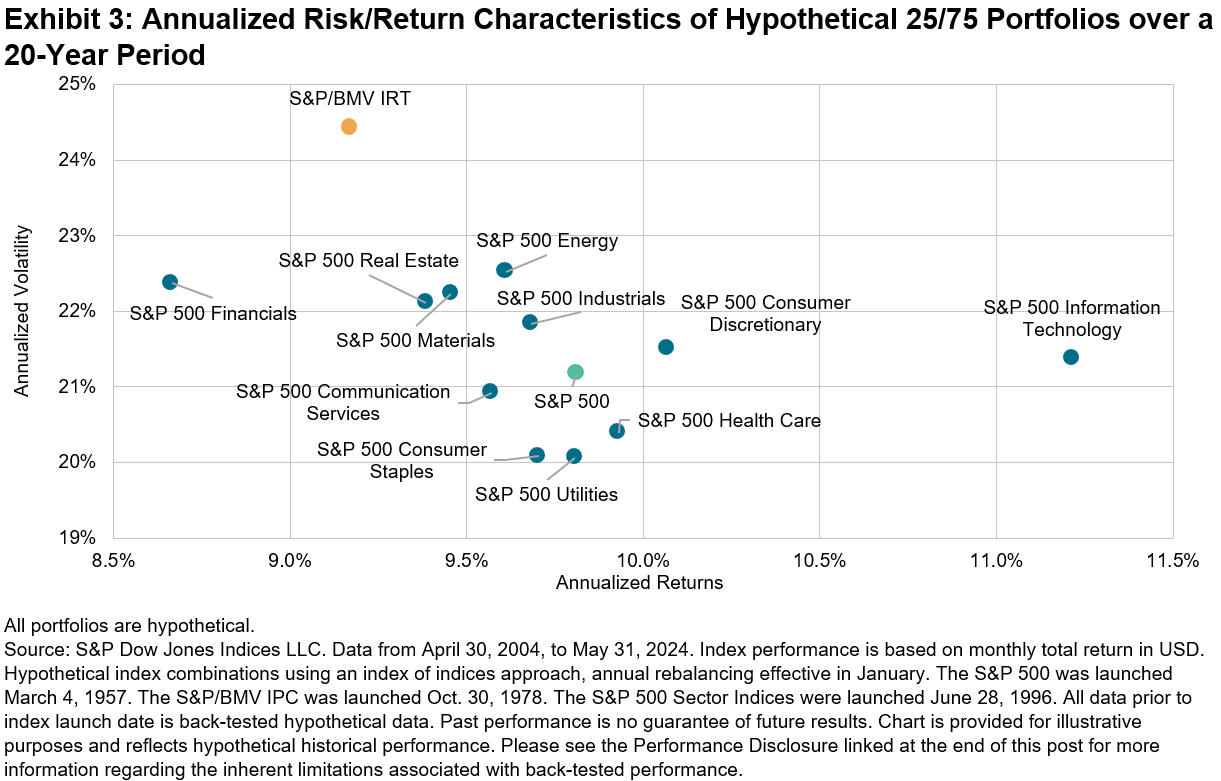
The performance of U.S. equities has historically presented potential diversification benefits to Mexican investors. We demonstrate this by building hypothetical portfolios that blend the S&P 500 and its GICS sector indices with the S&P/BMV IRT, allocating 25% to U.S. equities and 75% to local equities, rebalanced annually. Exhibit 3 indicates that this hypothetical approach yielded higher performance and lower volatility, historically, thereby improving the hypothetical portfolios’ long-term risk-adjusted returns.

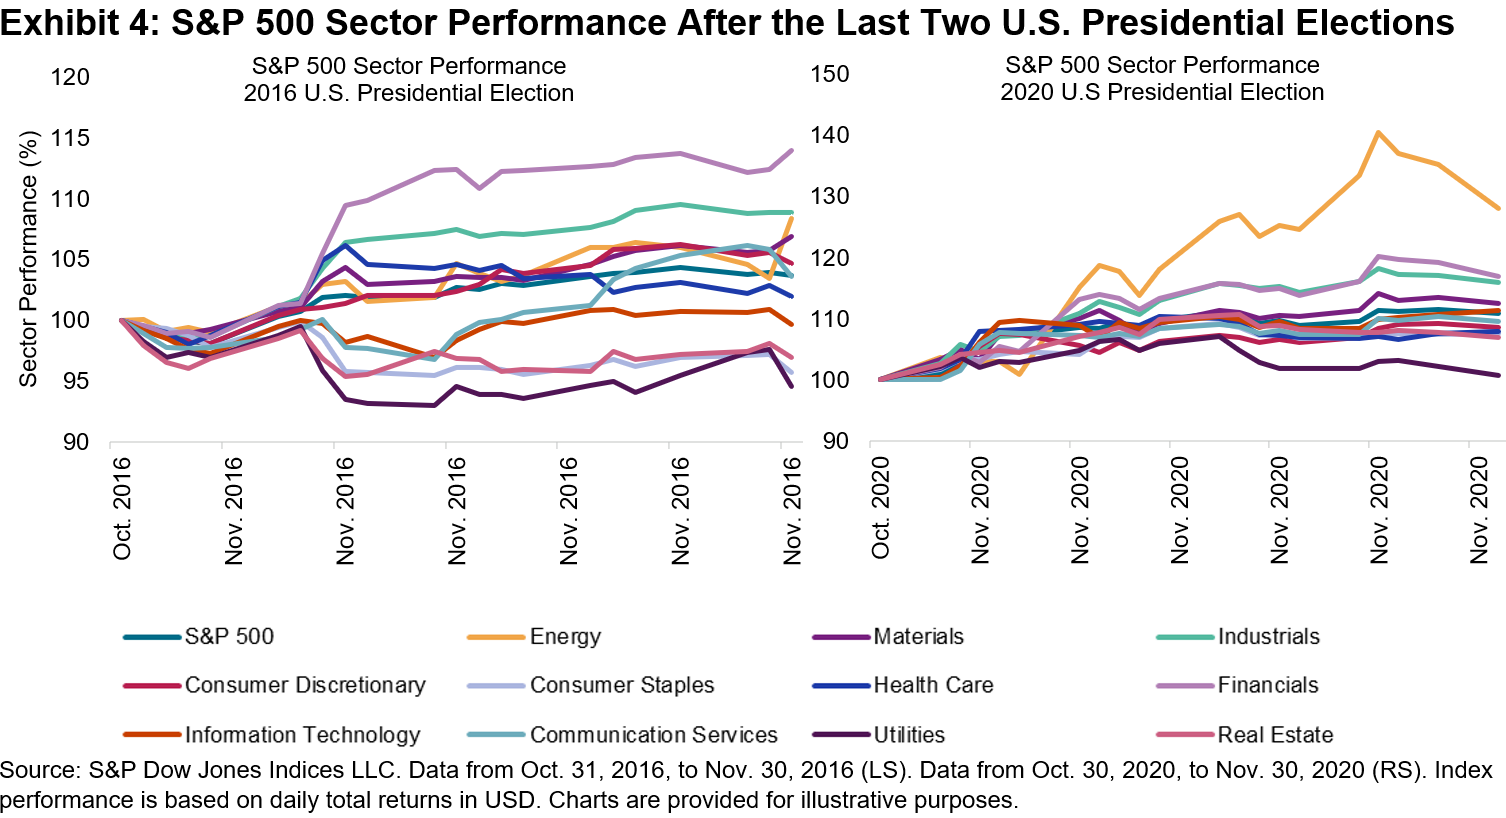
Beyond the strategic relevance of U.S. equities, the historical performance of U.S. sectors around U.S. Presidential elections has presented the idea of U.S. sectors having tactical relevance. Historically in election years, sector performance spreads have widened in November, as Exhibit 4 illustrates. While the S&P 500’s overall performance remained relatively stable in recent elections, sectoral fluctuations contributed to nearly half of the index’s monthly dispersion—a measure to determine the spread of stock returns within the index, highlighting the importance of sectors to express views.

The U.S. equity market represents a sizable portion of the global equity opportunity set. Incorporating U.S. equities not only potentially offers Mexican investors a way to alleviate domestic sectors biases, it has historically enhanced risk-adjusted returns. Additionally, U.S. sectors serve as the basis for market strategies and positioning, and our sector indices offer a measure for investors seeking to express both tactical and core portfolio views.

The posts on this blog are opinions, not advice. Please read our Disclaimers.

Indexing Covered Calls for Insurance

How can an emphasis on rules-based predictability provide greater clarity in risk and return assessment? In an interview with Insurance Asia News, S&P DJI’s Priscilla Luk explores how an index-based approach to covered calls may help insurance companies to mitigate the impact of market volatility. 

The posts on this blog are opinions, not advice. Please read our Disclaimers.

Equal Weight Indexing in Canadian Equities

Contributor Image
Anna Mittra

Associate Director, Global Exchanges

S&P Dow Jones Indices

The S&P 500 Equal Weight Index has exhibited notable long-term outperformance compared to the market-cap-weighted S&P 500—a phenomenon that has been researched over the years. Unlike the headline S&P 500, where larger companies exert a greater influence, the S&P 500 Equal Weight Index assigns the same weight to each of its constituents, regardless of their market cap. This approach increases the weight in smaller companies, allowing them to have a more significant impact on the index’s overall performance.

We find a similar pattern in the Canadian market, where the S&P/TSX 60 Equal Weight Index has outperformed the S&P/TSX 60 over the long term (see Exhibit 1). Despite periods where the S&P TSX 60 outperformed due to the dominance of its largest constituents, the S&P/TSX 60 Equal Weight Index has historically provided a more balanced view of the Canadian equities market and less concentration risk, leading to enhanced long-term returns.

Performance Summary

As shown in Exhibit 1, the S&P/TSX 60 Equal Weight Index has outperformed the S&P TSX 60 over the long term by a cumulative 24%, approximately, with a notable degree of outperformance occurring during market recoveries, particularly following the Global Financial Crisis and COVID-19 pandemic.

The S&P/TSX 60 Equal Weight Index consistently outperformed the S&P/TSX 60 across various time frames at a roughly similar level of volatility, leading to enhanced risk-adjusted returns (see Exhibit 2).

A quarterly performance analysis (see Exhibit 3) shows that the S&P/TSX 60 Equal Weight Index has outperformed the cap-weighted index at a rate of 52% with an average margin of outperformance (1.69%) exceeding that in underperforming quarters (-1.35%), underscoring the index’s effectiveness in outperforming across different market cycles.

 Reduced Sector and Single Stock Concentration

 In terms of sector weights, the S&P/TSX 60 Equal Weight Index offers a more diversified representation of the Canadian market. This contrasts with the S&P/TSX 60, which reflects the Canadian equity market’s heavy weighting toward the Financials sector, with substantial weight distributed to the big five banks. This sector concentration can lead to performance that is highly driven by the financial market conditions and regulatory changes affecting this industry. In contrast, the S&P/TSX 60 Equal Weight Index provides more balanced sector profile, giving larger representation to other sectors such as Consumer Discretionary, Utilities, and Real Estate (see Exhibit 4). This broader sector profile has historically enhanced performance during periods when sectors other than Financials have outperformed, provide market participants with a more comprehensive view of the market.

Additionally, Exhibit 5 highlights key differences in constituent level weight distribution. The S&P/TSX 60 is heavily tilted toward its largest companies, with the top five making up 25.8% of the index weight. Meanwhile, the S&P/TSX 60 Equal Weight Index distributes weight more evenly, resulting in only 9.3% for the same group. This structure leads to different performance dynamics, with the equal weight index’s performance being more influenced by smaller size constituents, rather than being driven by larger names.

Conclusion

Despite the limited use of equal weight strategies in Canadian equities at present, the high level of stock and sector concentration in the market suggests there are potential merits of considering an equal weight approach to indexing. This hypothesis is further supported by the historical outperformance of the S&P/TSX 60 Equal Weight Index compared to its market-cap-weighted counterpart over both short- and long-term periods.

The posts on this blog are opinions, not advice. Please read our Disclaimers.

Maintaining Low Tracking Error: The Construction of the S&P 500 ESG Index

Contributor Image
Maria Sanchez

Director, Sustainability Index Product Management, U.S. Equity Indices

S&P Dow Jones Indices

When it comes to integrating environmental, social and governance (ESG) factors into investment strategies, market participants may be interested in deviations from the benchmark. Tracking error is a widely used metric that helps measure the size of these deviations. Improving the ESG profile of a composition often means accepting a higher tracking error due to screening or selection processes. Investors typically seek ESG indices that offer similar risk/performance profiles to traditional benchmarks.

It is important to note that for the S&P 500® ESG Index there is no guarantee of a specific level of tracking error, as that is not a target in the optimization process. This is a consequence of the index construction, which maintains similar sector and industry weights as the benchmark without drastically altering the composition’s risk profile. As a result, it has historically maintained relatively low tracking error, with the index consistently mirroring the benchmark.

The S&P 500 ESG Index reduces deviations from the S&P 500 through its methodology.1

  • Objective: The S&P 500 ESG Index measures the performance of securities from the S&P 500 that meet sustainability criteria and maintains similar overall industry group weights as the underlying index.
  • Construction: It applies sustainability eligibility criteria then uses S&P Global ESG Scores to select constituents. It targets 75% of the market cap within each industry group and chooses the top ESG performers, seeking sector neutrality.2

While there may be some deviations from the underlying index due to screening and selection based on criteria such as certain business involvement with specific thresholds, violations to global standards such as the United Nations Global Compact (UNGC), and low ESG scores, the S&P 500 ESG Index  demonstrated a low sector active share3 of 4.2% on average from its launch on Jan. 28, 2019, to April 30, 2024. This implementation of the methodology helps ensure consistent tracking of the benchmark (see Exhibit 1).

Tracking error measures the size of the index performance differential over a certain period. In other words, it is the annualized standard deviation of the difference between the performance of the S&P 500 ESG Index and the S&P 500 over a period. Tracking error is an important metric for market participants, as it can indicate whether they are obtaining the desired market exposure.

The S&P 500 ESG Index has historically achieved comparable performance to the S&P 500, thanks to its similar industry group weights. As of April 30, 2024, the annualized tracking error for the 3-year period was 1.399% (see Exhibit 2), demonstrating a relatively low deviation.

To review how this metric has evolved over time, Exhibit 3 shows that the 3-year tracking error of the S&P 500 ESG Index compared to the S&P 500 has consistently remained below 2%, indicating relatively low deviation.4

S&P Dow Jones Indices offers a range of indices that consider different levels of integration of ESG factors to reflect a wide range of investment needs. These include the S&P 500 ESG Leaders Index and the S&P 500 ESG Elite Index. Typically, the stricter the sustainability criteria are, the higher the expected tracking error.

Conclusion

The S&P 500 ESG Index’s construction maintains similar sector and industry weights as the benchmark, allowing the integration of ESG scores while maintaining similar sector exposures, which has resulted in a relatively low tracking error, even without using an optimizer. Join us in celebrating the five-year anniversary of the S&P 500 ESG Index and learn more about this flagship index.

1 For more information, please see the S&P ESG Index Series Methodology.

2 For more information, please see Rowton, Stephanie, “Sector Neutrality: An Essential Mechanism within the S&P 500 ESG Index,” S&P Dow Jones Indices LLC, Sept. 9, 2024.

3 Sector active share is a specific application of the broader concept of active share, which measures the degree to which a portfolio’s sector allocations differ from those of its benchmark. It is calculated by taking the sum of the absolute differences between the portfolio and the benchmark’s sector weights, then dividing by two.

4 Low tracking error is typically less than 1%. This indicates that the composition closely follows the benchmark with minimal deviation. Medium tracking error is typically between 1% and 5%. High tracking error is typically greater than 5%. These ranges can vary depending on the specific context and investment strategy.

The posts on this blog are opinions, not advice. Please read our Disclaimers.

Explaining Changes to Select Sector Indices

Contributor Image
Hamish Preston

Head of U.S. Equities

S&P Dow Jones Indices

Launched in the late 1990s, the Select Sector® indices measure the performance of S&P 500® sectors; each S&P 500 company is assigned to one of the 11 Select Sector indices, based on the Global Industry Classification Standard (GICS®) framework. The indices serve as the basis for an ecosystem of financial products, which in turn allow market participants to express views.

S&P Dow Jones Indices (S&P DJI) recently announced changes to the Select Sector index methodology, which will go into effect prior to the open on Sept. 23, 2024. Here’s an overview of the upcoming changes to the quarterly rebalance process.

The Select Sector indices are capped market capitalization weighted.

A key feature of the Select Sector indices is that they employ a capping mechanism to ensure diversification among the companies within each index. The capping thresholds are intended to reflect certain diversification requirements imposed on regulated investment companies under the U.S. Internal Revenue Code and the Investment Company Act of 1940.1

At each quarterly rebalance, companies are initially weighted by float market capitalization (FMC). Modifications are made to these FMC weights if a) any company has a weight greater than 24%, or b) the sum of the companies with weights greater than 4.8% exceeds 50% of the total index weight. These rebalance thresholds are unchanged by the upcoming methodology changes that take effect on Sept. 23, 2024.

The quarterly capping process is changing.

If companies with FMC weights greater than 4.8%—“larger companies”—account for more than 50% of the index weight, the current capping mechanism reduces the weight of the smallest company in the group to 4.5%. The process is repeated iteratively, if necessary, until there are no breaches to the thresholds. Full details of the capping mechanism as of the publication date (the “Legacy Capping Mechanism”) can be found in the S&P U.S. Indices Methodology.

The new approach (the “New Capping Mechanism”) would handle such a breach differently: the aggregate weight of the larger companies will be reduced to 45% and the larger companies’ individual weights will be determined by their relative proportions, after checking for any breaches in the single company cap. The minimum index weight of each of the larger companies will be 4.5%. The recent announcement provides the full details.

Market dynamics have impacted Select Sector index composition in 2024.

The rationale for the change to the capping mechanism is that the impact of market dynamics could result in the Legacy Capping Mechanism causing “flip flops” in index weights. This was particularly evident in the Technology Select Sector index in 2024. For example, Microsoft, Apple and Nvidia each had FMC weights greater than 4.8% and their collective FMC weight exceeded 50% at the March 2024 reference date. As the smallest of the three companies at the time, Nvidia’s weight was reduced to 4.5%.2

A similar situation occurred in June 2024, except Nvidia had become the second largest of the group, reflecting investors’ expectations of the impact of AI on the company’s growth prospects. Accounting for changes between the rebalance reference date and rebalance effective date, Apple—as the smallest of the group—had its index weight reduced by 17% at the June rebalance, while Nvidia’s weight increased by 15% to around 21%. These changes meant that the index’s quarterly rebalance turnover in June was the highest since September 2018, when various companies moved to Communications Services as part of a GICS structure update.

The New Capping Mechanism better retains FMC proportions.

The New Capping Mechanism is designed to better retain FMC proportions among index constituents, while still being mindful of diversification thresholds. For example, Exhibit 2—taken from the impact analysis that was included in the public consultation—shows the hypothetical weights of several companies in the Technology Select Sector index under the New Capping Mechanism versus the Legacy Capping Mechanism as of the March and June 2024 rebalance reference dates. The application of the new approach would have reduced the potential for “flip flops” in index composition.

Although we will have to wait to see the exact composition of the Select Sector indices after the September rebalance, upcoming changes reflected in the New Capping Mechanism provide an example of how index methodologies can evolve in light of market dynamics.

1 For more information on the capping thresholds, please refer to the Regulatory Capping Requirements section of S&P Dow Jones Indices’ Equity Indices Policies & Practices Methodology.

2 Accounting for the impact of price changes, applicable corporate actions, index membership, shares outstanding and IWFs between the rebalance reference date and rebalance effective date, Nvidia’s index weight prior to the open on March 18, 2024, was 4.55%.

The posts on this blog are opinions, not advice. Please read our Disclaimers.