


How has the size and significance of passive investing solutions changed in recent years? In an interview at IMpower Incorporating FundForum, S&P DJI’s Tim Edwards discusses the growth trajectory of passive approaches across equity and fixed income markets, as well as the insights that SPIVA Scorecards can offer and why that research matters.
The posts on this blog are opinions, not advice. Please read our Disclaimers.The Rise of Passive Investing with Indices
Fixed Maturity in Focus: Constructing a Ladder for Stability and Yield
Integrating Sustainability: 5 Years of the S&P 500 ESG Index
A Window on S&P/ASX Index Liquidity
Celebrating 10 Years of the S&P 500 Quality Index
The Rise of Passive Investing with Indices
Fixed Maturity in Focus: Constructing a Ladder for Stability and Yield

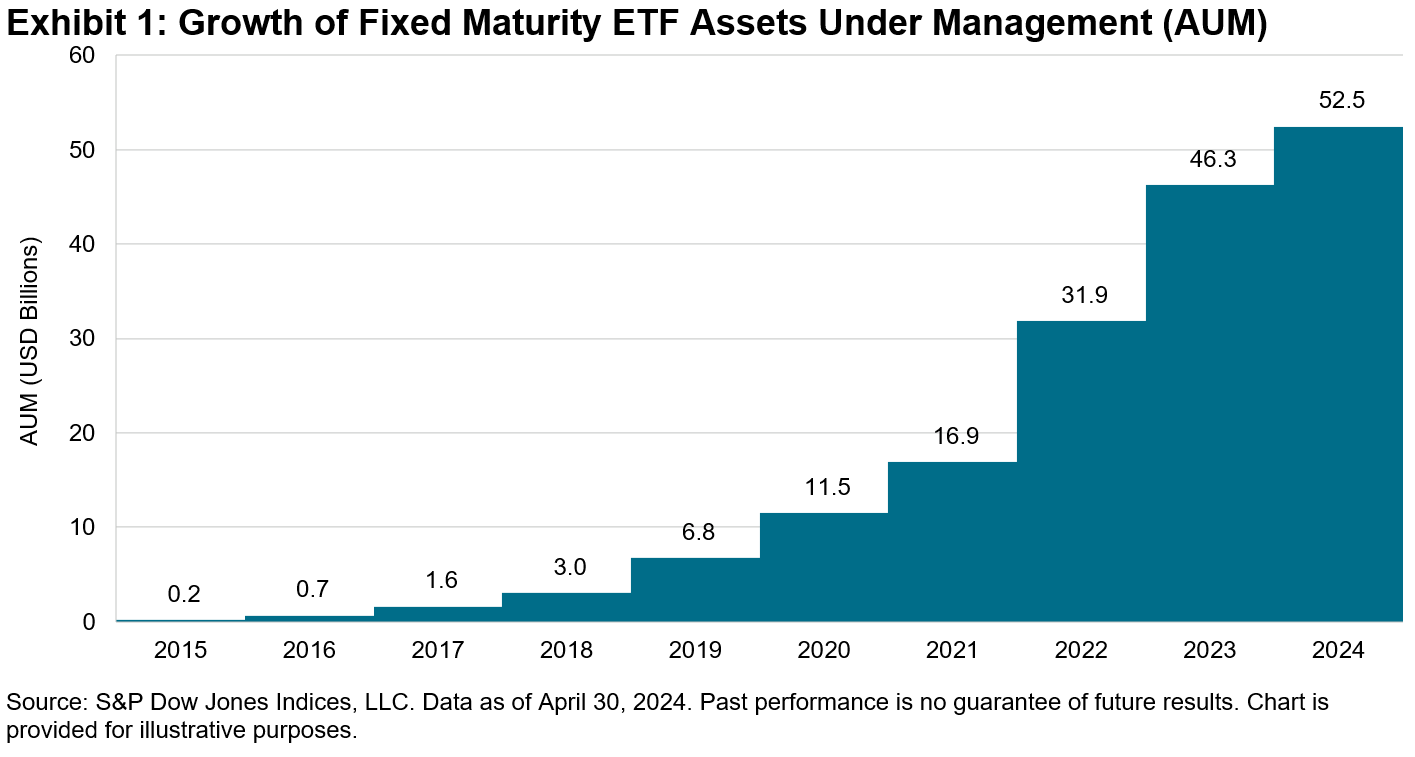
As fixed income index solutions continue to evolve, one notable innovation has been that of fixed maturity indices. Fixed maturity indices have existed in the U.S. for over 10 years, where growth and adoption have increased over that time. The market is newer in Europe, where adoption has taken shape over the last 12 months. As this market expands across geographies and exposures, we take a closer look at the construct and the utilization of the fixed maturity index.
What is a fixed maturity index? How is it different from a typical broad-based fixed income index?
A fixed maturity index is an index that holds bonds that expire within the same maturity year or period. For example, the iBoxx® USD Corporates 2029 Index holds only investment grade bonds that mature in the year 2029. It draws on the same broad-based, diversified investment grade corporate universe that represents the beta of the market, but filters for a specified year of maturity. In 2029, the final year of the index, maturing bond proceeds are invested into money market instruments rather than investment grade bonds at rebalance; by the end of the expiration year, the index will have converted to an index of money market instruments and subsequently expire. In this way, one might refer to a fixed maturity index as having a maturity year (in this case, 2029), drawing a contrast to the typical construct of a fixed income index (which is perpetual in nature), as maturing proceeds are typically reinvested into the underlying securities and the original asset class exposure is constantly maintained.
Why is it interesting that a fixed income index “matures”?
The maturing nature of a fixed maturity index draws similarities to the profile of an individual bond, which has a maturity year where one may expect a return of principal. A scheduled maturity that is known in advance may be useful in financial planning where the timing of cash flow needs is certain. In the case of a fixed maturity index, one has certainty on a “maturity” year, but the exposure is not just one bond, it is an index of bonds. So, a fixed maturity index provides investors with a maturity date while still allowing diversification benefits of a broad-based fixed income benchmark. Fixed maturity indices are typically established with multiple maturity years, e.g. iBoxx USD Corporates Fixed Maturity Indices span the years 2027-2035.
How are fixed maturity indices utilized? What is a bond ladder?
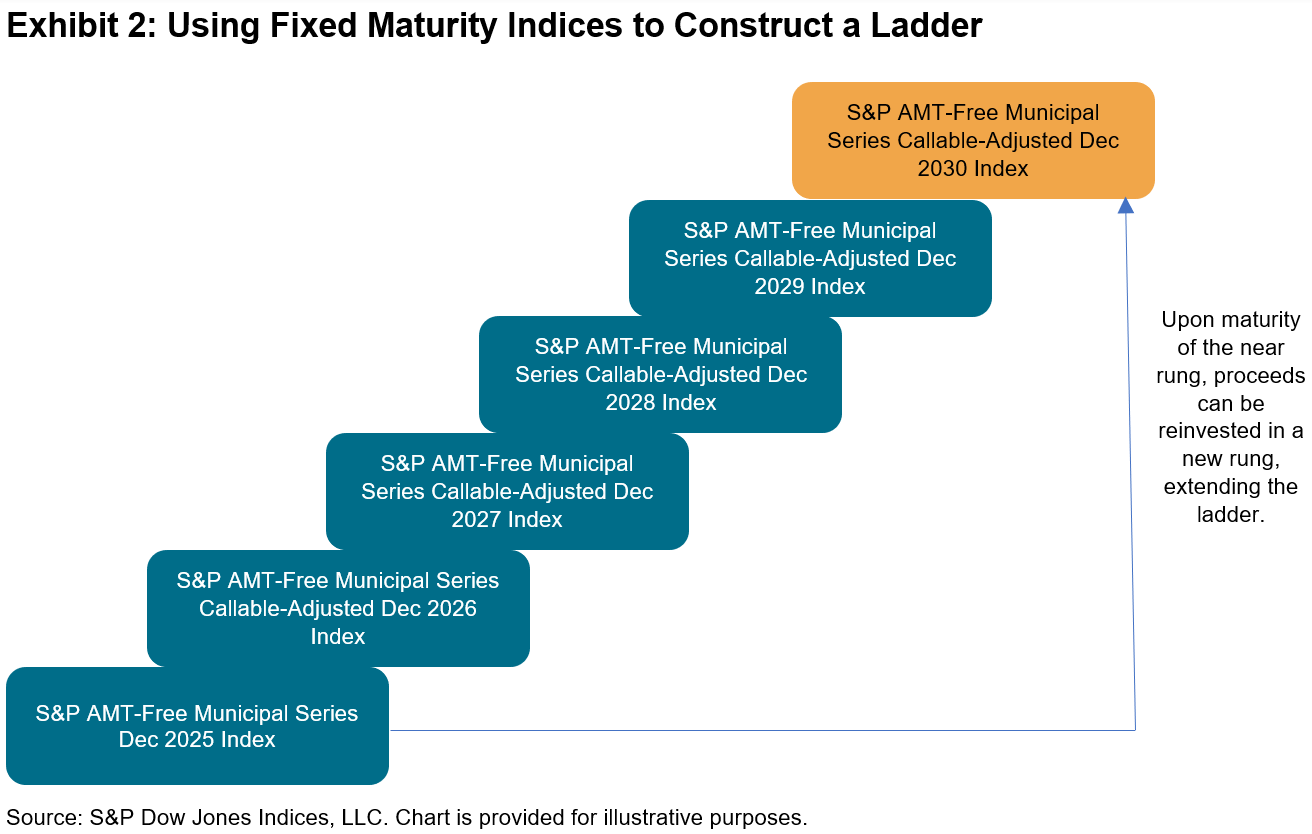
Bond laddering is a commonly used framework that has always existed in the investment community for individual bonds, and it now may utilize fixed maturity indices in a similar application. A bond ladder is constructed by choosing maturity years that match the needs of the investor. As a rung on the ladder matures, the proceeds may be extended to a further rung of the ladder. The resulting “ladder” of bonds is a construct that is meant to provide current income in the form of coupons while smoothing out interest rate fluctuations, as the staggered maturity dates track different yields.
Bond versus Bond Index
Bond ladder rungs were originally designed using single fixed income securities. By constructing a ladder using fixed maturity indices relative to individual securities, there could be potential diversification benefits and potentially minimized transaction costs as individual bonds may be difficult to access. This contrast has contributed to the growing popularity of fixed maturity indices and has resulted in index solutions being developed across all segments of fixed income, including investment grade credit, high yield credit, municipal bonds and sovereigns. For example, S&P DJI has carried a U.S. Municipal Bond Fixed Maturity Suite for over a decade and was one of the early adopters of this index construct as practitioners began utilizing indices to construct bond ladders. Our suite, the S&P AMT-Free Municipal Bond Index Series, first launched 15 years ago, includes indices with consecutive maturity years from 2024 to 2030. The recent expansion in Europe has spanned corporate credit and sovereigns, for all of which S&P DJI has index capabilities.
Integrating Sustainability: 5 Years of the S&P 500 ESG Index
A Window on S&P/ASX Index Liquidity

Over the years, the accumulation of assets and trading volumes across index-linked products such as futures, options and exchange-traded funds (ETFs) has led to a trading ecosystem associated with major market indices. Index arbitrageurs and market makers trade different products tracking the same index, keeping their prices sufficiently close to the underlying index. Other market participants use these products interchangeably to obtain or adjust their exposure. All these trading activities support pricing and liquidity, fostering market efficiency and transparency.
A robust index trading ecosystem benefits frequent traders by allowing them to trade related index-linked products with relatively lower cost, including bid-ask spread and market impact, and in relatively larger size. Long-term passive investors also benefit from an assurance in the value of their investment throughout their investment horizon; investors enter the trade at a price close to fair value, monitor the value of their holding in real time, and may have reasonable confidence to exit at near fair value.
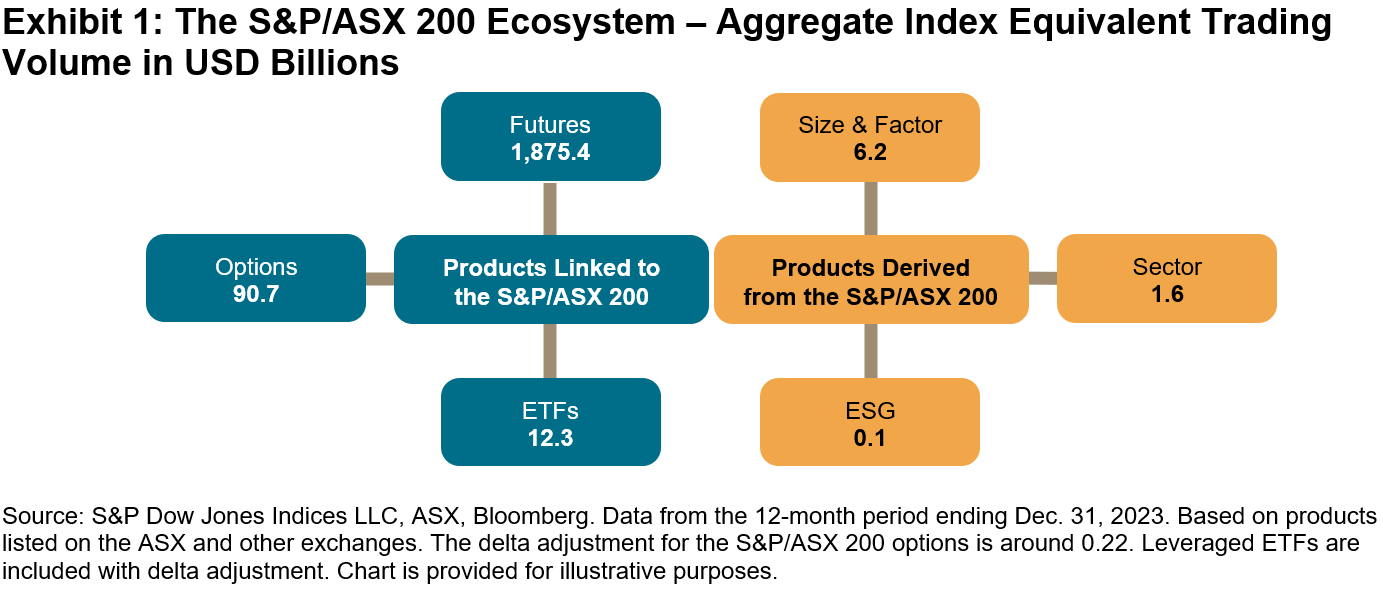
Among the tradeable indices produced by S&P Dow Jones Indices, the S&P/ASX Index Series has the third-largest trading volume, after the S&P 500® and the Dow Jones Industrial Average®. Its aggregate traded economic value1 in 2023 exceeded USD 1.9 trillion, largely driven by the futures contracts of the S&P/ASX 200, a preeminent Australian benchmark index (see Exhibit 1). Its total indexed assets were estimated at USD 102 billion at the end of 2023.2 Since its debut in 2000, the S&P/ASX Index Series has served as the barometer of the Australian stock market and become an integral part of the country’s market infrastructure.
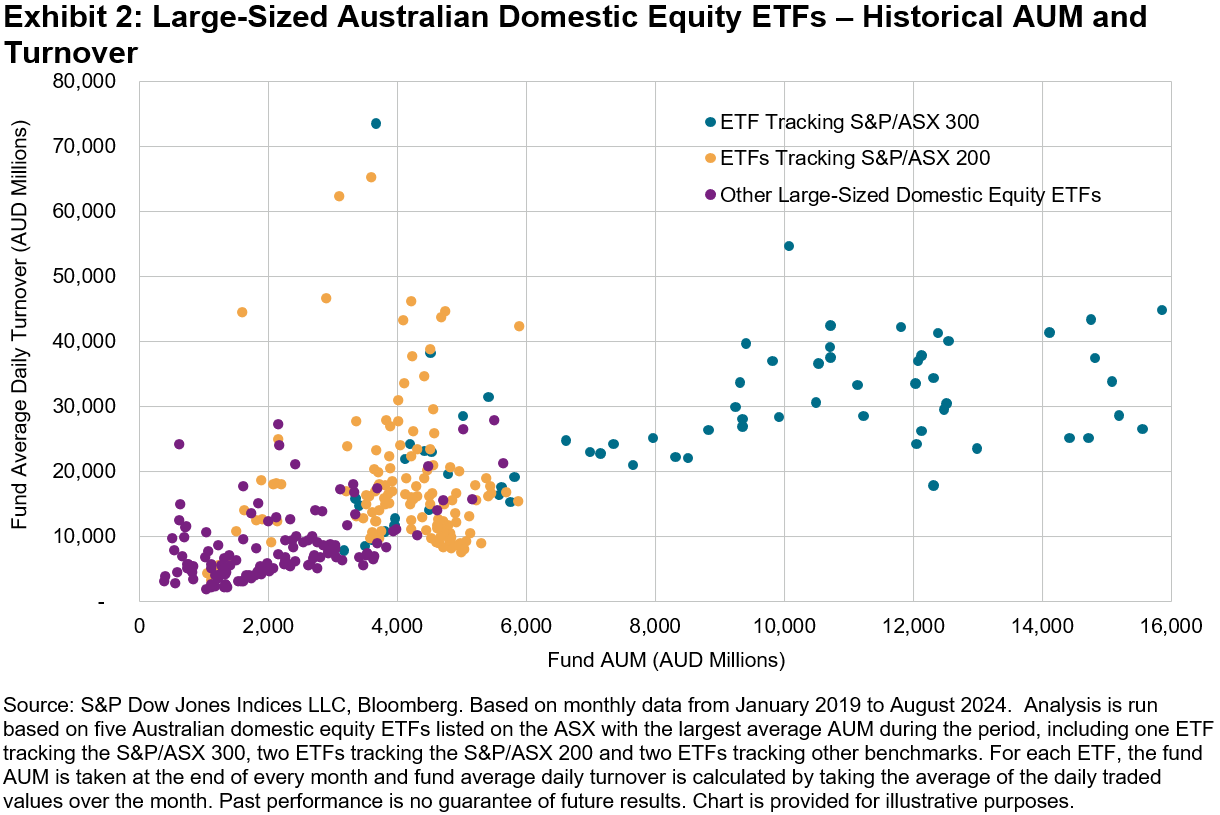
Australian ETFs are a good example of the benefits of an index trading ecosystem. Exhibit 2 shows the historical turnover and assets under management (AUM) of the five largest Australian domestic equity ETFs listed on the ASX. Fund AUM and turnover display a positive relationship in general, with the ETFs tracking the S&P/ASX 300 having the highest AUM and turnover most of the time. More interestingly, given a similar level of fund AUM, ETFs tracking the S&P/ASX 200 tended to have higher turnover than the three ETFs tracking other indices.
Higher trading volumes often contribute to lower trading costs, which is shown in the historical bid-ask spread levels of these ETFs in Exhibit 3. While the S&P/ASX 300 ETF usually had the tightest spreads, ETFs in all three categories traded in a stable bid-ask spread range of 3-5 bps since 2023. March 2020 to May 2020 stands out as an exception—when market volatility spiked along with turnover, the S&P/ASX 200 ETFs maintained notably lower bid-ask spreads than ETFs in the other two categories. The benefit of a large and active trading ecosystem comes to the fore when market moves amplify and the need for trading increases.
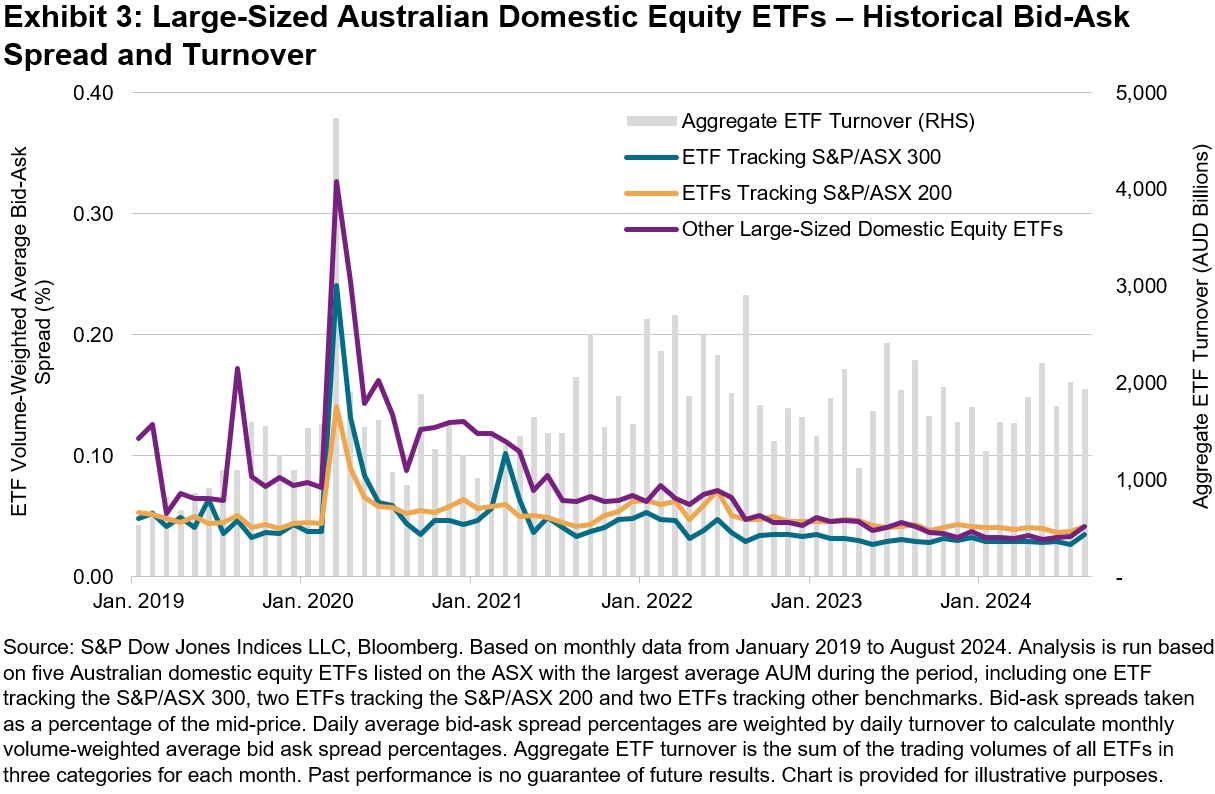
A recent episode on Aug. 5, 2024 reminded us of this again, as the S&P/ASX 200 ETF bid-ask spread remained most stable during a day characterized by a 3.7% market sell-off and the S&P/ASX 200 VIX soaring from 12 to 19. Both issuers and users of index-based products may want to consider underlying index liquidity when designing or choosing a product.
1 Traded economic value is measured by Index Equivalent Trading Volume, a notion developed by S&P Dow Jones Indices to reflect the economic exposure to the index that is being transacted at the time a trade occurs. It is determined by the instrument’s short-term responsiveness to movements in the underlying index (i.e., adjusted by the delta of the instrument). For details, please see Edwards, Tim, “A Window on Index Liquidity: Volumes Linked to S&P DJI Indices,” S&P Dow Jones Indices LLC, August 2019.
2 Indexed assets are assets in and/or notional value of institutional funds, ETFs, retail mutual funds, exchange-traded derivatives and other investable products that seek to replicate or capture the performance of the S&P/ASX Index Series. See Annual Survey of Assets as of December 31, 2023, S&P Dow Jones Indices LLC.
The posts on this blog are opinions, not advice. Please read our Disclaimers.Celebrating 10 Years of the S&P 500 Quality Index

- Categories Factors
- Tags 2024, defensive strategies, factors, quality, S&P 500 Quality Index, sectors, US FA
Launched on July 8, 2014, the S&P 500® Quality Index established a framework for identifying high quality companies within the S&P 500. Today, it celebrates a decade of existence as one of the most prominent indices within our factor family. Over the past decade, quality has emerged as a mainstream factor, with significant growth in assets that track the factor. In this blog, we will review the performance of the S&P 500 Quality Index, analyze changes in sector weight and explore the quality characteristics since its inception.
10-Year Performance Review
For the 10-year period ending July 31, 2024, the S&P 500 generated a historically strong 13.14% annualized return (see Exhibit 1). Perhaps even more remarkable, however, is the S&P 500 Quality Index’s 13.28% annualized return, considering its defensive attributes that generally result in lower volatility.
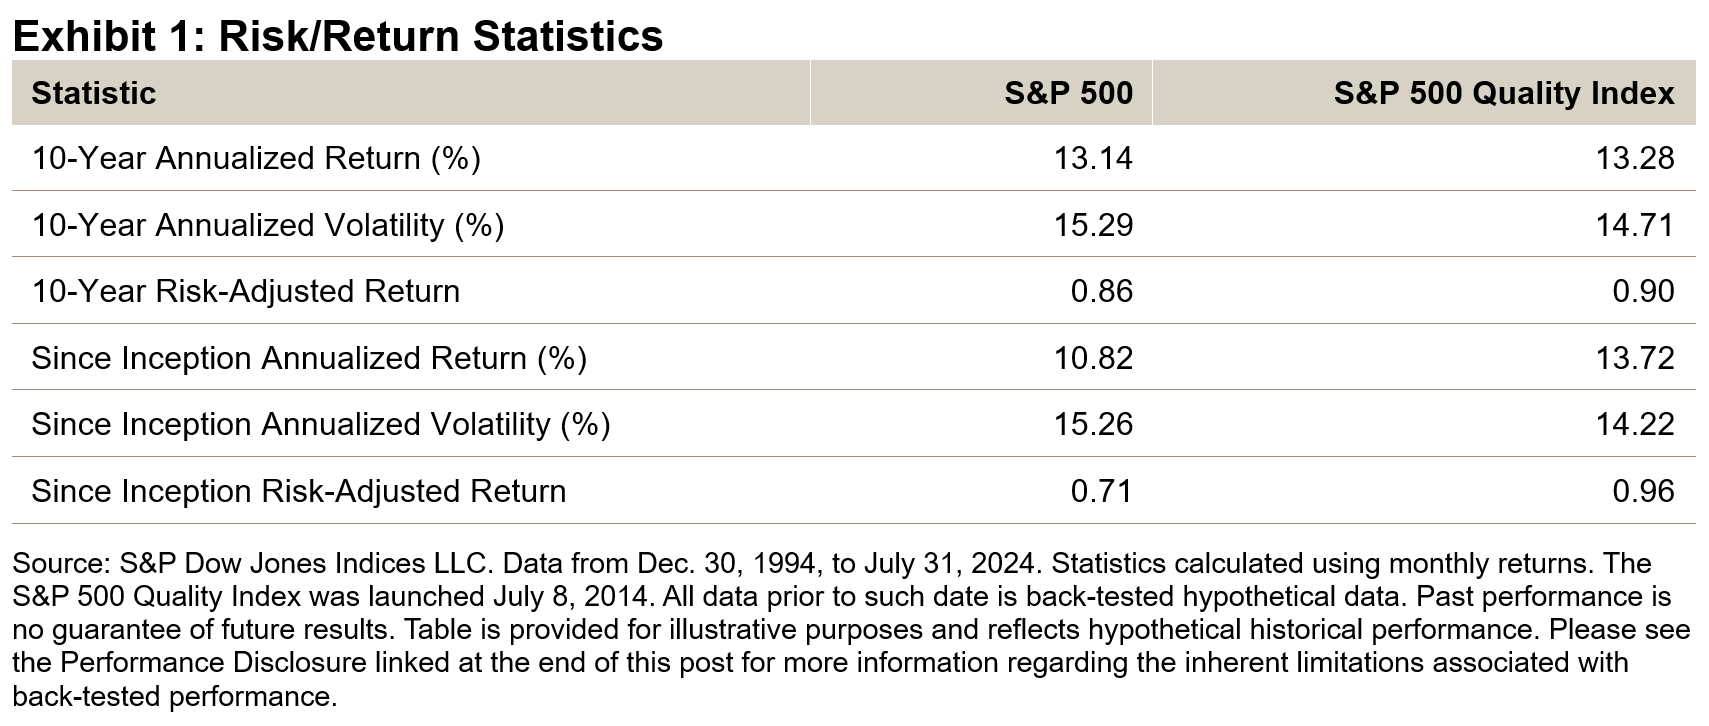
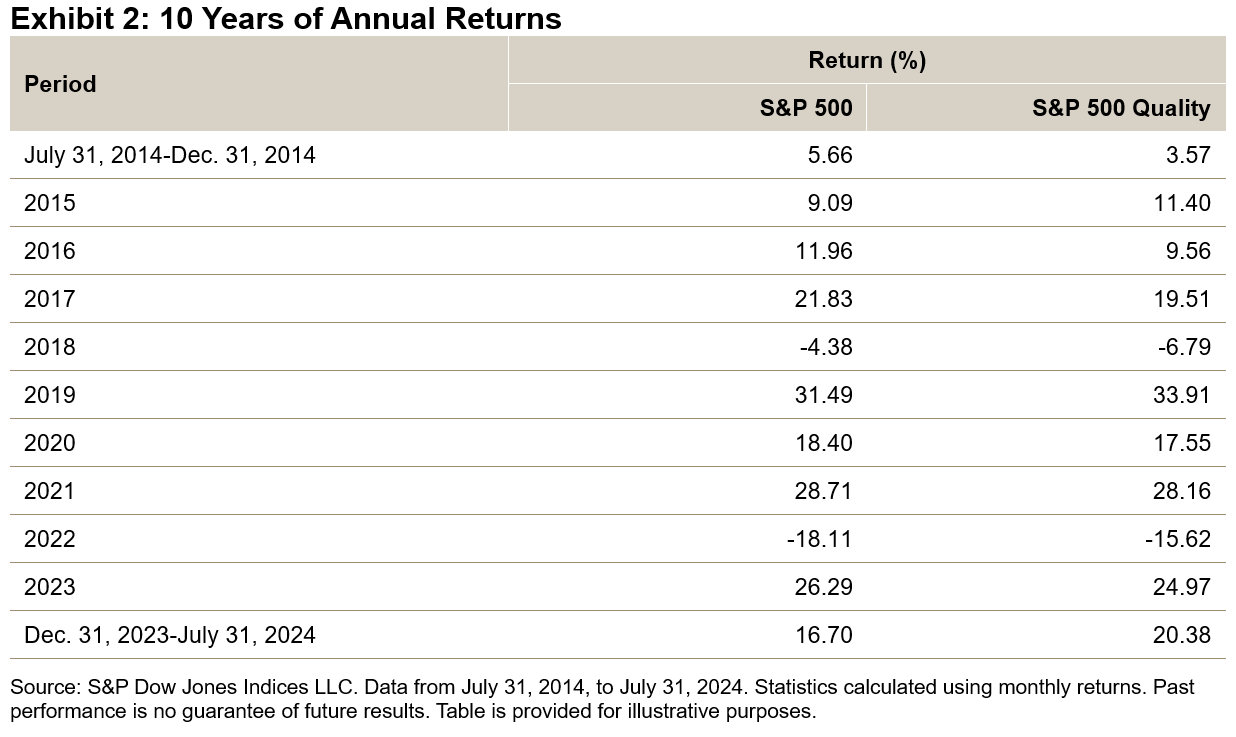
Exhibit 2 displays the annual returns of the S&P 500 and S&P 500 Quality Index since its launch in July 2014. Notably, there have been minimal differences in annual returns over the past decade. However, a significant deviation occurred in the first seven months of this year, with the S&P 500 Quality Index outperforming the S&P 500 by approximately 3.69%.
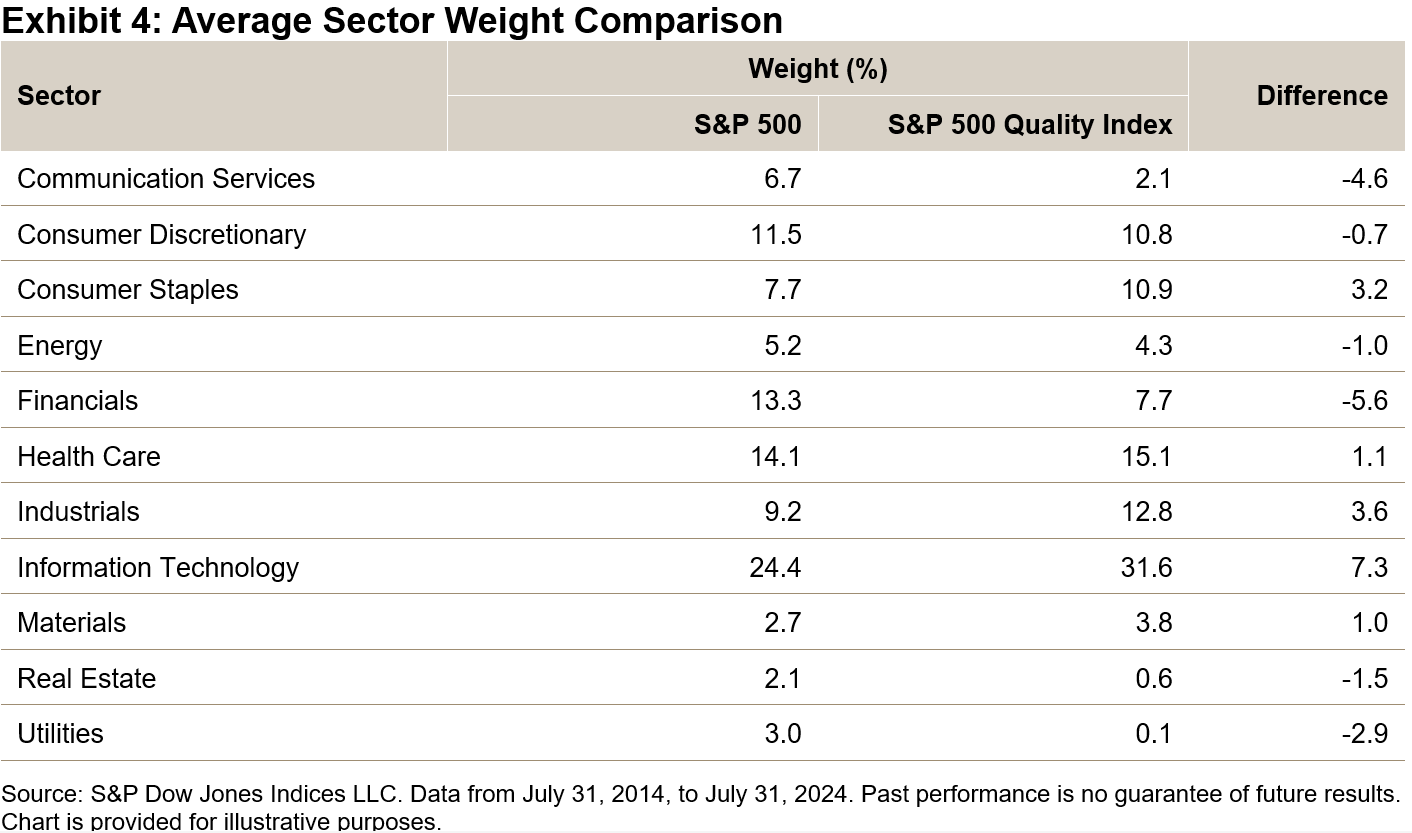
Sector Weight
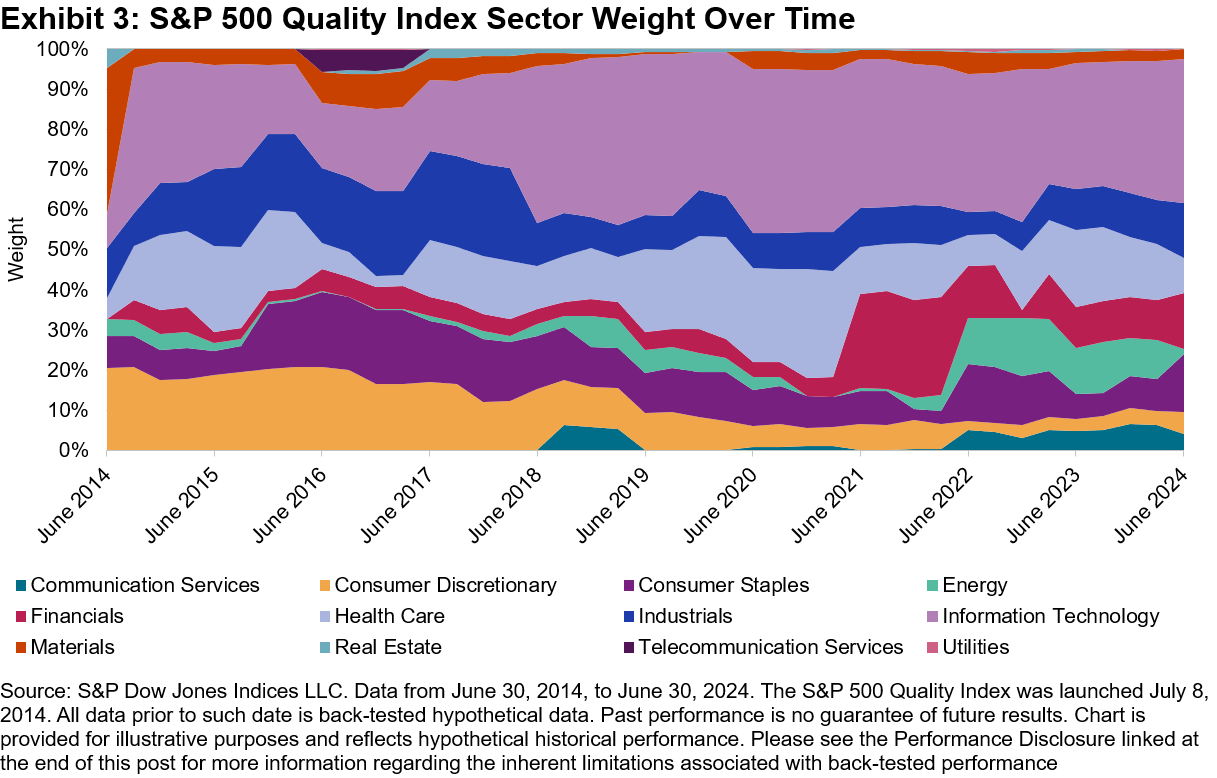
Exhibits 3 and 4 display the sector weights of the S&P 500 Quality Index since its inception. Exhibit 3 shows that the sector weights have been consistent. Information Technology had the highest average sector weight at 31.6%, as well as the largest overweight compared to the S&P 500, with a difference of 7.3%. Financials held the largest underweight relative to the S&P 500 at 5.6%, although it still had an average weight of 7.7% over the 10-year period.
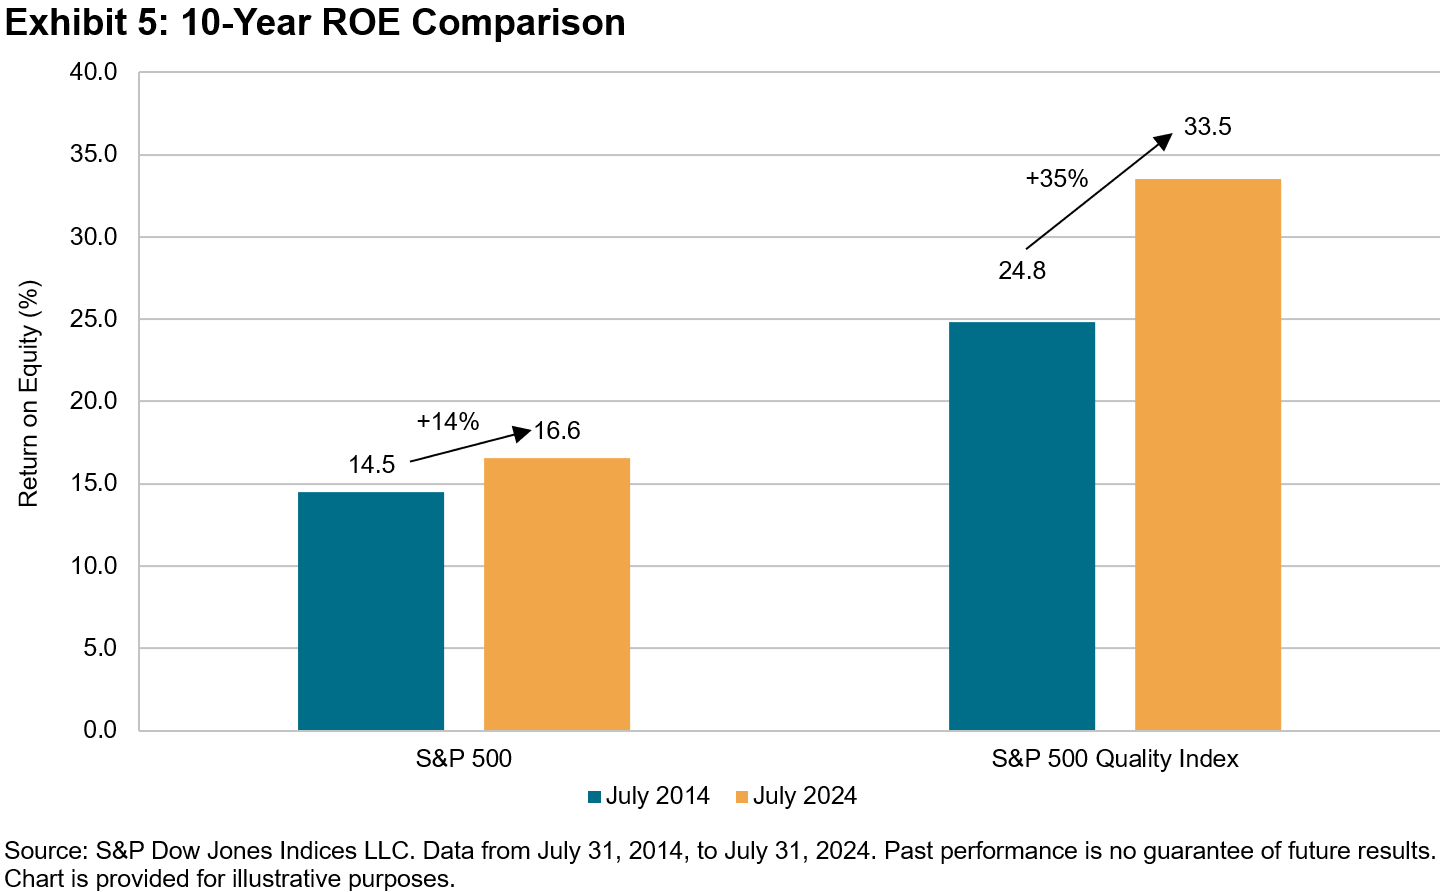
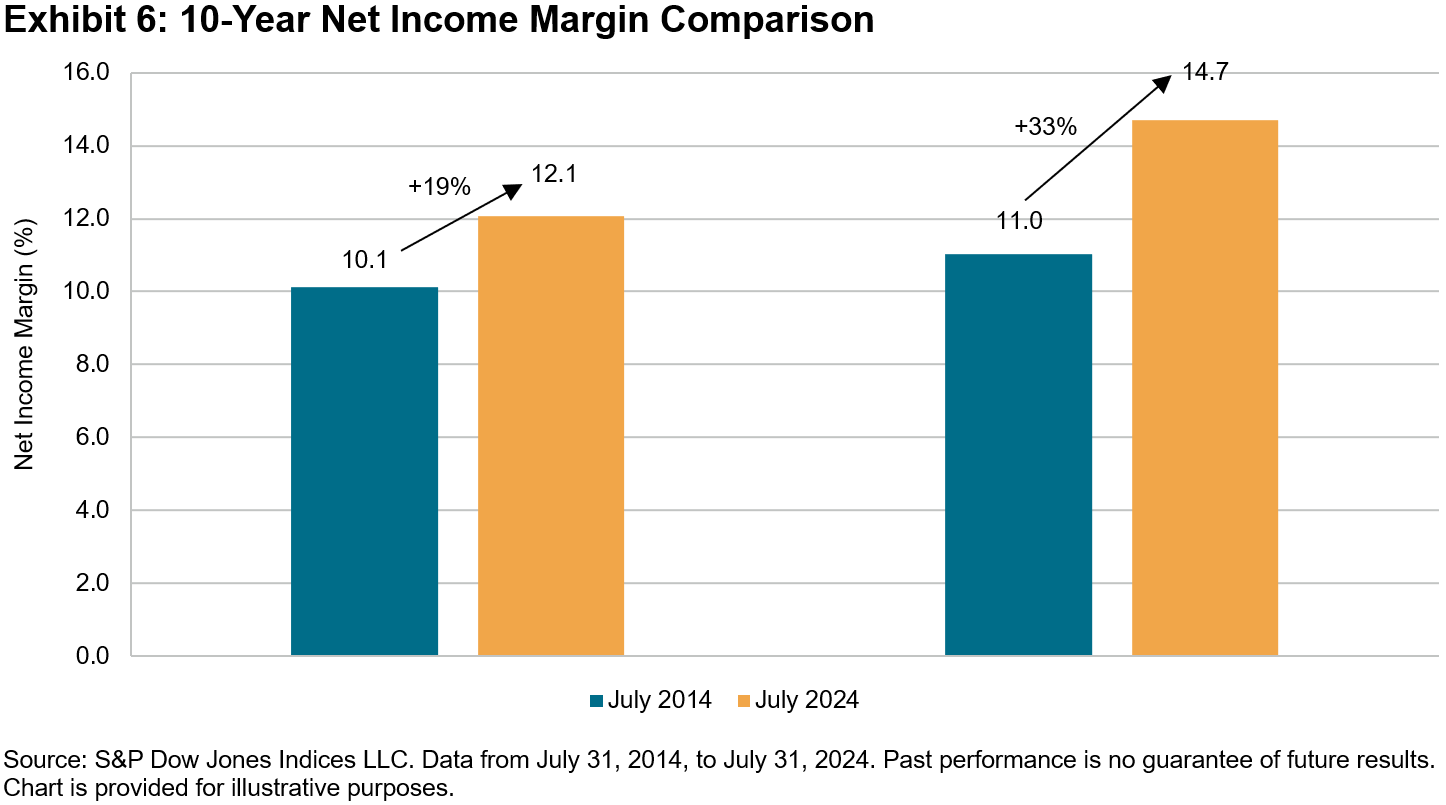
Quality Metric Comparison: Then versus Now
Exhibits 5 and 6 showcase the improved return on equity (ROE) and net income margin of the median constituent of the S&P 500 Quality Index over the last 10 years. The S&P 500 Quality Index’s median constituent increased its ROE from 24.8% to 33.5%, representing a 35% improvement. In comparison, the S&P 500’s median constituent saw a more modest increase in ROE, from 14.5% to 16.6%, representing a 14% improvement. A similar trend is observed in the improvement of net income margin, with the median constituent in the S&P 500 Quality Index improving by 33%, versus 19% for the S&P 500.
 Conclusion
Overall, the S&P 500 Quality Index may have exceeded expectations during the predominantly bullish market conditions of the past decade. The index delivered on expectations of providing defensive characteristics in the form of lower volatility and downside capture. Moreover, it achieved this outperformance without substantial sector differences compared to the S&P 500. Not to mention, the strategy’s quality profile improved over this period as well.
The posts on this blog are opinions, not advice. Please read our Disclaimers.