


How has the S&P 500 ESG Index helped to elevate ESG investing from the margins to the mainstream? Reflecting on the five years since its launch, S&P DJI’s Jaspreet Duhra, Sherifa Issifu and Maya Beyhan take a closer look at a benchmark that has adapted to the ever-changing sustainability landscape while outperforming the broad equity market.
The posts on this blog are opinions, not advice. Please read our Disclaimers.Integrating Sustainability: 5 Years of the S&P 500 ESG Index
A Window on S&P/ASX Index Liquidity
Celebrating 10 Years of the S&P 500 Quality Index
2023 SPIVA Institutional Scorecard: SMAs/Wrap Accounts Are Here!
Fees and Fortunes
Integrating Sustainability: 5 Years of the S&P 500 ESG Index
A Window on S&P/ASX Index Liquidity

Over the years, the accumulation of assets and trading volumes across index-linked products such as futures, options and exchange-traded funds (ETFs) has led to a trading ecosystem associated with major market indices. Index arbitrageurs and market makers trade different products tracking the same index, keeping their prices sufficiently close to the underlying index. Other market participants use these products interchangeably to obtain or adjust their exposure. All these trading activities support pricing and liquidity, fostering market efficiency and transparency.
A robust index trading ecosystem benefits frequent traders by allowing them to trade related index-linked products with relatively lower cost, including bid-ask spread and market impact, and in relatively larger size. Long-term passive investors also benefit from an assurance in the value of their investment throughout their investment horizon; investors enter the trade at a price close to fair value, monitor the value of their holding in real time, and may have reasonable confidence to exit at near fair value.
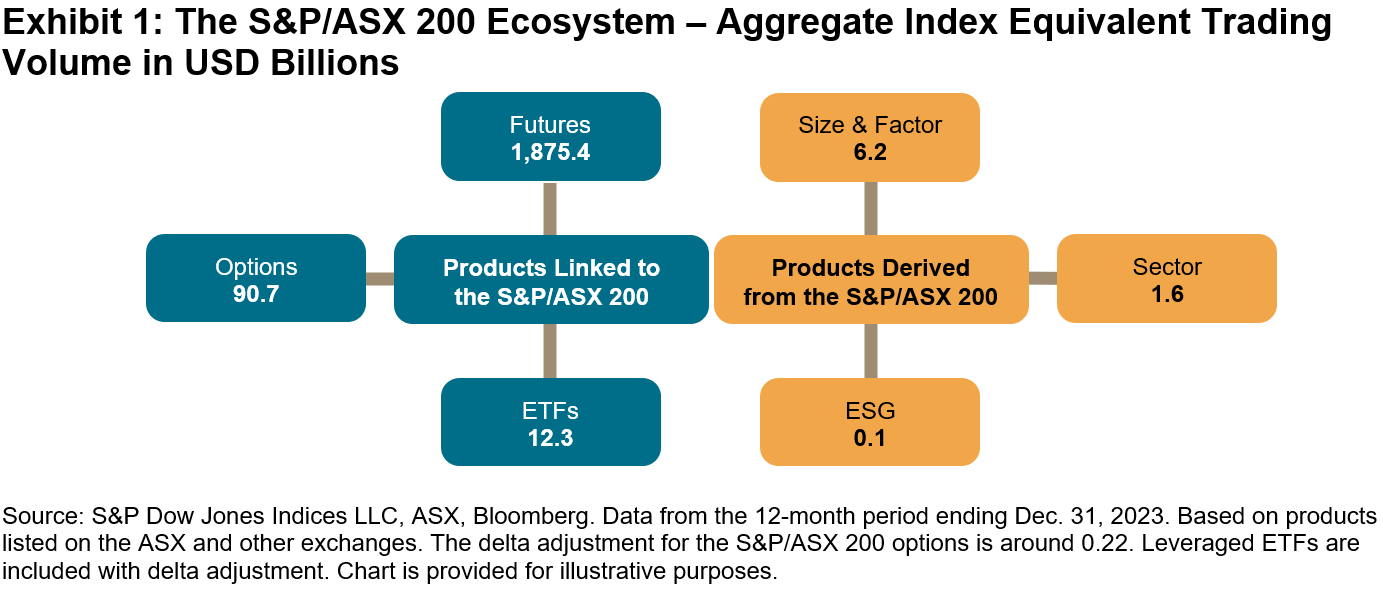
Among the tradeable indices produced by S&P Dow Jones Indices, the S&P/ASX Index Series has the third-largest trading volume, after the S&P 500® and the Dow Jones Industrial Average®. Its aggregate traded economic value1 in 2023 exceeded USD 1.9 trillion, largely driven by the futures contracts of the S&P/ASX 200, a preeminent Australian benchmark index (see Exhibit 1). Its total indexed assets were estimated at USD 102 billion at the end of 2023.2 Since its debut in 2000, the S&P/ASX Index Series has served as the barometer of the Australian stock market and become an integral part of the country’s market infrastructure.
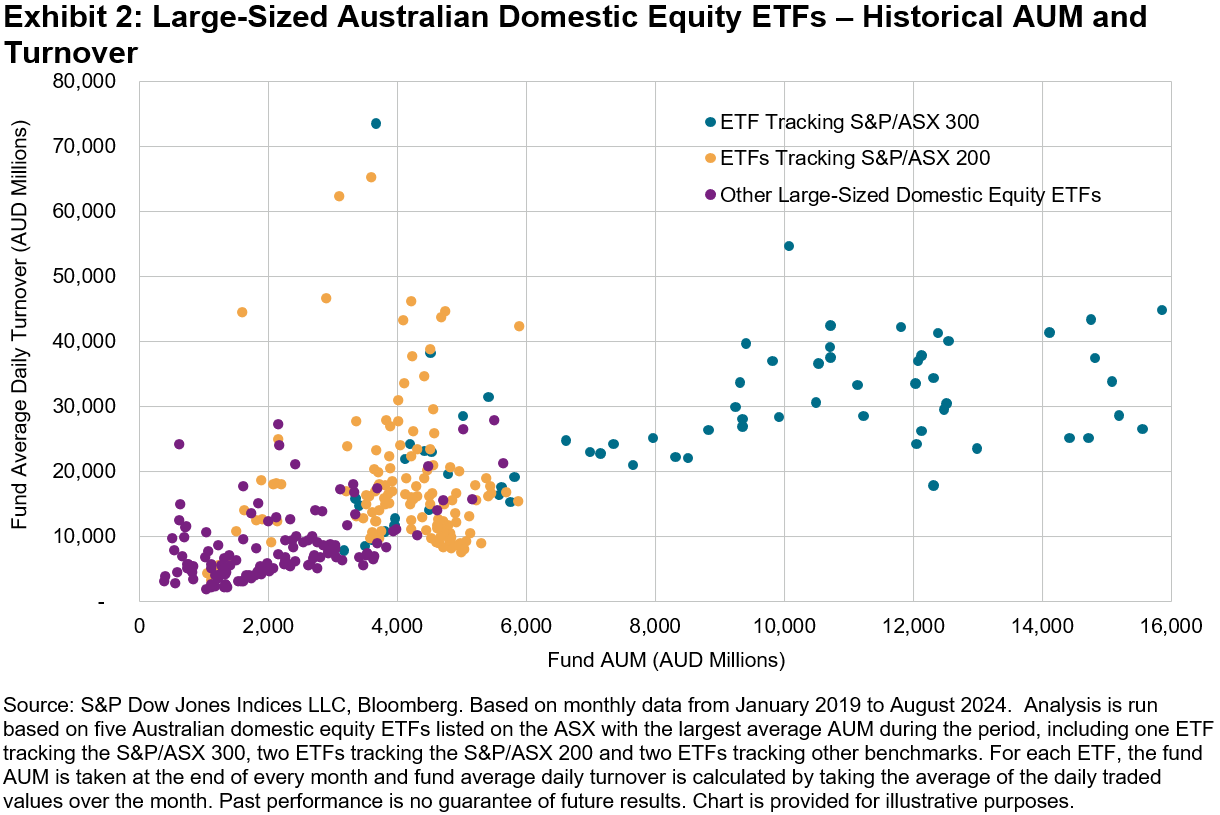
Australian ETFs are a good example of the benefits of an index trading ecosystem. Exhibit 2 shows the historical turnover and assets under management (AUM) of the five largest Australian domestic equity ETFs listed on the ASX. Fund AUM and turnover display a positive relationship in general, with the ETFs tracking the S&P/ASX 300 having the highest AUM and turnover most of the time. More interestingly, given a similar level of fund AUM, ETFs tracking the S&P/ASX 200 tended to have higher turnover than the three ETFs tracking other indices.
Higher trading volumes often contribute to lower trading costs, which is shown in the historical bid-ask spread levels of these ETFs in Exhibit 3. While the S&P/ASX 300 ETF usually had the tightest spreads, ETFs in all three categories traded in a stable bid-ask spread range of 3-5 bps since 2023. March 2020 to May 2020 stands out as an exception—when market volatility spiked along with turnover, the S&P/ASX 200 ETFs maintained notably lower bid-ask spreads than ETFs in the other two categories. The benefit of a large and active trading ecosystem comes to the fore when market moves amplify and the need for trading increases.
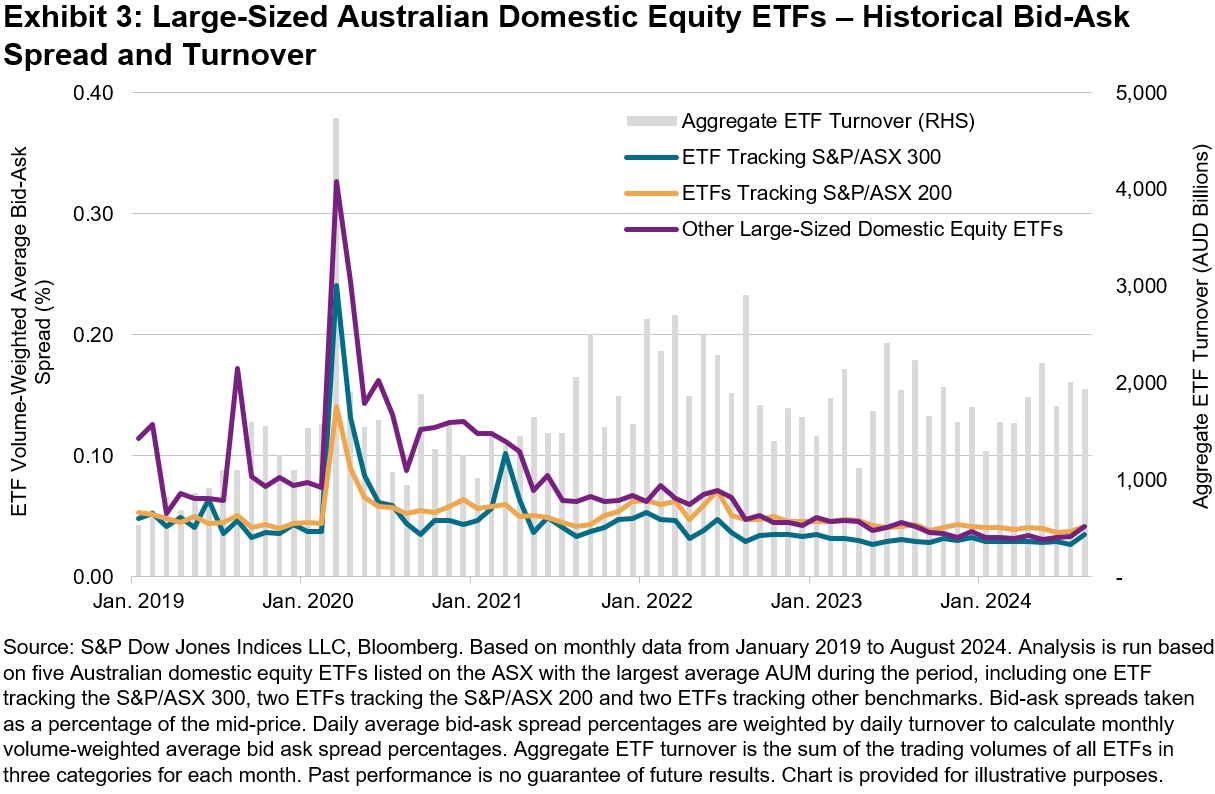
A recent episode on Aug. 5, 2024 reminded us of this again, as the S&P/ASX 200 ETF bid-ask spread remained most stable during a day characterized by a 3.7% market sell-off and the S&P/ASX 200 VIX soaring from 12 to 19. Both issuers and users of index-based products may want to consider underlying index liquidity when designing or choosing a product.
1 Traded economic value is measured by Index Equivalent Trading Volume, a notion developed by S&P Dow Jones Indices to reflect the economic exposure to the index that is being transacted at the time a trade occurs. It is determined by the instrument’s short-term responsiveness to movements in the underlying index (i.e., adjusted by the delta of the instrument). For details, please see Edwards, Tim, “A Window on Index Liquidity: Volumes Linked to S&P DJI Indices,” S&P Dow Jones Indices LLC, August 2019.
2 Indexed assets are assets in and/or notional value of institutional funds, ETFs, retail mutual funds, exchange-traded derivatives and other investable products that seek to replicate or capture the performance of the S&P/ASX Index Series. See Annual Survey of Assets as of December 31, 2023, S&P Dow Jones Indices LLC.
The posts on this blog are opinions, not advice. Please read our Disclaimers.Celebrating 10 Years of the S&P 500 Quality Index

- Categories Factors
- Tags 2024, defensive strategies, factors, quality, S&P 500 Quality Index, sectors, US FA
Launched on July 8, 2014, the S&P 500® Quality Index established a framework for identifying high quality companies within the S&P 500. Today, it celebrates a decade of existence as one of the most prominent indices within our factor family. Over the past decade, quality has emerged as a mainstream factor, with significant growth in assets that track the factor. In this blog, we will review the performance of the S&P 500 Quality Index, analyze changes in sector weight and explore the quality characteristics since its inception.
10-Year Performance Review
For the 10-year period ending July 31, 2024, the S&P 500 generated a historically strong 13.14% annualized return (see Exhibit 1). Perhaps even more remarkable, however, is the S&P 500 Quality Index’s 13.28% annualized return, considering its defensive attributes that generally result in lower volatility.
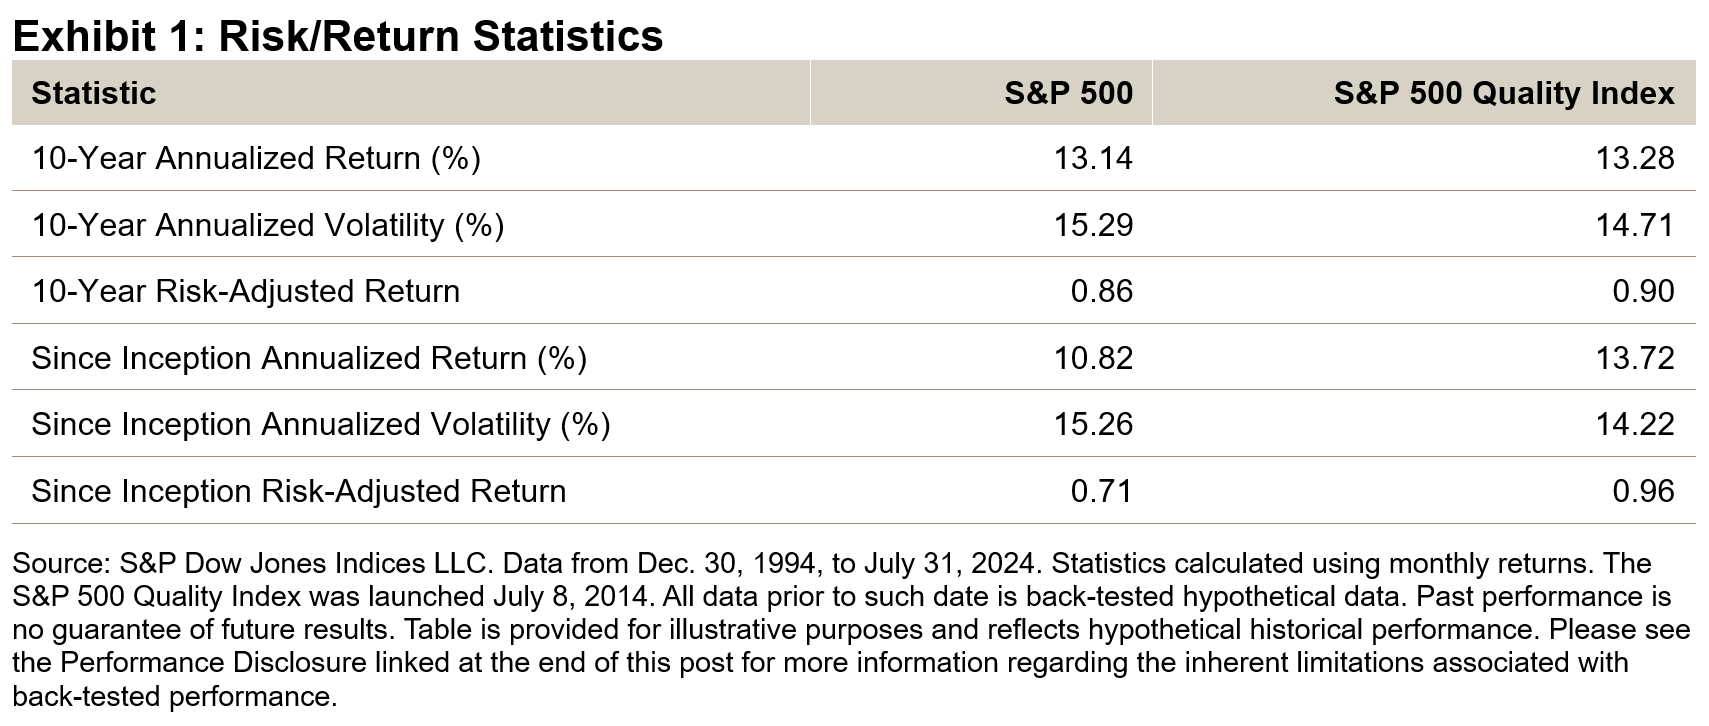
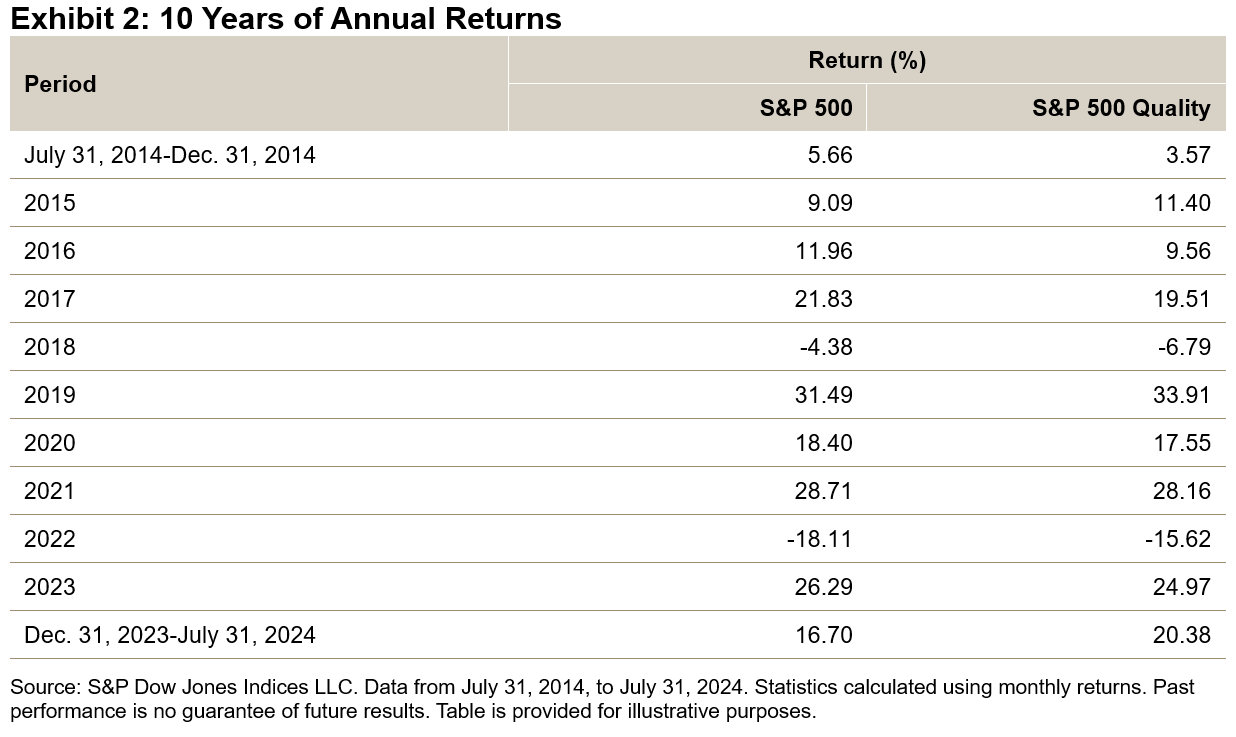
Exhibit 2 displays the annual returns of the S&P 500 and S&P 500 Quality Index since its launch in July 2014. Notably, there have been minimal differences in annual returns over the past decade. However, a significant deviation occurred in the first seven months of this year, with the S&P 500 Quality Index outperforming the S&P 500 by approximately 3.69%.
Sector Weight
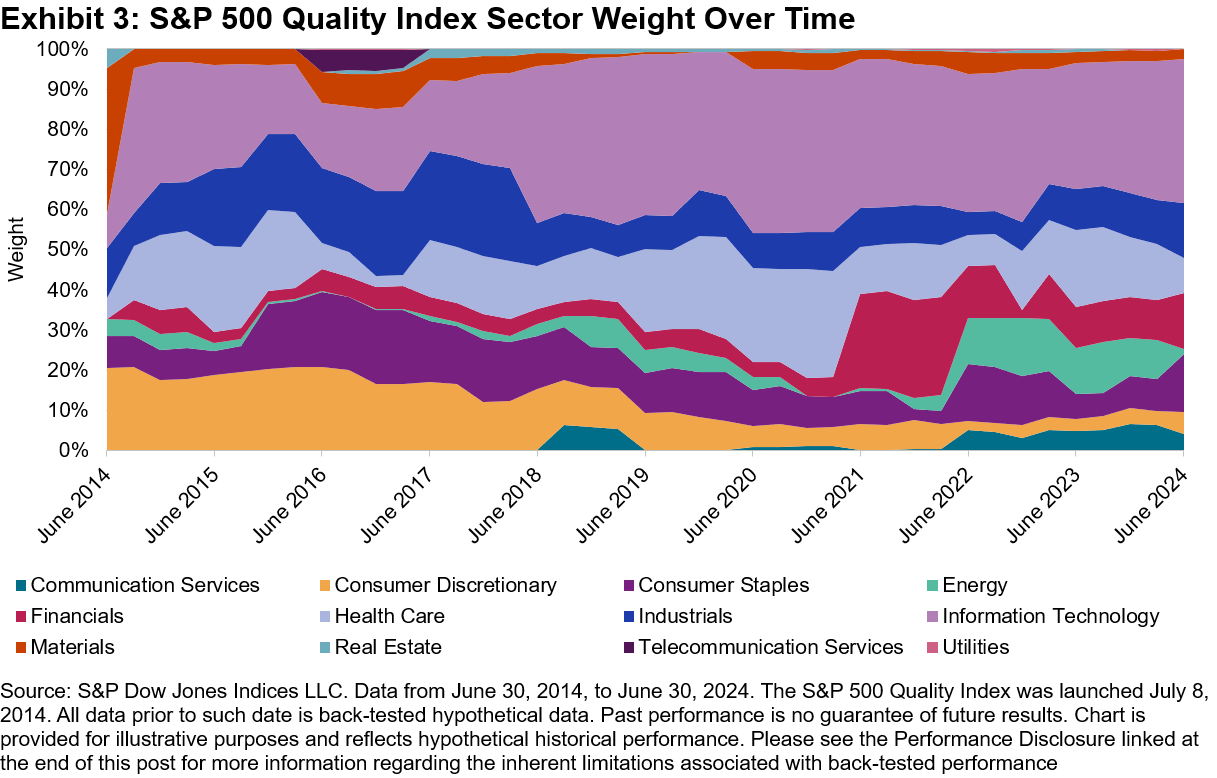
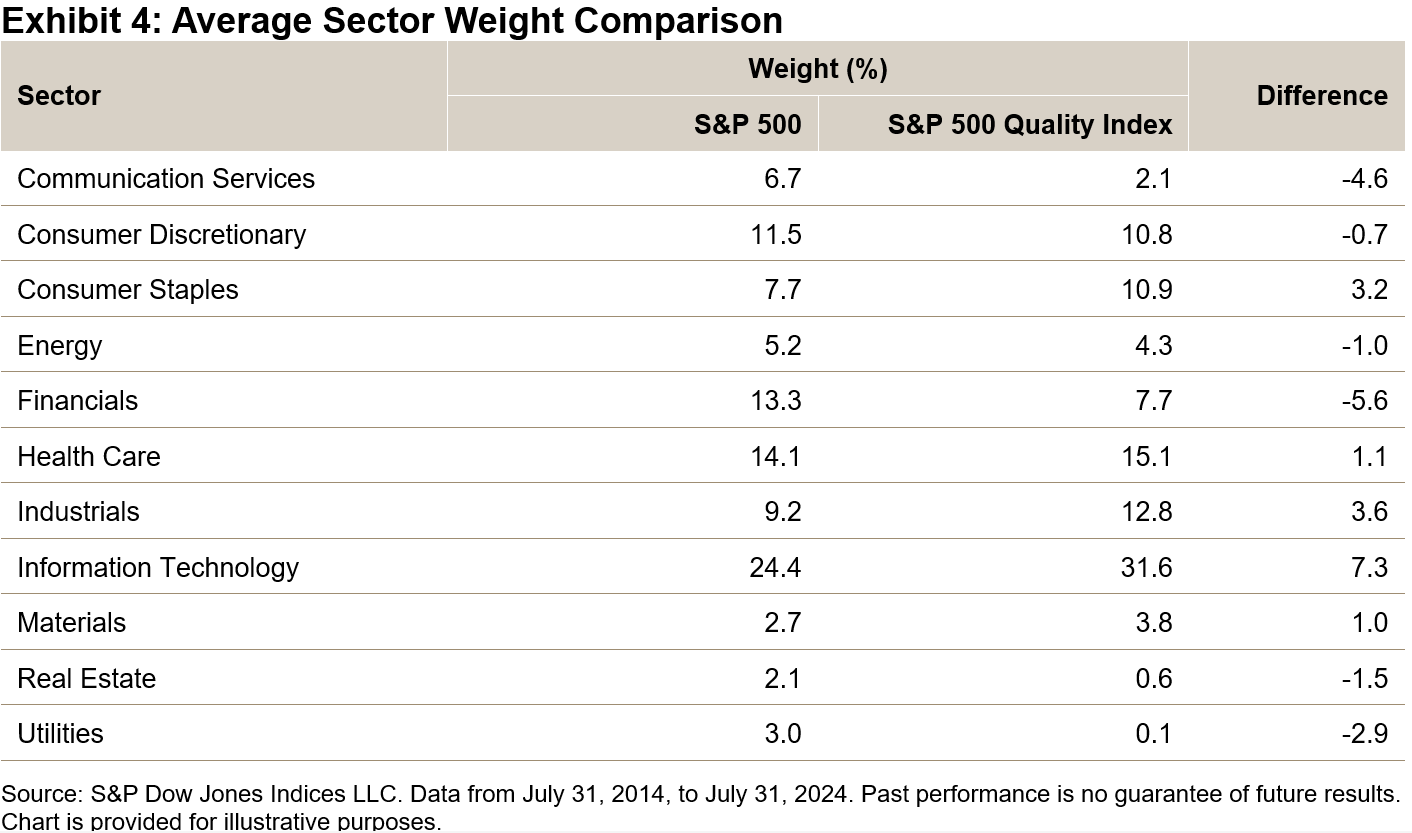
Exhibits 3 and 4 display the sector weights of the S&P 500 Quality Index since its inception. Exhibit 3 shows that the sector weights have been consistent. Information Technology had the highest average sector weight at 31.6%, as well as the largest overweight compared to the S&P 500, with a difference of 7.3%. Financials held the largest underweight relative to the S&P 500 at 5.6%, although it still had an average weight of 7.7% over the 10-year period.
Quality Metric Comparison: Then versus Now
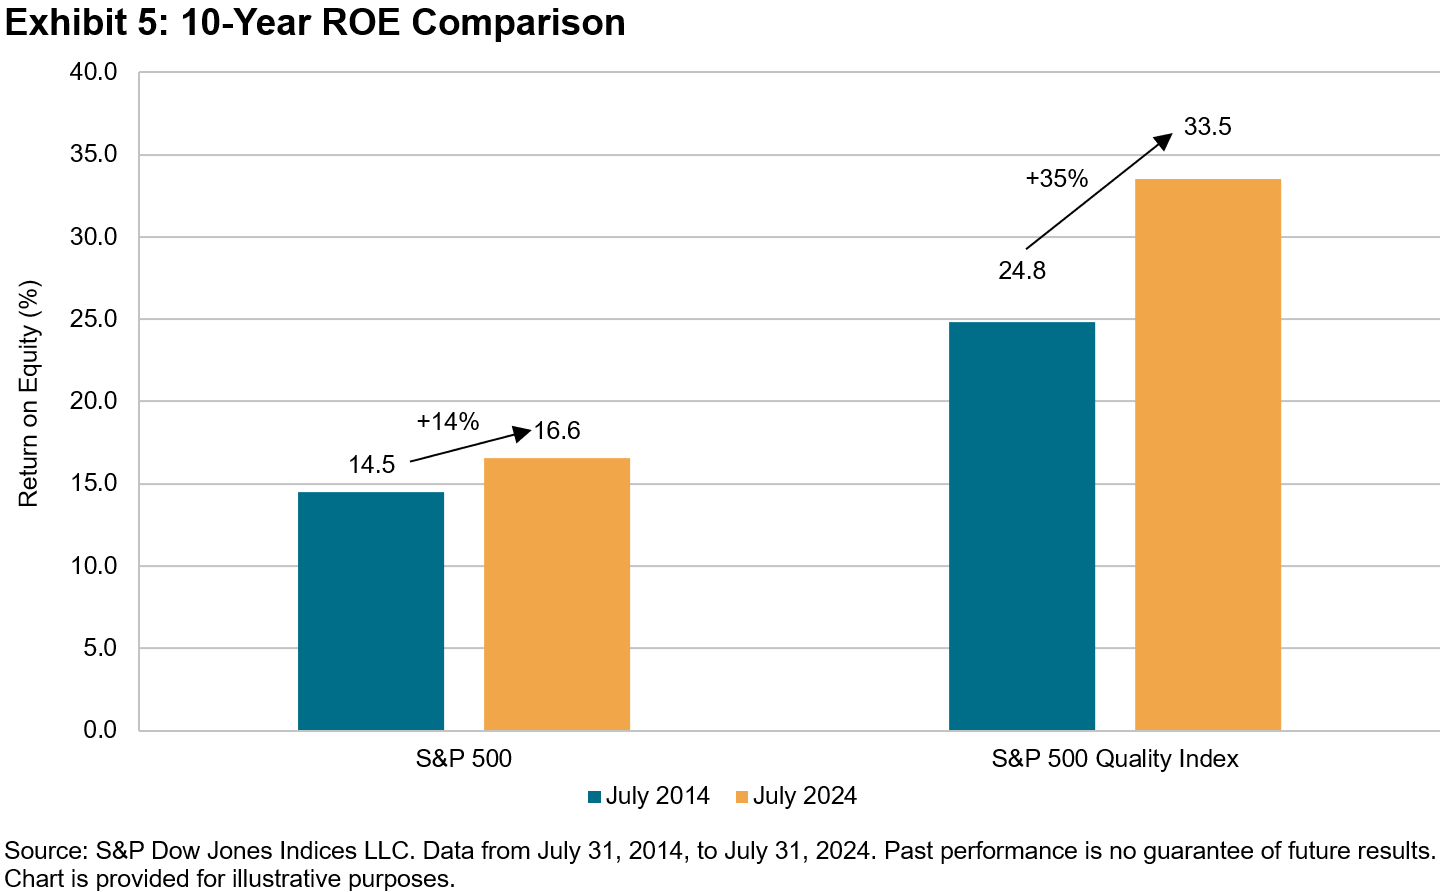
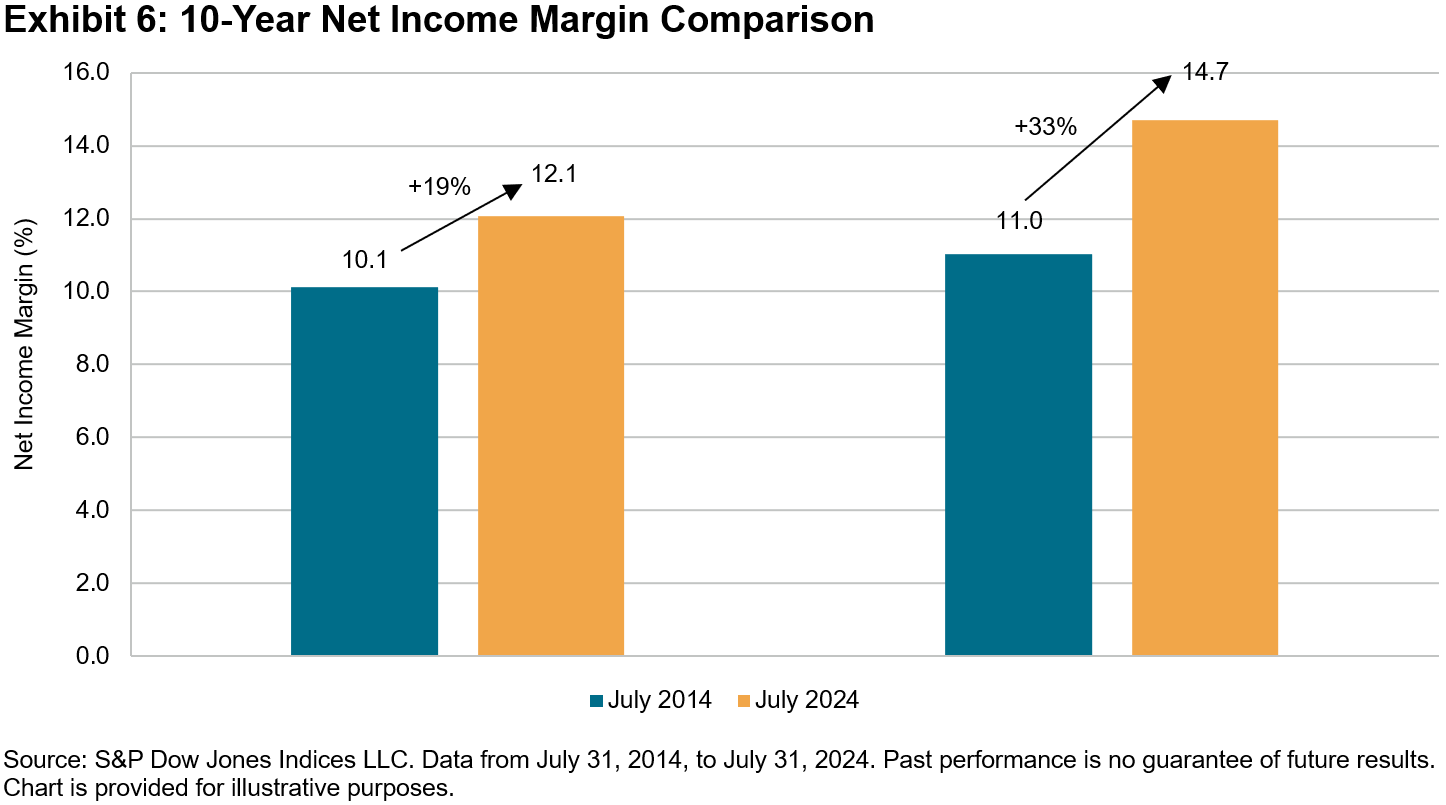
Exhibits 5 and 6 showcase the improved return on equity (ROE) and net income margin of the median constituent of the S&P 500 Quality Index over the last 10 years. The S&P 500 Quality Index’s median constituent increased its ROE from 24.8% to 33.5%, representing a 35% improvement. In comparison, the S&P 500’s median constituent saw a more modest increase in ROE, from 14.5% to 16.6%, representing a 14% improvement. A similar trend is observed in the improvement of net income margin, with the median constituent in the S&P 500 Quality Index improving by 33%, versus 19% for the S&P 500.
 Conclusion
Overall, the S&P 500 Quality Index may have exceeded expectations during the predominantly bullish market conditions of the past decade. The index delivered on expectations of providing defensive characteristics in the form of lower volatility and downside capture. Moreover, it achieved this outperformance without substantial sector differences compared to the S&P 500. Not to mention, the strategy’s quality profile improved over this period as well.
The posts on this blog are opinions, not advice. Please read our Disclaimers.2023 SPIVA Institutional Scorecard: SMAs/Wrap Accounts Are Here!

First published in 2002, the S&P Indices versus Active (SPIVA®) U.S. Scorecard measures the performance of active mutual fund managers against their respective S&P DJI benchmarks over various time horizons and across asset classes. In 2015, we extended the analysis to include institutional accounts to understand how institutional asset owners fared versus mutual funds against their respective benchmarks and the impact of fees on performance.
In our 2023 edition, we have further expanded our purview of assessing active manager performance to now include separately managed accounts (SMAs)/wrap accounts. SMAs may offer potential benefits such as increased customization, greater transparency and direct ownership of securities in a portfolio. With the addition of these accounts, we can examine the performance of professionally managed portfolios held by retail investors against their respective benchmarks.
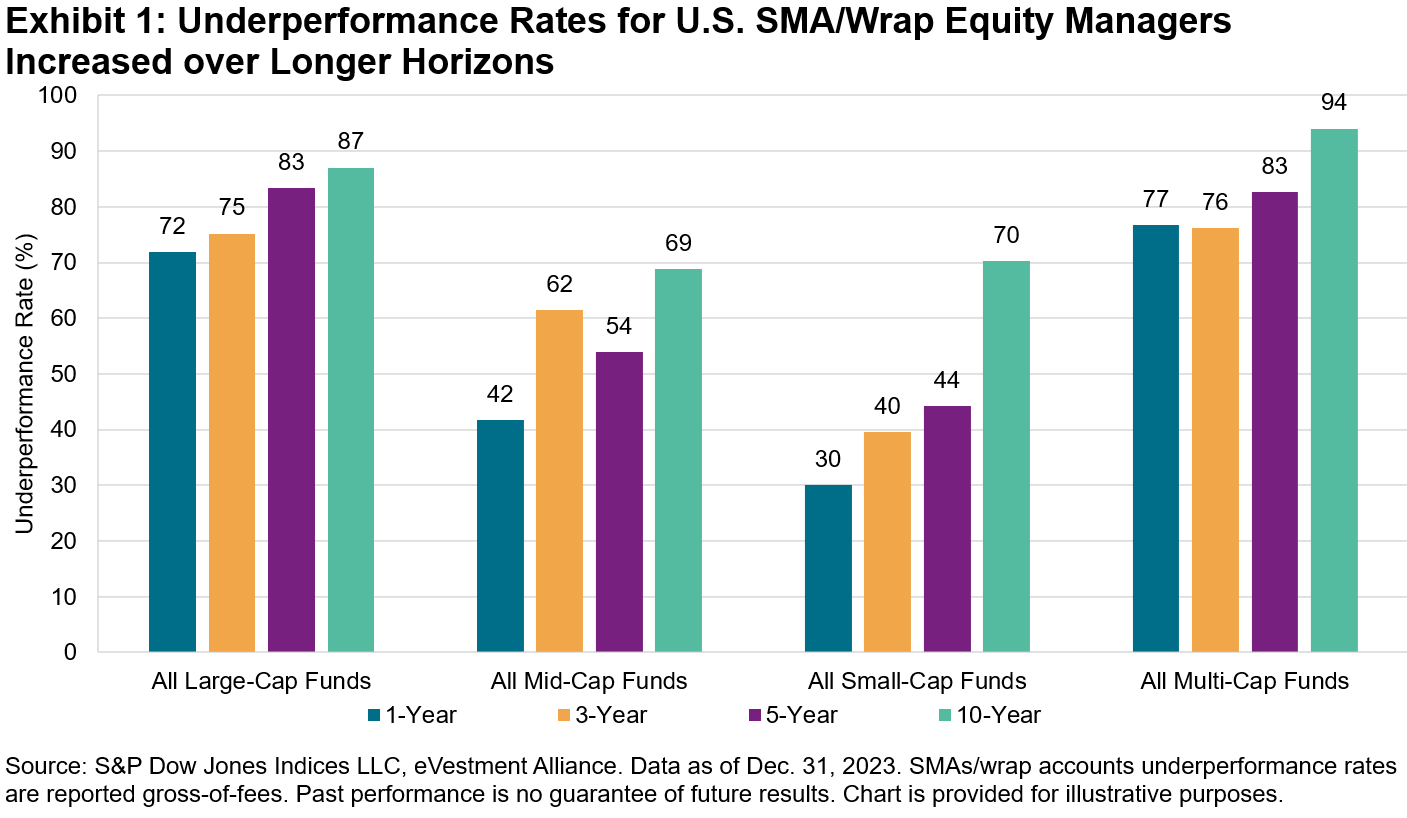
Our reported SMA/wrap categories span across equities and fixed income. In 2023, in our most closely watched category of All Large-Cap Funds, 72% of SMA/wrap managers underperformed the S&P 500® on a gross-of-fees basis, lagging their institutional account and mutual fund peers (see Exhibit 1). Large-cap managers may have been hampered by the dominance of mega-cap stocks, especially if they were underweighted in comparison to their benchmark weights.
In contrast, mid- and small-cap managers fared much better. Only 42% of mid-cap and 30% of small-cap managers underperformed their respective benchmarks. One potential explanation for these results may be style bias opportunities among smaller-cap managers, who may have benefited by taking strategic tilts toward outperforming larger-cap stocks, with the S&P 500 outperforming the S&P MidCap 400® and the S&P SmallCap 600® by 9.9% and 10.2%, respectively.
Style bias often explains performance across the capitalization spectrum; it may be easier for small- and mid-cap managers to tilt their portfolios toward larger companies with greater liquidity or to let their winners run. Historically, the odds of success for mid- and small-cap managers have improved when larger stocks have outperformed, with majority outperformance for small-cap mutual funds in 7 out of the past 22 years, of which 6 years coincided with large-cap outperformance.
SMA/wrap results within fixed income were mixed in 2023 across our three reported categories (see Exhibit 2). U.S. Aggregate accounts posted majority outperformance, followed by a moderate showing for Core, with 51% of accounts underperforming, and bleaker results within the muni space, with 86% of Municipal accounts underperforming the S&P National AMT-Free Municipal Bond Index.
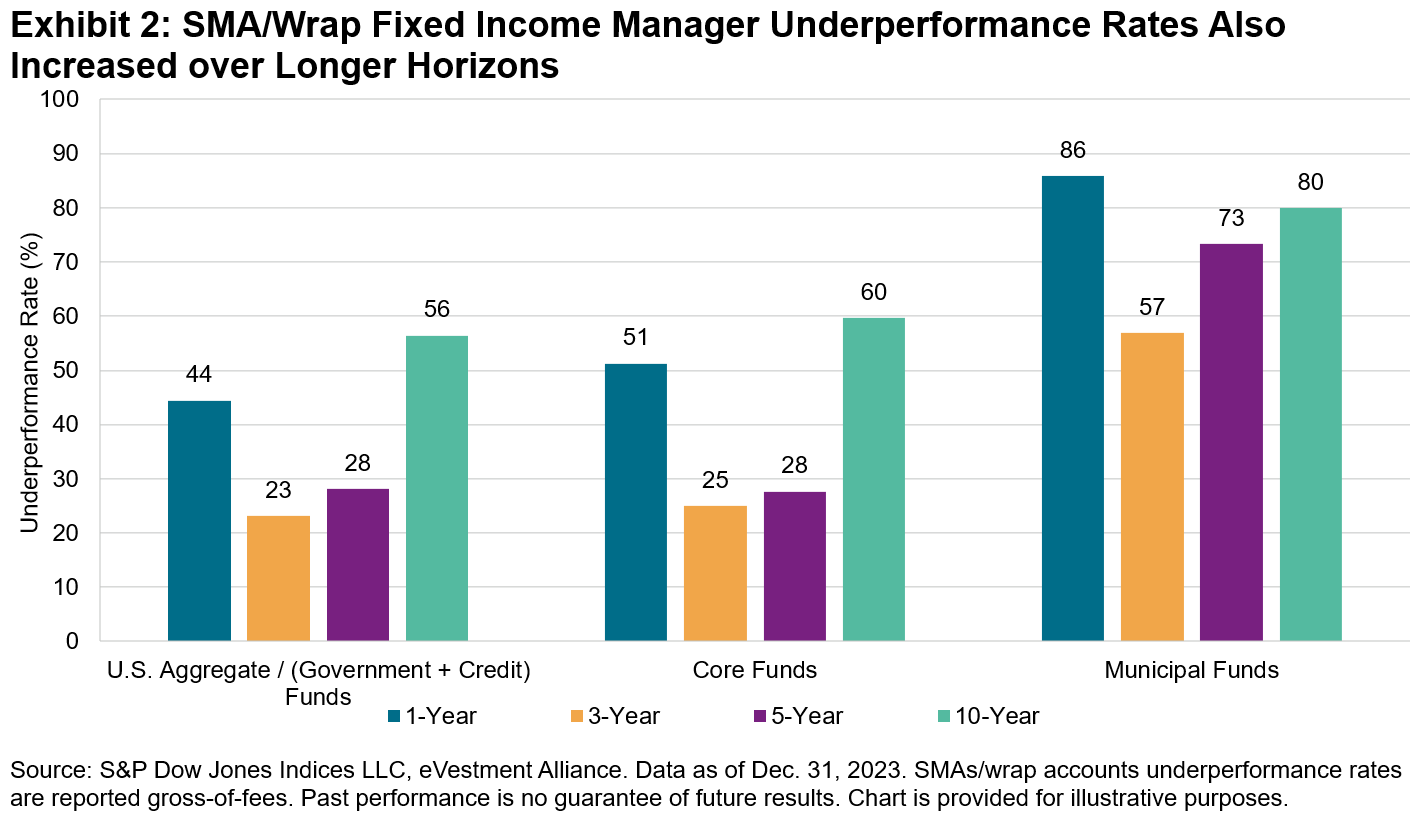
While there were a few categories with majority outperformance in 2023, our SPIVA scorecards have consistently shown that outperforming a benchmark over time is challenging, and this continues to ring true for SMAs/wrap accounts. Exhibits 1 and 2 show that more than 70% of accounts across equity SMA/wrap categories and more than 50% across fixed income categories underperformed their respective benchmarks over the 10-year period ending Dec. 31, 2023. For more detailed information on how SMAs/wrap accounts fared last year, please see our 2023 SPIVA Institutional Scorecard.
The author would like to thank Anu Ganti and Davide Di Gioia for their contributions to this post.
The posts on this blog are opinions, not advice. Please read our Disclaimers.Fees and Fortunes

One of the potential advantages of indexing is its typically lower cost relative to active management. Investors have benefited substantially by saving on fees. And as indexing has expanded across asset classes, these rewards have compounded, especially in fixed income, where fees can prove more influential.
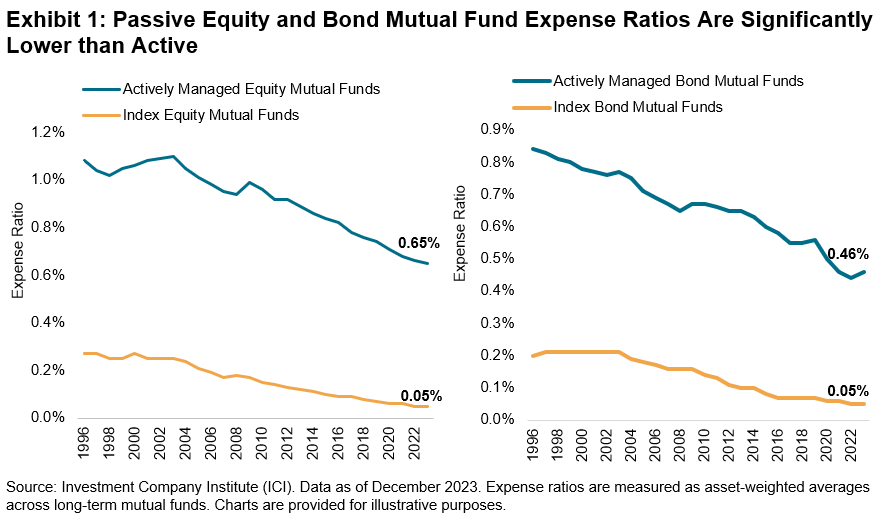
In Exhibit 1, we see that index mutual fund expense ratios in the U.S. have been consistently lower than their active counterparts for the past couple of decades. Although that spread has narrowed in recent years, we still observe a fee differential of 60 bps across equities and 41 bps across bonds as of 2023.
In addition to fee savings, index-tracking investors may have also benefited by avoiding active underperformance. Particularly germane to the equity markets, our SPIVA® Scorecards show that only a handful of actively managed mutual funds have outperformed the benchmark. But how do we account for institutional investors who, unlike retail investors, claim an advantage in selecting skillful asset managers coupled with a better vantage point to negotiate fees?
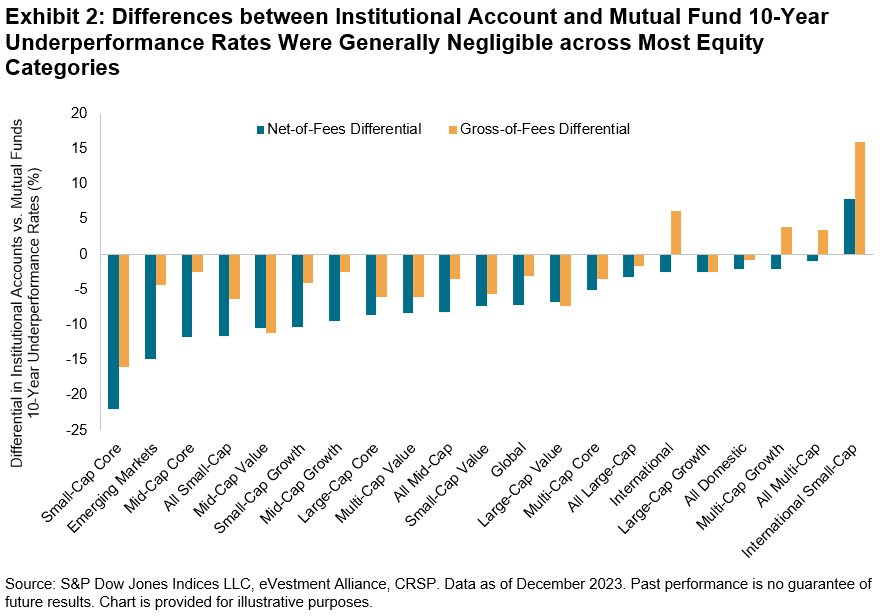
Our SPIVA Institutional Scorecard seeks to shed light on these questions, providing coverage of the performance of institutional accounts along with mutual fund data from the flagship SPIVA U.S. Scorecard. Exhibit 2 plots the differential in 10-year underperformance rates between institutional accounts versus mutual funds on both a net and gross-of-fees basis.
The chart illustrates several notable observations. First, long-term net-of-fees performance for institutional accounts was better compared to mutual funds in 20 out of 21 reported equity segments, with International Small-Cap Funds a noticeable outlier. Second, gross-of-fees relative performance for institutional accounts was better for 17 out of 21 equity categories. Third, except for a few categories, differences between mutual fund and institutional account underperformance rates were generally negligible, with majority underperformance for institutional accounts across all categories, on both a gross and net-of-fees basis.
While long-term results may slightly favor institutional accounts versus mutual funds, results can vary over the short term. In our most closely watched category, All Large-Cap Funds, 66% of institutional accounts underperformed the S&P 500® in 2023, worse than the 60% rate we observed for active large-cap mutual funds. Consistent 10-year majority underperformance rates across categories highlight the challenges of outperformance and show that institutional investors are no exception to the rule. Find out more about how institutional equity and fixed income managers fared last year in our SPIVA Institutional Year-End 2023 Scorecard.
The posts on this blog are opinions, not advice. Please read our Disclaimers.