Get Indexology® Blog updates via email.

In This List

S&P DJI’s Global Islamic Equity Benchmarks Rose 13% in H1 2024, Outperforming Conventional Benchmarks

Dispersion at All-Time High Relative to Volatility as Earnings Season Arrives

S&P Dividend Aristocrats and the Search for Income

Of Tariffs Tango and Manufacturing Moves

Frequent Flyers

S&P DJI’s Global Islamic Equity Benchmarks Rose 13% in H1 2024, Outperforming Conventional Benchmarks

Contributor Image
Sue Lee

Director and APAC Head of Index Investment Strategy

S&P Dow Jones Indices

Global equities extended their upward trend into Q2 2024 on the back of sustained economic growth and moderating inflation. The S&P Global BMI posted a healthy 10.4% return in the first half of the year, led by the U.S where the S&P 500® had an impressive run with a 15.3% gain and new record highs. Shariah-compliant global benchmarks beat their conventional counterparts, with the S&P Global BMI Shariah and Dow Jones Islamic Market (DJIM) World Index both generating excess returns of 2.6% in H1 2024. Emerging markets started catching up with developed markets in the second quarter, narrowing their YTD return differentials to 3% in conventional benchmarks and 6% in Shariah-compliant benchmarks (see Exhibit 1).

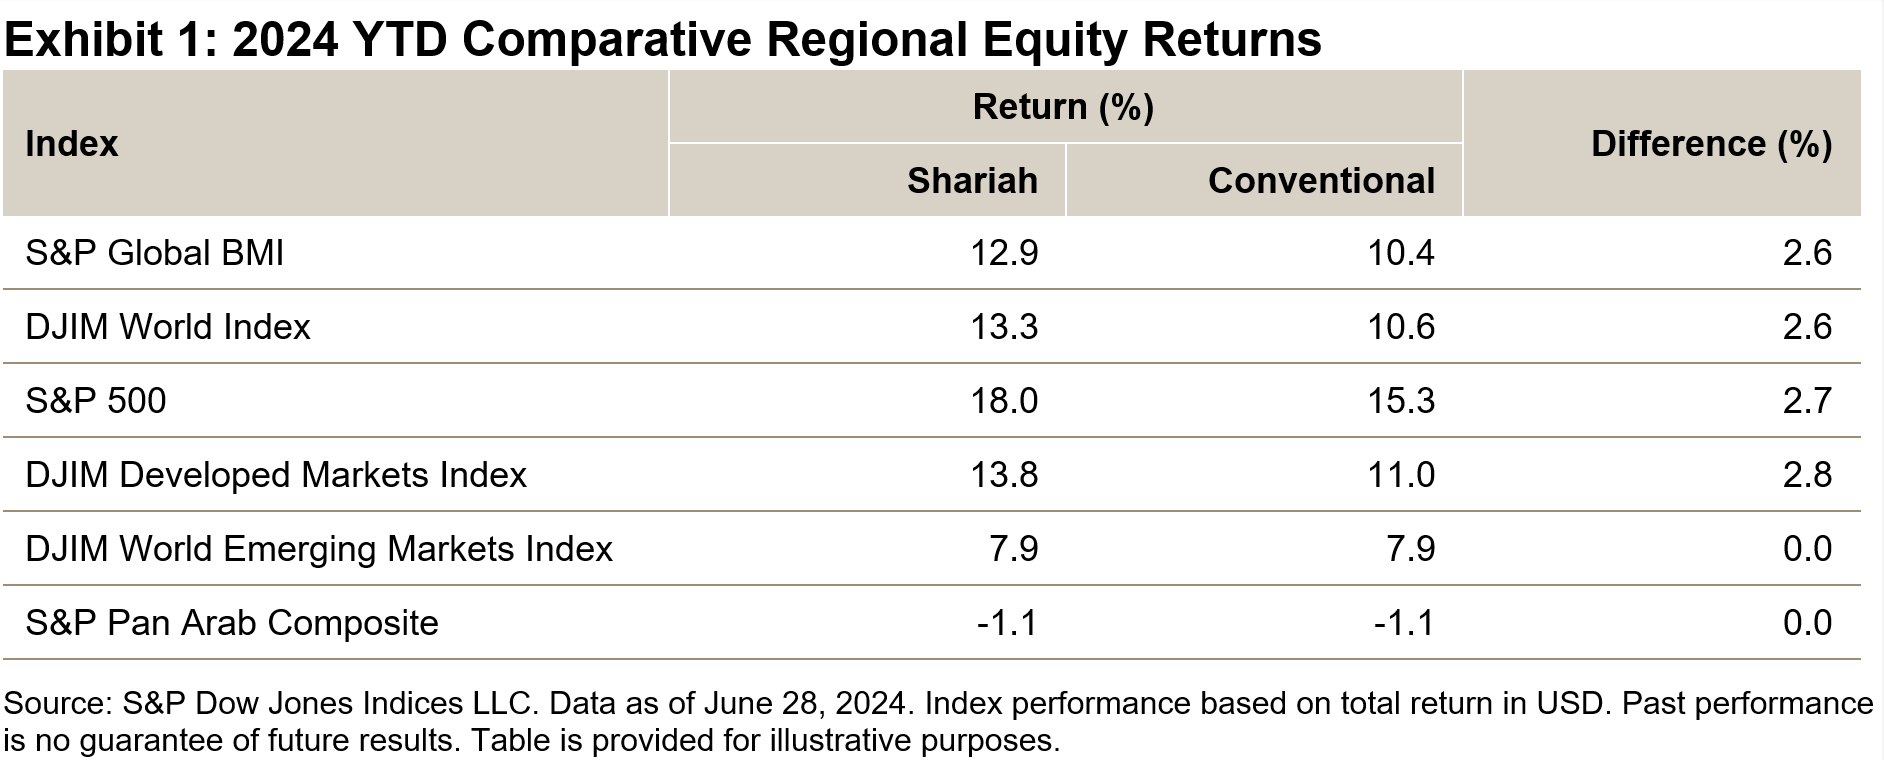
MENA equities diverged from the global trend and remained sluggish. The S&P Pan Arab Composite posted a 1.1% loss in H1, led by Saudi Arabia (-1.5%), UAE (-3.5%) and Qatar (-2.4%). Egyptian equities stabilized after the loan extension by the International Monetary Fund, with the S&P Egypt BMI remaining almost flat in U.S. dollar terms in Q2.

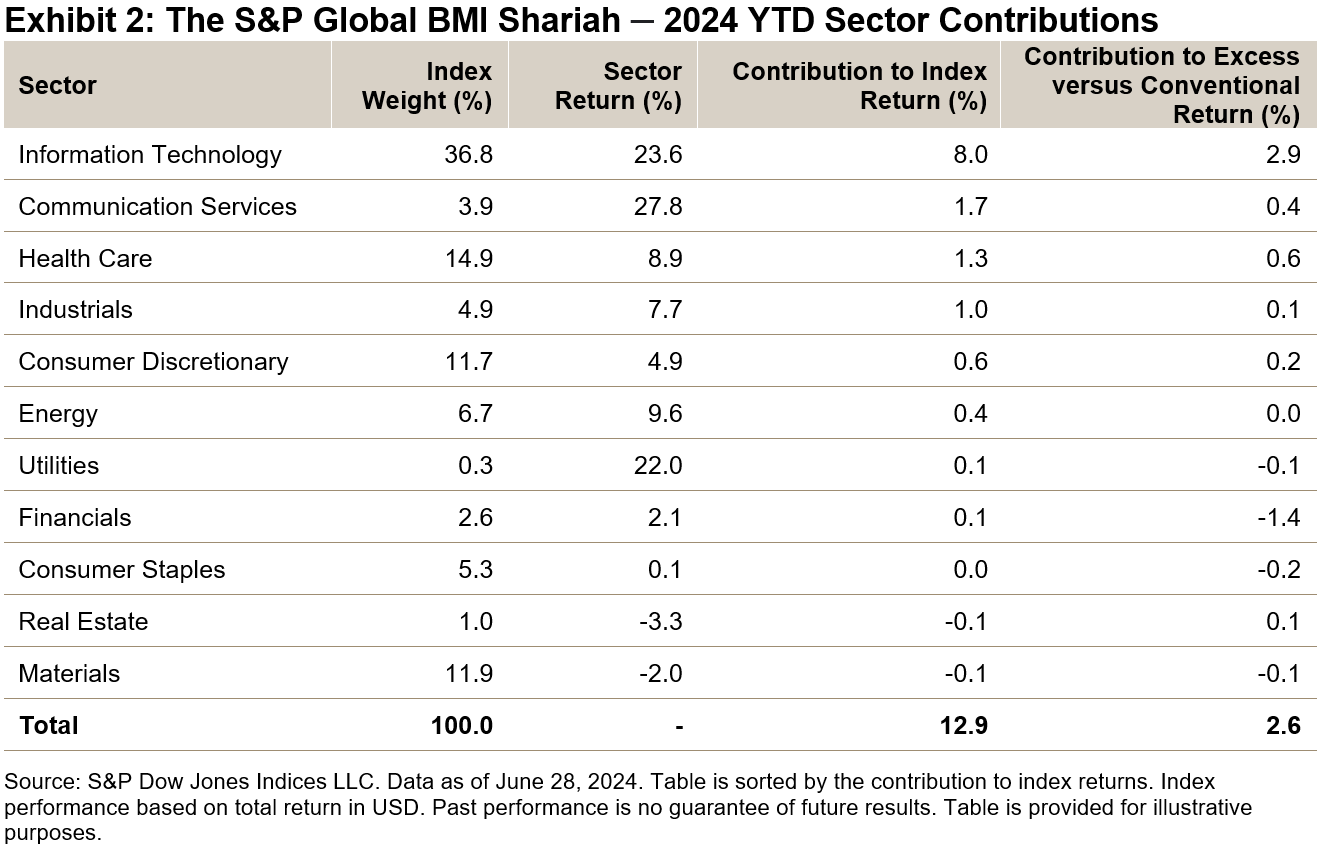
Drivers of Shariah Index Performance in H1 2024

The first six months of 2024 were characterized by the outperformance of large-cap Information Technology and Communication Services companies. Information Technology, which accounts for 36.8% in the S&P Global BMI Shariah versus 24.2% in the S&P Global BMI, contributed 62% of the Shariah index’s return and generated an excess return of 2.9% against the conventional benchmark. On the other hand, Financials brought the heaviest negative effect to the relative performance with an excess return of -1.4%, due to its reduced weightings (2.6% in the S&P Global BMI Shariah versus 15.7% in the S&P Global BMI) as well as the underperformance of Shariah-compliant Financials companies against non-compliant ones (see Exhibit 2).

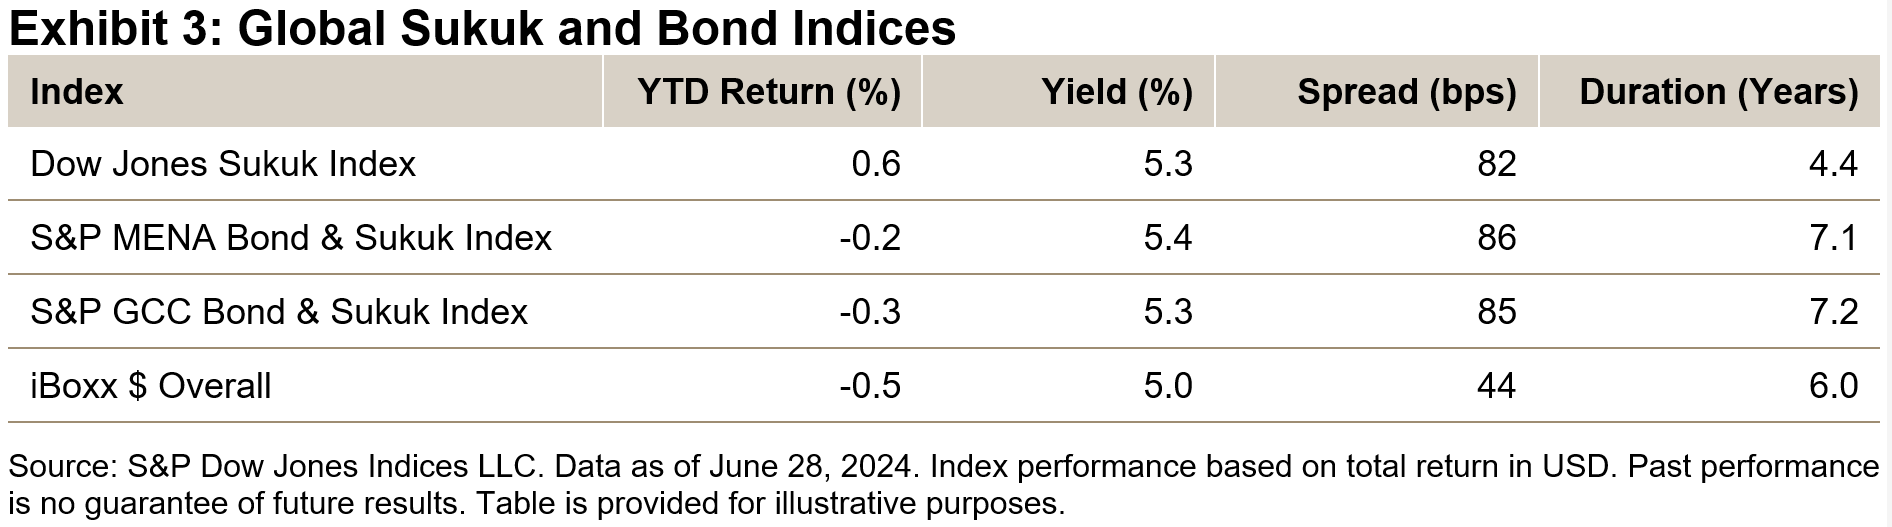
Global Sukuk Gained Modestly in H1 2024

With adjusted market expectations for the U.S. Fed to reduce interest rates in 2024, U.S. dollar-denominated investment-grade bonds remained under pressure globally, resulting in a 0.5% loss in the iBoxx USD Overall in H1. In comparison, the Dow Jones Sukuk Index, which comprises U.S. dollar-denominated investment-grade sukuk, gained 0.6%, largely due to relatively lower duration. The sukuk benchmark had a yield of 5.3% and a spread of 82 bps over the U.S. Treasury bonds as of the end of June 2024.

This article was first published in IFN Volume 21 Issue 29 dated July 17, 2024.

The posts on this blog are opinions, not advice. Please read our Disclaimers.

Dispersion at All-Time High Relative to Volatility as Earnings Season Arrives

Contributor Image
Michael Orzano

Head of Exchange Products and Digital Assets

S&P Dow Jones Indices

Despite a recent uptick to a more normal level near 16, the Cboe Volatility Index (VIX®) has averaged around just 12.8 over the past 30 trading days as of July 18, indicating relative calm in U.S. equities. Meanwhile, a complementary measure of U.S. equity market risk, the CBOE S&P 500® Dispersion Index (DSPX), has surged to multi-year highs in the mid-thirties—suggesting the market expects unusually large swings in single stock prices during earnings season.

Typically, DSPX is positively correlated to VIX, so when VIX is high and the S&P 500 is experiencing large day-to-day moves, underlying stocks tend to have larger swings and therefore higher dispersion. For example, both VIX and DSPX reached their all-time highs during the height of the COVID-19 selloff in March 2020. Additionally, DSPX tends to rise somewhat during earnings season as traders anticipate greater idiosyncratic performance of companies as earnings reports are released.

That said, a particularly unusual aspect of the current environment is how high implied dispersion is compared to implied volatility. In fact, the spread between DSPX and VIX recently reached an all-time high stretching back to the beginning of the back-tested history of DSPX in 2014 (see Exhibit 1).

A key driver dampening overall U.S. market volatility of late has been historically low correlation. In fact, the correlation between the S&P 500 constituents fell to a rare 0.06 for the month of June, indicating stocks have often been moving in divergent directions. Likewise, the Cboe 3-Month Implied Correlation Index—which measures the market’s expectations for the S&P 500 index constituent correlation based on options prices—reached all-time lows over the past few weeks.

The high-dispersion and low-correlation environment has been visible in several corners of the market even for casual observers. For example, Information Technology stocks have rocketed higher over the past year—with those being viewed as the major beneficiaries of AI, like Nvidia, experiencing the largest gains within the sector. On the other hand, Real Estate, Energy and Materials stocks have significantly lagged the broader market over this period. Interestingly, over the past few trading sessions, we’ve seen a reversal in leadership, with Info Tech stocks sinking while Energy and Real Estate have experienced gains.

Important to note is that the current dynamic is an extension of a trend that has been playing out over the past few years. Exhibit 2 illustrates the transformational shift in risk dynamics of U.S. equities over the past five years. VIX reached its all-time high during the height of the pandemic selloff in March 2020 as macro events overwhelmed underlying fundamental drivers of risk. As we emerged from the pandemic and markets calmed, we started to see more pronounced divergence in sector and stock level performance. That trend has continued to intensify, bringing us to where we are today with idiosyncratic factors overpowering macro risk.

With the U.S. presidential election taking place in less than four months, it will be interesting to see how the risk landscape in U.S. equities may further evolve. However, one thing is true, VIX continues to be the most essential gauge of market volatility, and using a range of equity market risk indicators—such as DSPX—can provide deeper insight into the volatility landscape.

The posts on this blog are opinions, not advice. Please read our Disclaimers.

S&P Dividend Aristocrats and the Search for Income

A company’s dividend track record is often seen as a sign of corporate maturity and balance sheet strength, but not all dividend strategies are created equal. Join S&P DJI’s Anu Ganti, Ben Voros and Elizabeth Bebb for an exploration of what makes the S&P Dividend Aristocrats Index Series unique.

The posts on this blog are opinions, not advice. Please read our Disclaimers.

Of Tariffs Tango and Manufacturing Moves

Contributor Image
Srineel Jalagani

Senior Director, Thematic Indices

S&P Dow Jones Indices

It’s well known that as the U.S. consumer goes, so goes its economy. Various estimates suggest that around 67% of U.S. GDP depends on consumer spending. At the macro level, all this consumer spending translates into the consumption of goods and services. The U.S. economy, like most developed economies, comfortably falls into the category of a service-driven economy. Although manufacturing’s contribution to nominal U.S. GDP is small, the manufacturing segment is a closely tracked macroeconomic metric that forms part of the Leading Economic Indicators (LEI) basket to track the economic cycle.

Manufacturing in Policy Crosshairs

On the global stage, the manufacturing segment has come under increased scrutiny in the current geopolitical climate, as approximately 50% of the world’s population heads to the voting booth. The peak pandemic supply chain disruptions exposed the fault lines around the Just-In-Time manufacturing framework, which was optimized for low cost above all else. There is now a reassessment of these supply chains with increased emphasis on resilience to global disruptions (e.g., the COVID-19 pandemic) and perceived national security threats.

Tariffs have increasingly been used as a policy instrument by governments even before the pandemic, as part of a carrot-and-stick approach to rejuvenate domestic manufacturing. While not all tariffs induce growth in local manufacturing, both the previous and current U.S. administrations have cited increased domestic manufacturing as a major factor in applying tariffs. On the carrot side of this approach, the current administration’s fiscal spending programs also allocate a sizable amount to incentivize local manufacturing. Companies and financial markets have also responded to this evolving trend, with references to “reshoring” and related terms in the earnings calls soaring in the last couple of years.1

Fabrication with a Focus

The S&P U.S Manufacturing Select Index was launched in April 2024 and tracks U.S.-listed companies that have a significant portion of their revenue sourced from U.S. markets, and whose revenue streams fall into one of the 11 industry group categories as defined within FactSet’s Revere Business Industry Classification System (RBICS) Focus framework. The index is weighted using an adjusted float-market-cap approach, optimized for constraints to provide constituent-level and RBICS category-level diversification.

The 11 revenue categories for this index are spread across three main RBICS Focus sectors—Industrial Manufacturing, Consumer Vehicles and Parts, and Electronic Components and Manufacturing. These categories are selected based on their direct relevance to U.S. tariffs and legislations targeting a U.S. manufacturing resurgence. Fractious geopolitics are expected to bring about a new era of increased defense spending, and some of the selected revenue categories also align with U.S. strategic priorities around building a “resilient industrial base.”

FactSet’s Geographic Revenue data categorizes approximately 67% of the index constituents’ revenue being sourced from the U.S. As expected, the latest basket is heavily tilted toward the Industrials sector (approximately 75%), with Machinery, Electrical Equipment, and Aerospace & Defense as the primary industries. The index is balanced across the RBICS industry groups, with the 5 biggest groups accounting for 52% of the index weight.

The index’s five-year performance has been robust, slightly outperforming its starting universe of the S&P United States BMI, as well as the S&P 500 Industrials.

Conclusion

The world’s largest economy is pushing to reimagine its manufacturing sector for greater resilience in an environment of increased supply chain risks, coupled with attention to national security concerns. The S&P U.S. Manufacturing Select Index tracks a subset of companies belonging to a curated list of RBICS revenue focus categories, which we believe are closely aligned with industries at the forefront of these manufacturing shifts—sometimes characterized as “reshoring.” This multifaceted approach leads to index constituents not only from the Industrials sector, but also from Information Technology (Semiconductors segment) and Consumer Discretionary (Consumer Vehicles segment) sectors.

1 Sources: ETFStream, The Wall Street Journal, Yahoo Finance and Bank of America Institute.

The posts on this blog are opinions, not advice. Please read our Disclaimers.

Frequent Flyers

Contributor Image
Joseph Nelesen

Head of Specialists, Index Investment Strategy

S&P Dow Jones Indices

Planes are interesting places, airborne aluminum tubes stuffed with strangers from all walks of life, including seatmates prodding with the proverbial ice-breaker, “So, what do you do?” Overhearing many such conversations, I’ve found complicated job descriptions elicit blank stares and subsequently lead to higher-level answers such as “Well, I’m in tech,” or “I work in finance,” or “Been in energy my whole career,” followed by the “Ahhhh, OK!” of understanding. That’s because every profession, truly everything, falls into an industry that ultimately rolls up into one of the 11 GICS® sectors, and after frequently observing the ups and downs of sectors as they gather mileage over the years, we all know what they “do.”

We also know sectors are globally relevant, immense in size and important to nearly every economic discussion and investment strategy. That’s why we continue to research their application, including in our recent paper: Natural Selection: Tactics and Strategy with Equity Sectors.

While the S&P 500’s USD 45 trillion total market cap reflects the U.S.’s position as the largest equity market in the world, individual S&P 500 sectors are also prominent, with many surpassing the total market cap of major single-country equity markets, as shown in Exhibit 1.

Since their inception, the use of S&P 500 Sector Indices as benchmarks for products has become increasingly widespread around the world. From the Middle East to the U.K., Japan and beyond, possible applications of S&P 500 sectors range from avoiding home bias and diversifying sector exposures to driving performance through tactical and strategic sector tilts. For evidence of the continuing growth of sector applications, one need not look further than the aggregate assets under management (AUM) in globally domiciled sector and industry index instruments (exchange-traded funds [ETFs] and futures), as shown in Exhibit 2.

Growth in sector assets could be a byproduct of investors worldwide understanding not only what each sector includes, but also how each sector historically tended to perform in different phases of the economic cycle. The differentiated holdings and low correlations of excess performance among sectors and industries has offered the possibility of seeking outperformance through sector tilting or rotation.

For example, categorization of sectors into cyclical groupings (those that have historically tended to exhibit higher beta and outperform during expansions) and defensive groupings (those that have tended to exhibit lower beta and outperform during declines) can also be effective. Categorizing sectors into defensive or cyclical groups based on ranking their risk attributes and their excess returns during rising or falling markets can offer insight into the potential outcome of sector tilts that historically achieve relatively better performance in each environment. Exhibit 3 illustrates this point, showing the average rolling three-month excess performance of S&P 500 sectors during periods when the S&P 500 was rising or falling.

While the eventual rise and fall of markets seems inevitable, no one can perfectly predict how much turbulence we’ll encounter during the journey. Fortunately, sectors are one tool to understand and navigate through whatever bumps are encountered along the way.

The posts on this blog are opinions, not advice. Please read our Disclaimers.