


Passive investing has historically been more associated with equities than with fixed income, but recent data indicates a change could be in the winds. S&P DJI’s Tim Edwards and Anu Ganti take a closer look at what’s driving the shift and what a passive transformation could mean for fixed income markets.
The posts on this blog are opinions, not advice. Please read our Disclaimers.Exploring Fixed Income’s Passive Potential
Using Innovative Tools to Dynamically Manage Risk
The Ethics of Artificial Intelligence
The S&P/ASX Index for “Larger,” More Liquid Small Caps
Time, Trust and Trading
Exploring Fixed Income’s Passive Potential
Using Innovative Tools to Dynamically Manage Risk
- Categories Multi-Asset
- Tags decrement indices, risk, risk management, S&P 500 Futures 35% Edge Volatility 6% Decrement Index, S&P 500 Futures 35% Edge Volatility Index, S&P 500 Futures 40% Edge Volatility 6% Decrement Index, S&P 500 Futures 40% Edge Volatility Index, S&P 500 Futures Edge Volatility Indices, S&P 500 Futures Index, target volatility, volatility, Volatility Management
Advances in volatility-based benchmarking have paved the way for the development of innovative tools for dynamically managing risk. Meet the S&P 500 Futures Edge Volatility Index Series, the next generation of volatility management benchmarks.
The posts on this blog are opinions, not advice. Please read our Disclaimers.The Ethics of Artificial Intelligence

The ever-evolving artificial intelligence (AI) landscape has generated excitement, interest and investment; it has also triggered important questions regarding AI’s impact on businesses, on investment portfolios, on society and on the environment. When factoring in elements such as the high energy requirements of training large language models (LLMs), direct and indirect emissions and the diversity of typical AI company boardrooms, the intersection of AI technology with environmental and governance concerns highlights a complicated ethical landscape. Access to robust datasets becomes critical to measure and assess the likely answers to these questions.
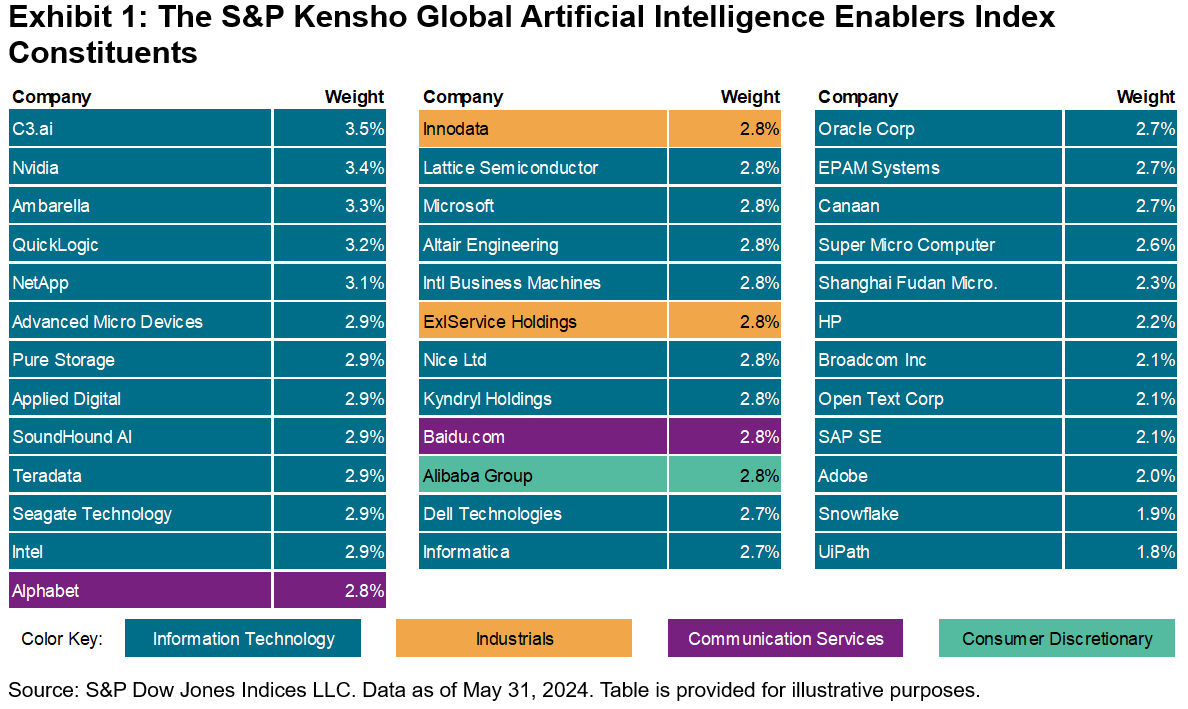
Indices can play a major role in revealing deeper insights about specific industries or investment themes such as AI. Offering a comprehensive perspective on companies involved in the space, the S&P Kensho Global Artificial Intelligence Enablers Index1 (S&P Kensho Global AI Enablers), was launched in October 2023 and currently comprises 37 companies at the forefront of developing and enabling AI technologies (see Exhibit 1).
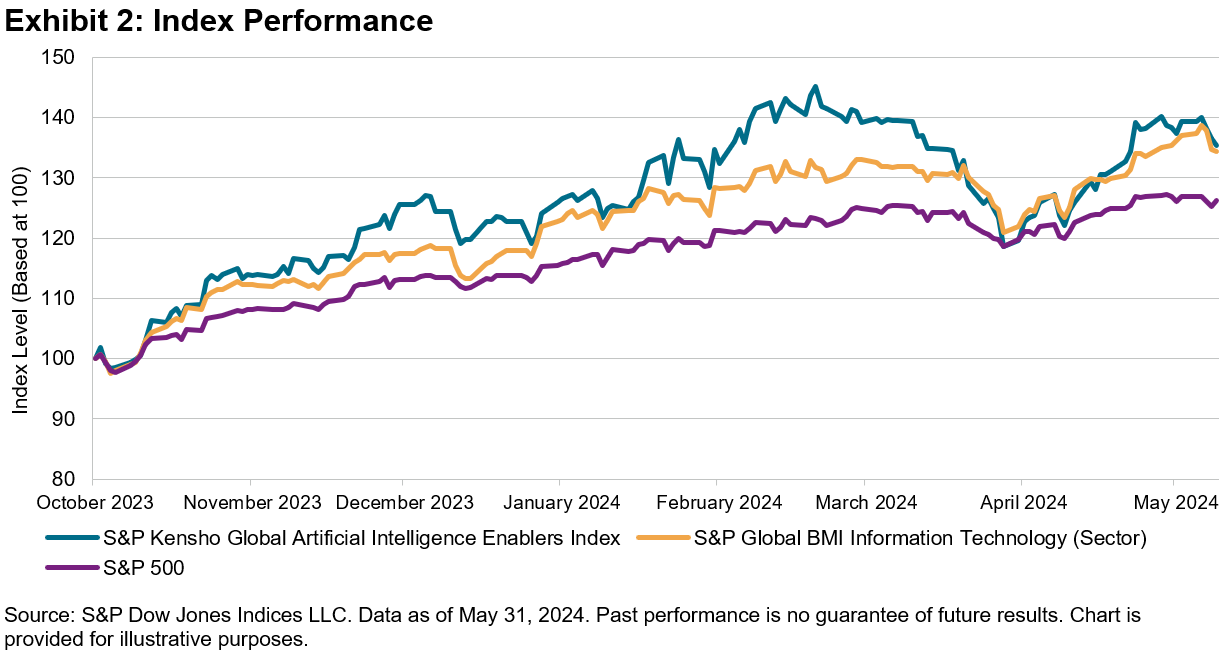
In part due to rising demand for AI-optimized servers, voice technologies, data centers and more, the S&P Kensho Global AI Enablers Index has outperformed the S&P Global BMI Information Technology (Sector) and the S&P 500® since its launch (see Exhibit 2).
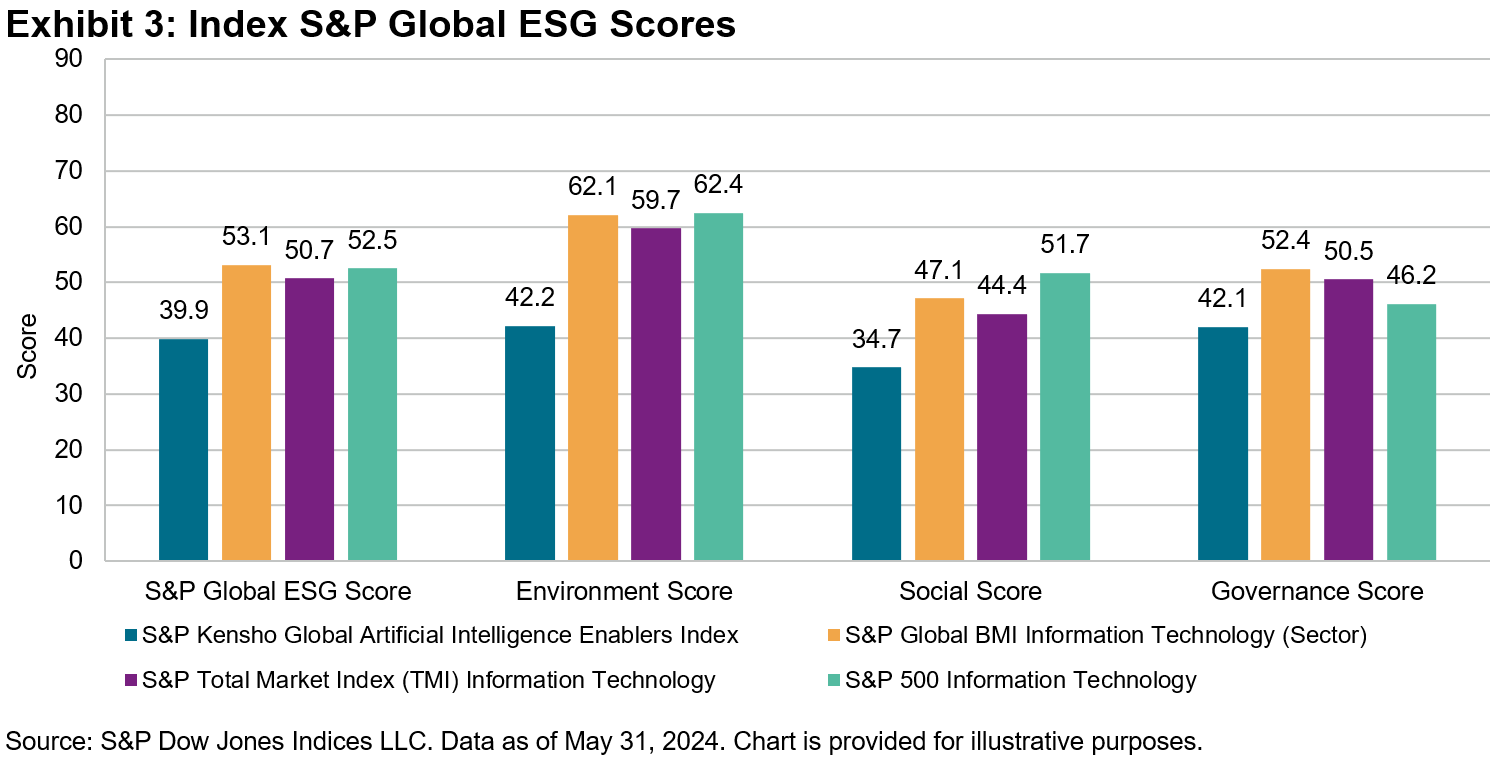
As the spotlight brightens on AI’s potential, questions about sustainability have also come under scrutiny. While ESG metrics do not equate to ethics, they do offer valuable insights into the consequences of AI companies’ business practices. As measured using S&P Global ESG Scores, overall, the S&P Kensho Global AI Enablers Index currently holds lower “E,” “S” and “G” scores than the S&P Global BMI Information Technology (Sector), S&P TMI Information Technology and S&P 500 Information Technology (see Exhibit 3).
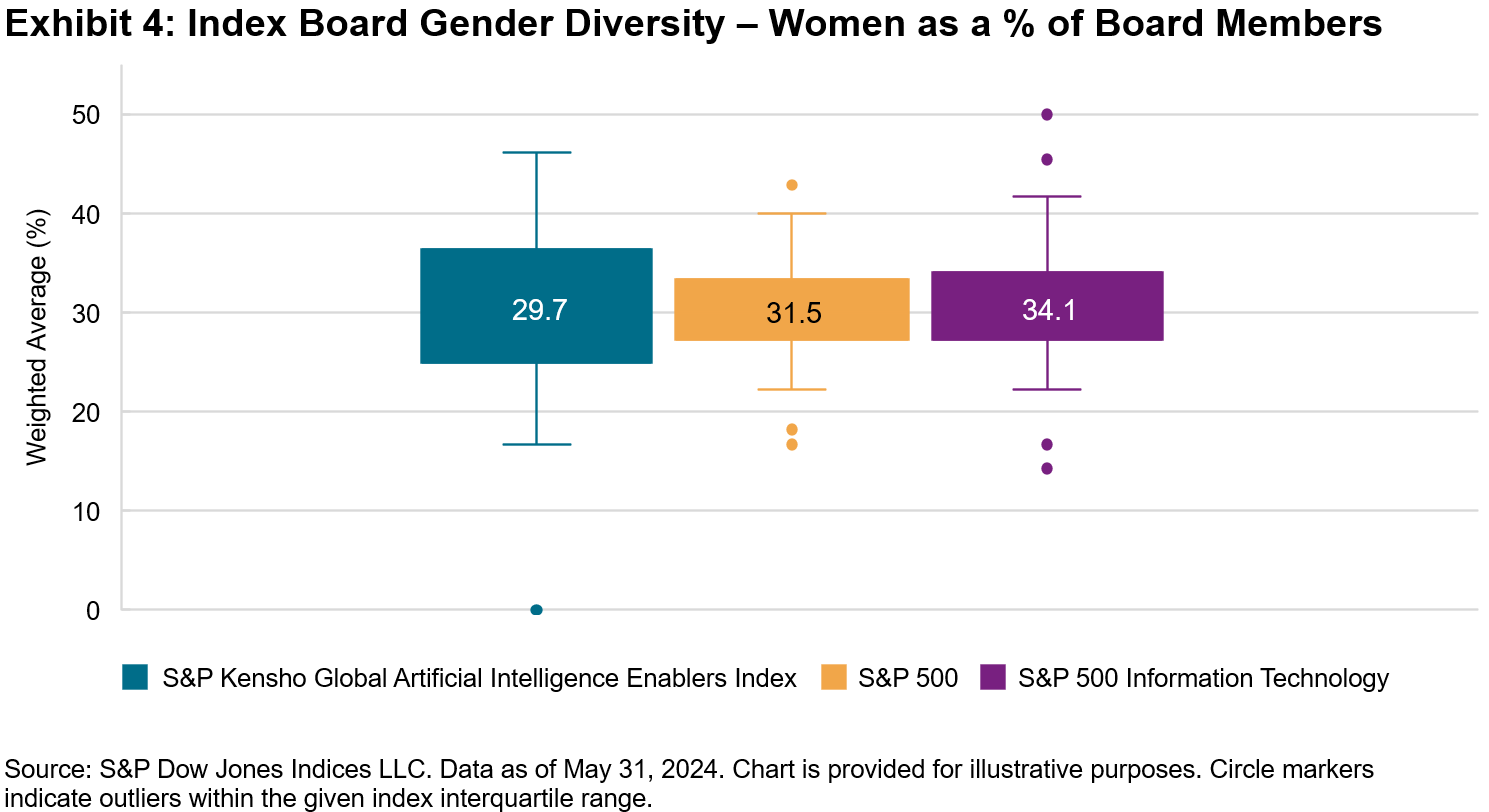
Looking more closely at the Governance score, the S&P Kensho Global AI Enablers Index scored worse on the Board Gender Diversity metric, with a weighted average of only 30% women on AI constituent boards. In some cases, there are no women at all. This index’s average is lower than that of the notoriously male-dominated U.S. tech sector. However, the lower average doesn’t tell the whole story. In fact, gender diversity scores in the AI index are highly dispersed and highlight that there are a number of companies that do relatively well on this metric compared to other indices (see Exhibit 4).
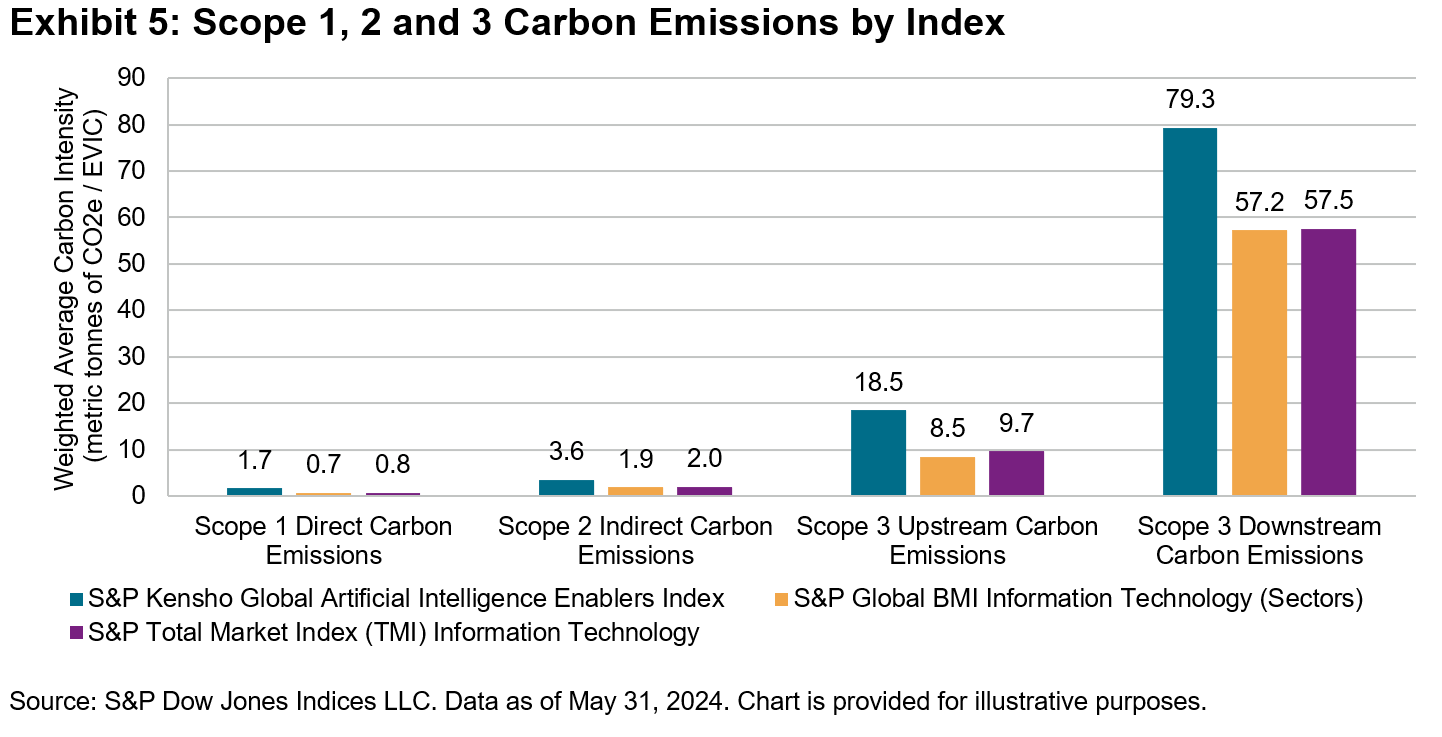
Many AI companies also differ from their benchmarks on environmental metrics. Notably, training AI may not burn fossil fuels directly, but it can take a lot of computing power (and hence energy), potentially via a third party (e.g., cloud computing services). Along with market convention, S&P Global Trucost’s carbon data set breaks down corporate emissions into Scope 1, Scope 2 and Scope 3. Scope 1 includes direct carbon emissions from owned sources; Scope 2 includes indirect emissions from purchased electricity; and Scope 3 emissions involve all other indirect emissions in the value chain that can be divided into upstream and downstream. Indirect emissions classified as Scope 3 upstream occur from supply chain activities such as procurement and logistics, and Scope 3 downstream emissions stem from product use (see Exhibit 5).
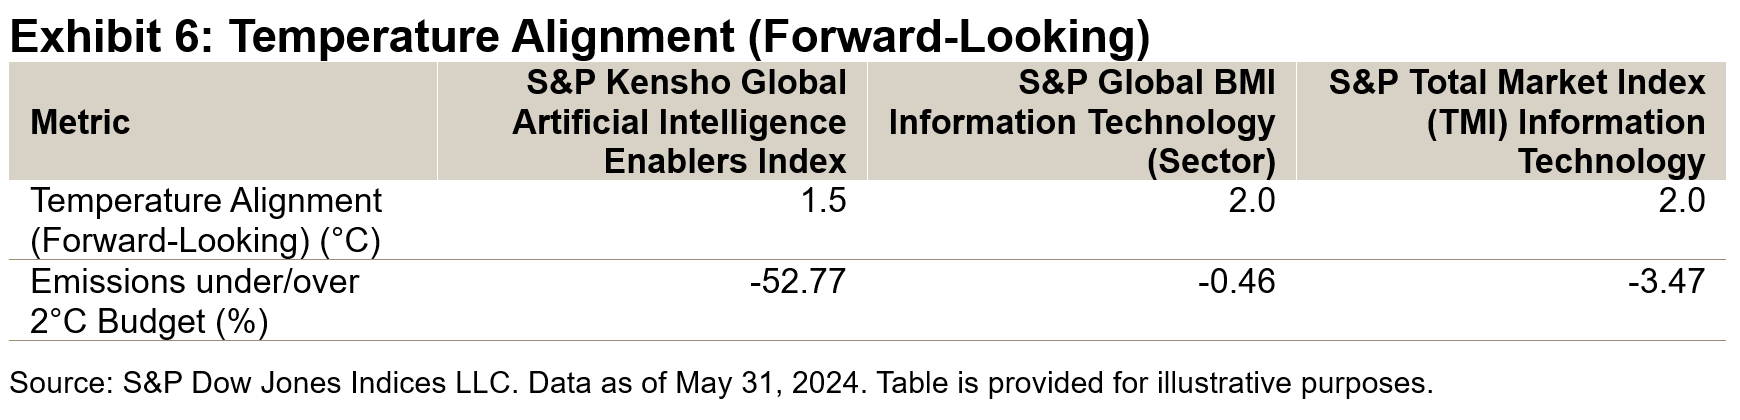
In addition to the emissions data, S&P Global also provides data on temperature alignment. While carbon intensity measures current greenhouse gas emissions relative to economic value, the Temperature Alignment metric assesses how well a company’s emissions trajectories align with global temperature targets, such as 1.5°C or 2°C, thus focusing on long-term climate goals. This metric is key in assessing a company’s commitment and capability to mitigate climate risks, as well as its alignment with global climate goals.
Ultimately, the ethics and environmental impact of AI companies is nuanced, reflecting both extensive energy requirements and efforts to improve efficiency and sustainability, as well as the relative efficiency of AI-linked revenues. Indices such as the S&P Kensho Global Artificial Intelligence Enablers Index, and the data perspectives powered by S&P Global ESG Scores and climate data sets, can help market participants to not only understand how AI drives market performance, but also to assess its potential impact in a broader context.
1 The S&P Kensho Global Artificial Intelligence Enablers Index adopts a modified equal weighting scheme (with a overweight towards core companies where a significant portion of business operations and/or revenue are derived from products and services aligned with the theme).
The posts on this blog are opinions, not advice. Please read our Disclaimers.The S&P/ASX Index for “Larger,” More Liquid Small Caps

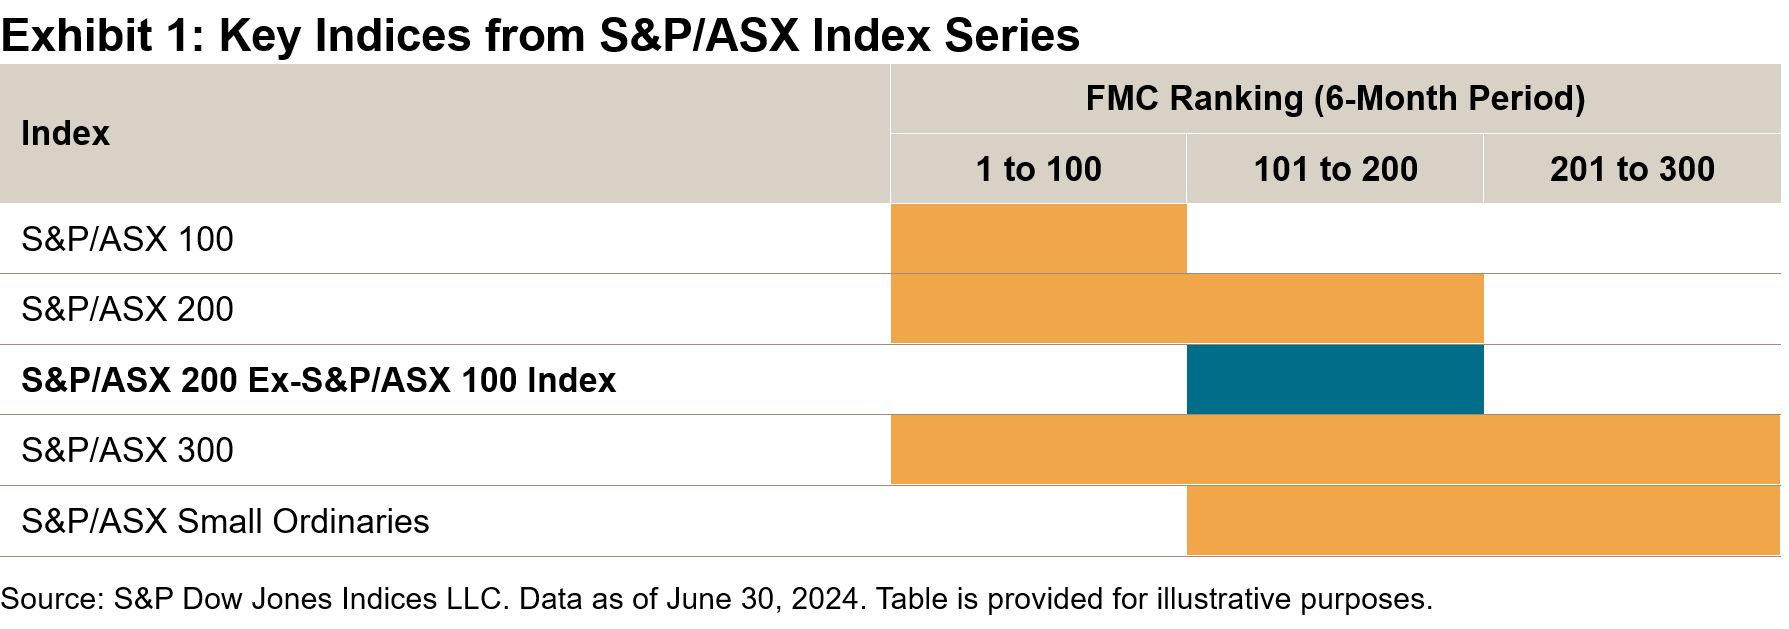
What would you get if you carved out the 100 smallest companies in the S&P/ASX 200 into their own index? You’d have the S&P/ASX 200 Ex-S&P/ASX 100 Index. Alternatively, you’d have also segmented the largest 100 companies in the S&P/ASX Small Ordinaries.
Companies listed on the ASX are grouped into broad market, large-, mid- and small-cap segments; these segments are represented by S&P DJI’s suite of S&P/ASX Indices, including the S&P/ASX 50, S&P/ASX 100, S&P/ASX 200, S&P/ASX 300, S&P/ASX MidCap 50 and the S&P/ASX Small Ordinaries. However, there is less awareness of the S&P/ASX 200 Ex-S&P/ASX 100 Index, which is gaining traction as a more liquid “big brother” to the S&P/ASX Small Ordinaries.
More Meaningful Representation of “Larger” Small-Cap Companies
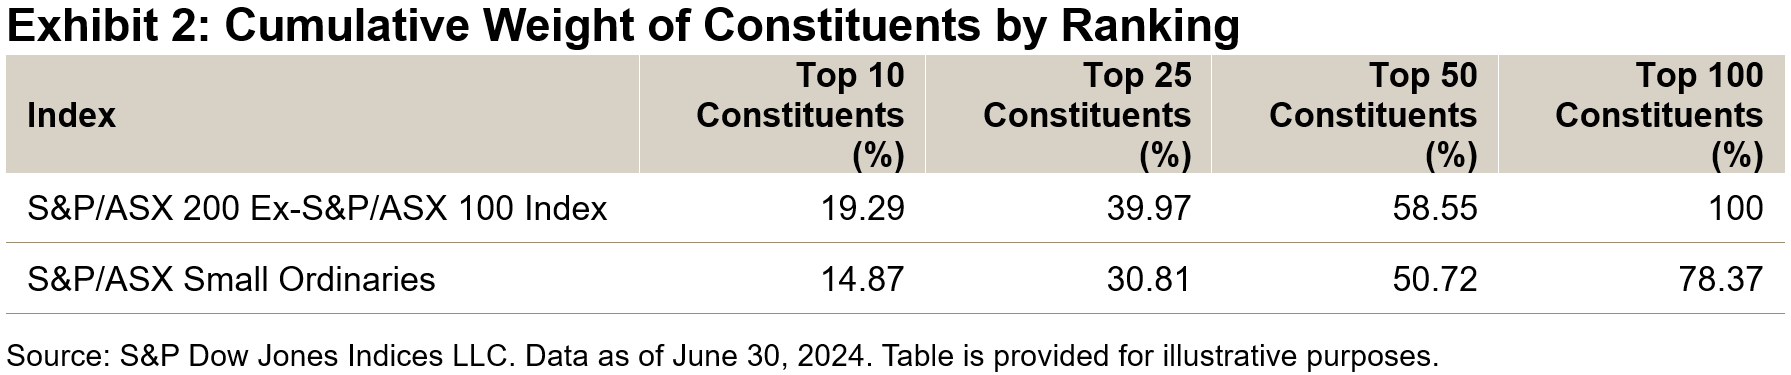
In terms of the number of constituents, the bottom half of the S&P/ASX 200 currently represents less than 10% of its index weight. Meanwhile, the top half of the S&P/ASX Small Ordinaries amounts to nearly 80% of its index weight.
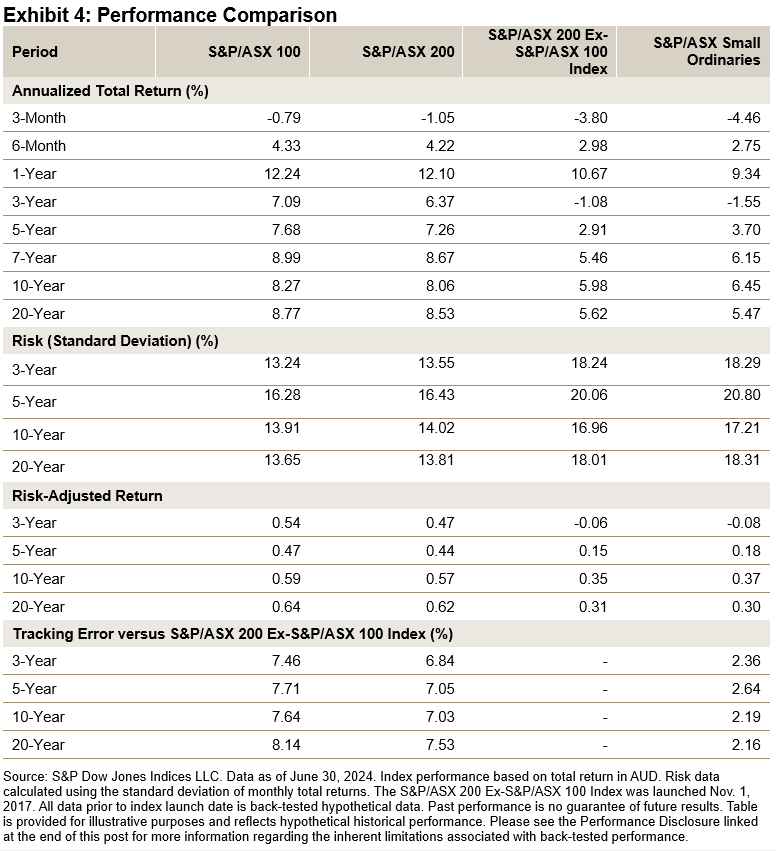
The S&P/ASX 200 Ex-S&P/ASX 100 Index measures the 100 larger small-cap constituents, with added representation compared to the broader small-cap index. For example, while the top 10 companies in the S&P/ASX 200 Ex-S&P/ASX 100 Index and the S&P/ASX Small Ordinaries are the same, in the S&P/ASX 200 Ex-S&P/ASX 100 Index they comprised 19.29% of the index weight compared to 14.87% in the broader small-cap index, as of Q2 2024.
Improved Sector Diversification outside the Top 100
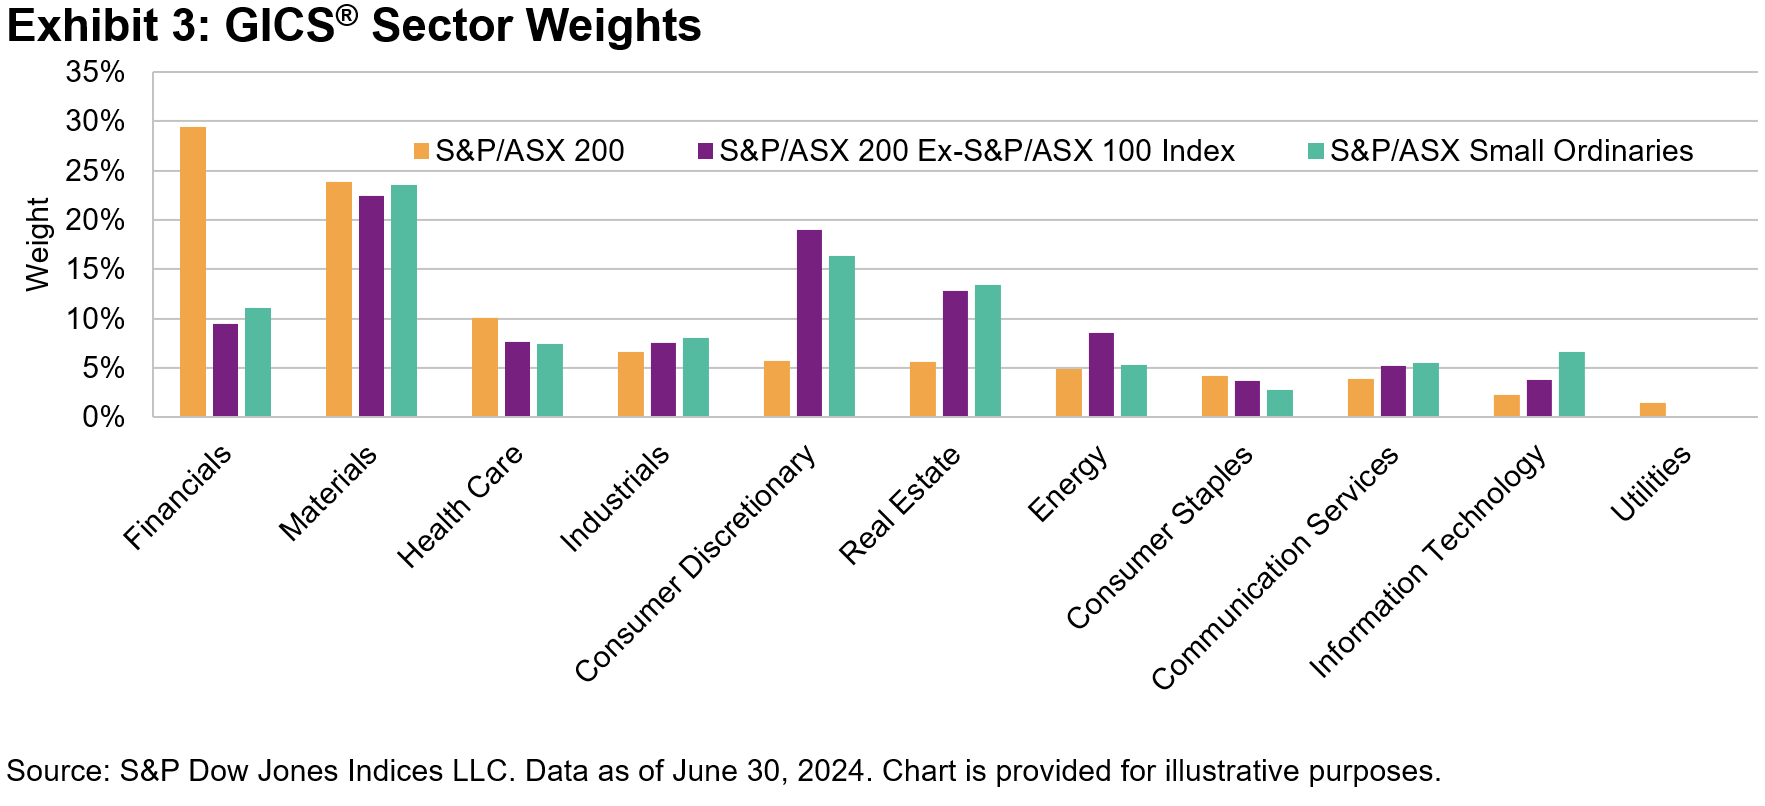
It’s well known that the big banks and large miners represent significant index weights within the S&P/ASX 200. In fact, the Financials and Materials sectors alone comprise over 50% of Australia’s flagship large-cap index.
Because it removes the top 100 companies, the S&P/ASX 200 Ex-S&P/ASX 100 Index has significantly less weight in Financials and has more representation to companies within the Consumer Discretionary, Energy and Information Technology sectors. As expected, sector weights for the S&P/ASX 200 Ex-S&P/ASX 100 Index are similar to the S&P/ASX Small Ordinaries, but with slightly more representation to the Consumer Discretionary and Energy sectors and less representation in Information Technology companies.
Large Caps Have Driven Recent Market Performance
In terms of risk/return characteristics, sector weights and tracking error, the S&P/ASX 200 Ex-S&P/ASX 100 Index aligns closely to the S&P/ASX Small Ordinaries. Australian large caps have outperformed small caps YTD and over the one-year period (see Exhibit 4). Consequently, the S&P/ASX 200 Ex-S&P/ASX 100 Index has slightly outperformed the S&P/ASX Small Ordinaries. Conversely, in markets where small caps lead performance, we would expect the broader S&P/ASX Small Ordinaries to outperform.
More Liquidity to Be Found in the “Larger” Small Caps
While its risk/return characteristics have been closely aligned with the S&P/ASX Small Ordinaries, the S&P/ASX 200 Ex-S&P/ASX 100 Index has some significant differences in terms of company size and liquidity.
As of June 30, 2024, the total index market cap of the S&P/ASX 200 Ex-100 Index was AUD 190.6 billion, which comprises approximately 78% of the AUD 247.3 billion for the S&P/ASX Small Ordinaries. The average and median sized companies in the S&P/ASX 200 Ex-S&P/ASX 100 Index are 1.5 times and 1.6 times larger than the S&P/ASX Small Ordinaries, while the smallest company is more than 4 times larger.
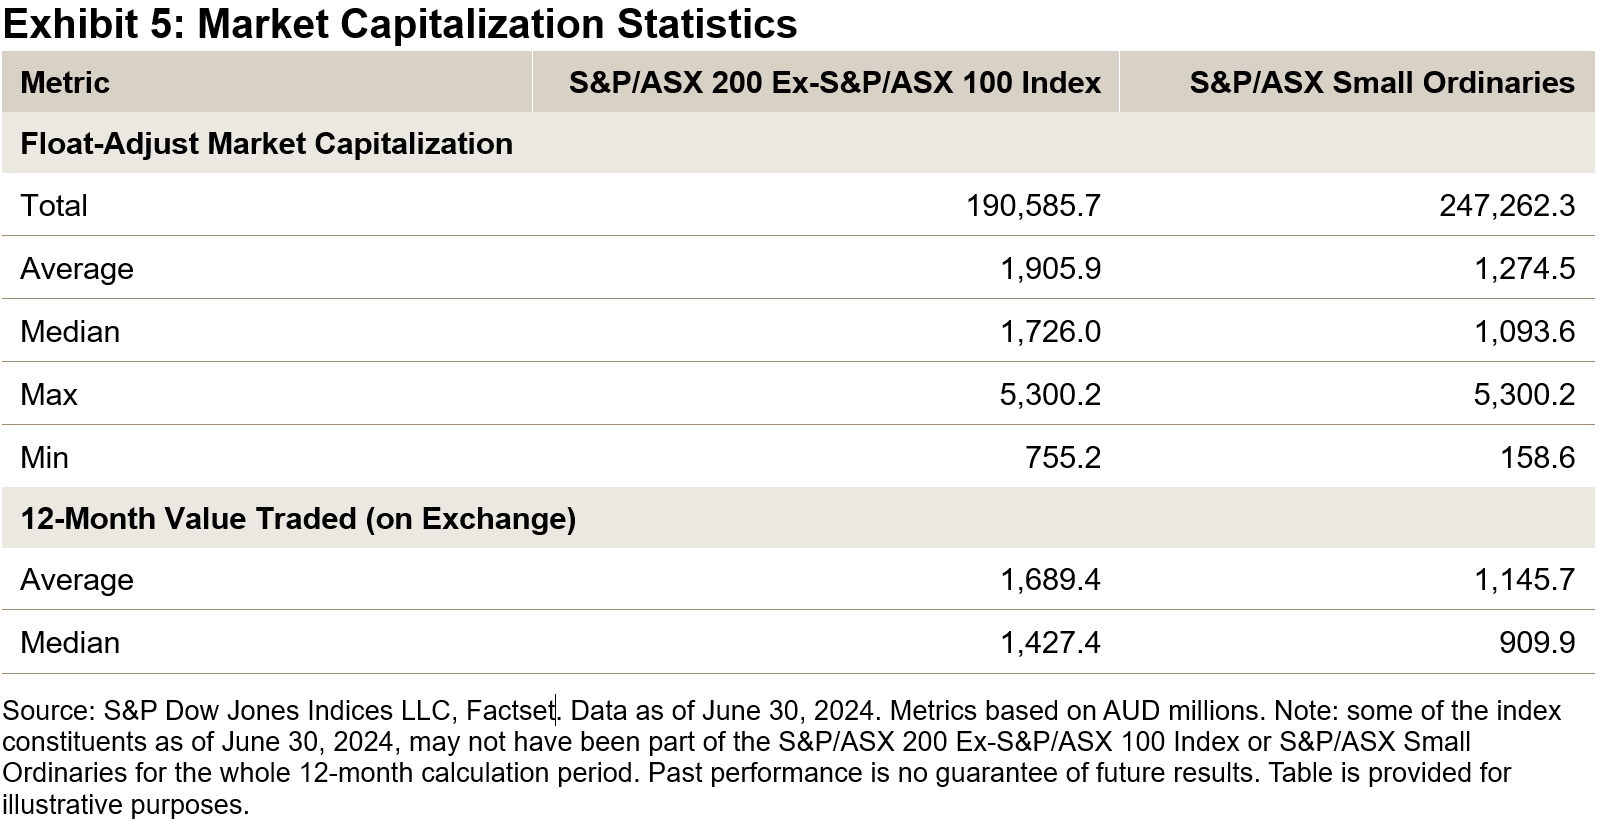
Size matters when it comes to liquidity, and constituents in the S&P/ASX 200 Ex-S&P/ASX 100 Index have generally offered better liquidity than the 200-stock small-cap benchmark. For example, over the one-year period ending June 30, 2024, the average and median constituents in the S&P/ASX 200 Ex-S&P/ASX 100 Index traded more than AUD 500 million compared to the S&P/ASX Small Ordinaries. When looking at daily value traded over the three-month period ending June 30, 2024, constituents in the S&P/ASX 200 Ex-S&P/ASX 100 Index traded about 1.5 times more than the broader S&P/ASX Small Ordinaries.1
Conclusion
The S&P/ASX 200 Ex-S&P/ASX 100 Index provides market participants with a measurement of the top-end of the Australian small-cap segment and has had a similar historical risk/return profile as the more well-known S&P/ASX Small Ordinaries. The S&P/ASX 200 Ex-S&P/ASX 100 Index can be seen as a “larger” small-cap index, offering half the constituents as the S&P/ASX Small Ordinaries but with a significantly improved liquidity profile historically.
1 Source: Factset, using median and average daily value traded for each index constituent as of June 28, 2024 (last trading day of June).
The posts on this blog are opinions, not advice. Please read our Disclaimers.Time, Trust and Trading

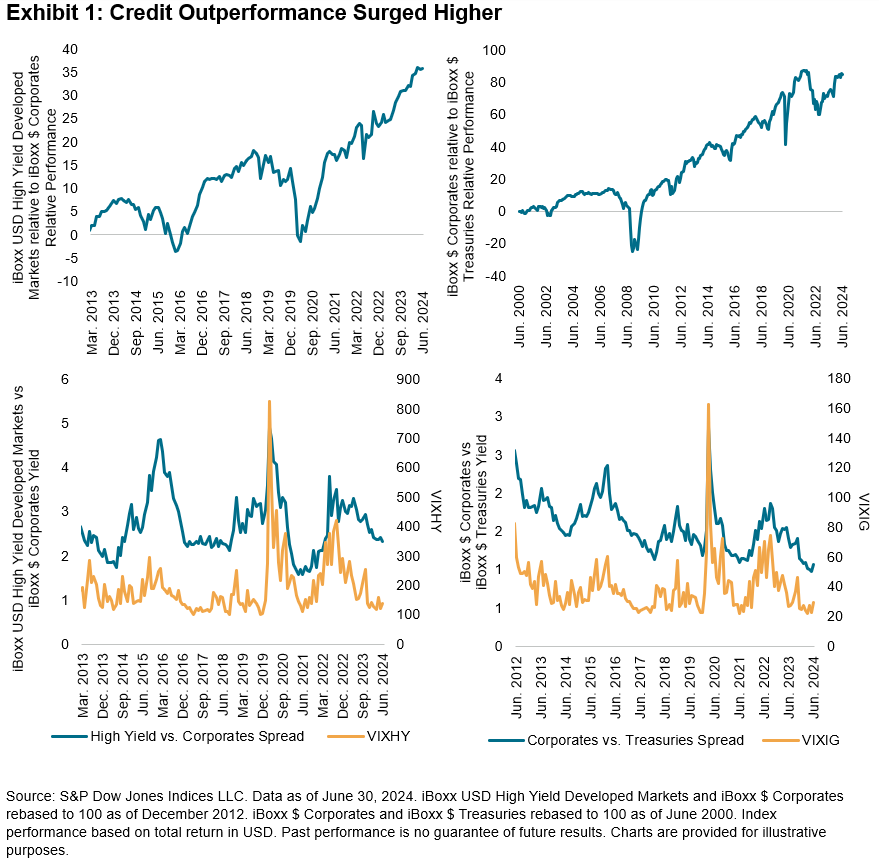
As the bull market in U.S. equities continues, with the S&P 500® up 18% YTD,1 we have witnessed in parallel an extraordinary time in the fixed income markets. Historically low credit spreads have led to the outperformance of high yield bonds relative to corporate bonds and corporate bonds relative to Treasuries. The iBoxx USD High Yield Developed Markets outperformed the iBoxx $ Corporates by 2%, and the iBoxx $ Corporates outperformed the iBoxx $ Treasuries by 1% YTD.1 Consistent with declining spreads, implied credit volatility has been muted. The CDX/Cboe NA Investment Grade 1-Month Volatility Index (VIXIG)2 and CDX/Cboe NA High Yield 1-Month Volatility Index (VIXHY)2 dipped below the 30 and 140 handles, respectively.
But what do these conditions mean for fixed income active managers? We analyze the traditional sources of excess return, one of which is taking on higher term or interest rate risk, as measured by the returns of longer-dated bonds relative to shorter-dated ones. Another source stems from dipping down the credit spectrum toward investment grade or high yield corporates. A final key driver of excess returns comes from greater exposure to illiquid bonds, estimated by the return differential between high yield and investment grade indices and their liquid counterparts.
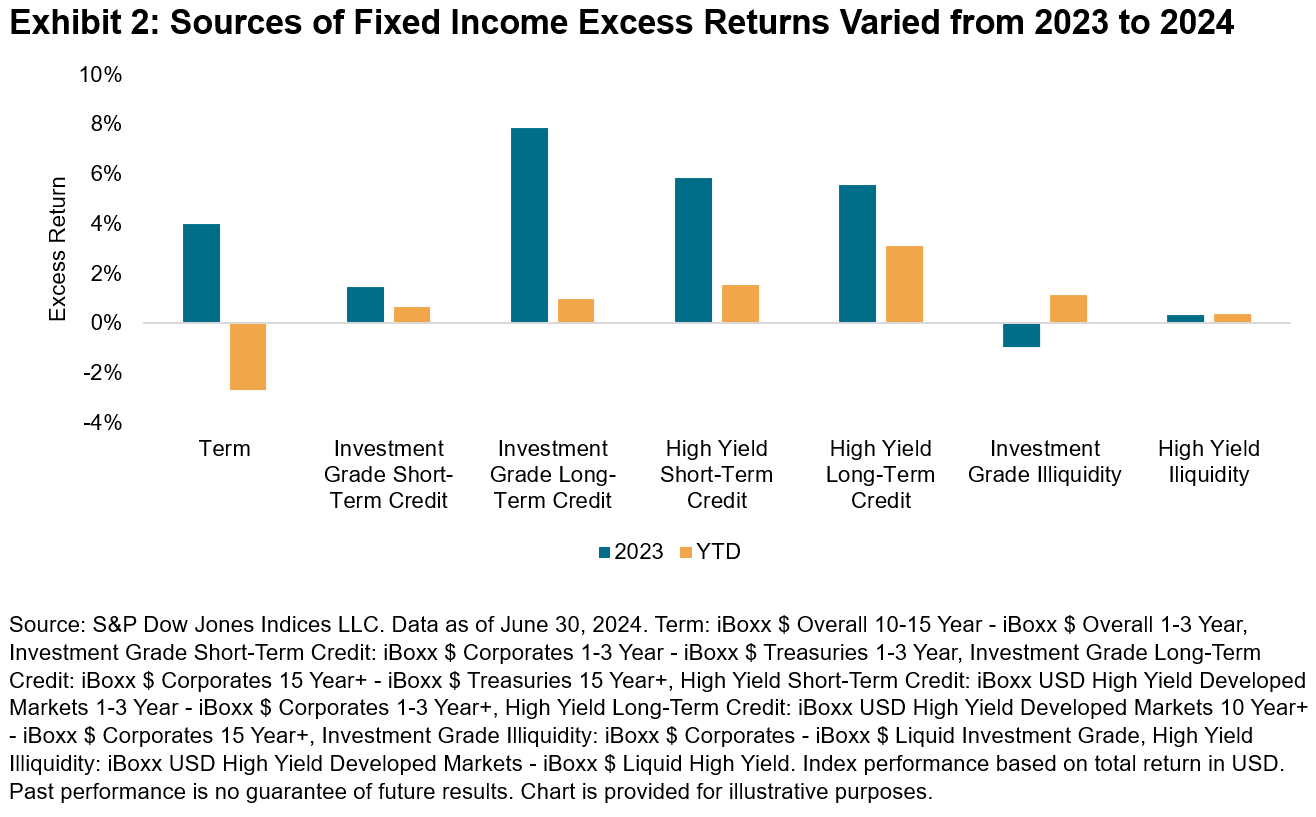
As seen in Exhibit 2, a sharp reversal in the Term category’s excess returns from 2023 to 2024 meant that long duration tilts that would have rewarded managers in 2023 have hurt them so far this year. However, long-term high yield credit exposures continued to be accretive, with excess returns outpacing those of all other reported credit categories. In another reversal from last year, investors may have benefited from taking on illiquid exposures in the investment grade space.
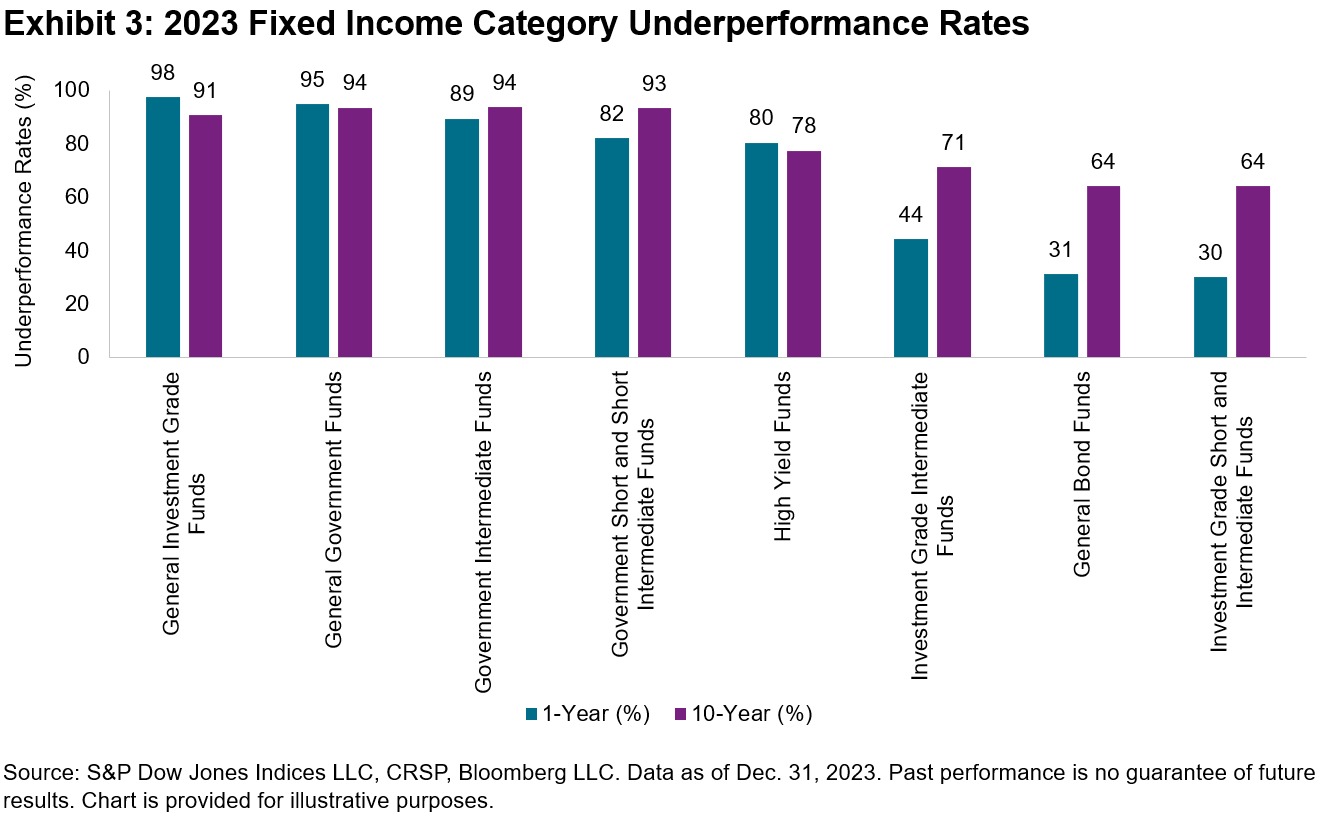
Despite the availability of near-term opportunities to seek excess returns, most fixed income active managers have historically underperformed their benchmarks, particularly over longer horizons. In 2023, most Government funds underperformed across the yield curve. However, Investment Grade Intermediate and Investment Grade Short-Intermediate fund categories posted majority outperformance, as observed in Exhibit 3, perhaps benefiting from longer duration tilts outside the benchmark.
While interest rate, credit and liquidity conditions for the second half of 2024 remain unknown, we can look to history as a guide. Understanding the sources of fixed income excess returns over time may help explain the likelihood of outperformance within the bond markets. For more information across all our reported fixed income categories, please refer to the SPIVA U.S. Year-End 2023 Scorecard.
1 Data as of July 11, 2024.
2 The CDX/Cboe NA Investment Grade 1-Month Volatility Index measures the market’s expectation of the range of movement in the CDX North American Investment Grade Index five-year spreads over the next one month
2 The CDX/Cboe NA High Yield 1-Month Volatility Index seeks to track the market’s expectation of the range of movement in the CDX North American High Yield Index five-year spreads over the next one month.
The posts on this blog are opinions, not advice. Please read our Disclaimers.