


The attacks on Sept. 14, 2019, on Saudi Arabia’s oil facilities have put the oil market back in focus for investors and policy makers alike. The event was reported to have been the largest single supply disruption in the oil market for half a century, crippling half of Saudi oil production and temporarily halting production of 5.7 million bpd or approximately 5% of global oil production. This is a textbook example of a supply shock in a commodity market.
It remains to be seen exactly how long it will take this oil production to come completely back online and what the attack may mean in terms of further instability in the region, as well as the escalation of geopolitical risks in the global oil market. But from an investor’s perspective, there are two interesting observations to highlight regarding the price response in the immediate aftermath of the supply shock.
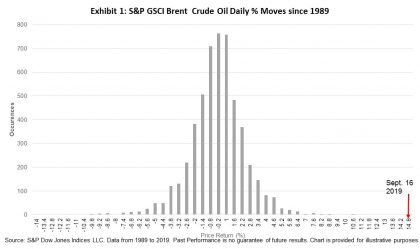
- The price response on the first trading day following the attack was extreme but could also be viewed as an aberration. The S&P GSCI Brent Crude Oil closed 14.2% higher on Sept. 16, 2019, the biggest one-day percentage gain since at least 1989, while the energy-heavy S&P GSCI was up 7.9%. Exhibit 1 offers a visual representation of the size and rarity of this one-day price move in the S&P GSCI Brent Crude Oil.
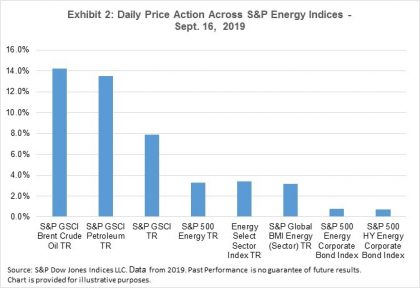
- Not all energy assets are created equal when it comes to their immediate responsiveness to a supply shock. Exhibit 2 illustrates the range of price moves across a variety of S&P DJI energy indices on Sept. 16, 2019. As expected, the supply shock caused by the Saudi attacks had a relatively muted impact on the major equity and fixed income energy indices. The speed and extent to which a physical oil supply shock flows through the balance sheets of companies in the energy sector can vary greatly depending on hedging activity, balance sheet structure, geographic location, financial health, position in the supply chain, asset mix, level of supply chain integration, government regulation and historical beta to the broader equity and debt markets among others.
It remains to be seen what long-term impact, if any, the Saudi attacks will have on oil prices and the value of energy companies’ equity and debt. At one end of the spectrum, the 1990 oil price shock, in response to the Iraqi invasion of Kuwait, saw the S&P GSCI Crude Oil increase 140% between the end of July 1990 and mid-October 1990. On the other hand, there have been numerous short-lived supply-related spikes in oil prices – admittedly not of the size that was witnessed on Sept. 16, 2019 – that were quickly reversed and locked safely in the annals of history.
The posts on this blog are opinions, not advice. Please read our Disclaimers.


 Exhibit 2 displays the stress scenario analysis for the S&P U.S. High Yield Low Volatility Corporate Bond Index since 2000. During the Q4 2018 and early January 2019 sell-off, when the broad market high yield bond index OAS widened by 199 bps from trough to peak, the S&P U.S. High Yield Low Volatility Corporate Bond Index outperformed the broad-based S&P U.S. High Yield Corporate Bond Index by 1.2%, while the latter suffered a loss of 4.1%. Other periods of market stress are also included that point to the defensive nature of the S&P U.S. High Yield Low Volatility Index.
