


This Fall has been a difficult time for property & casualty companies. The fires in Northern California have destroyed thousands of homes and the relentless string of hurricanes have damaged parts of Texas, Louisiana, Florida, Puerto Rico and the U.S. Virgin Islands.
If these companies need to sell fixed income assets to offset liabilities they could impact the U.S. municipal and corporate bond markets. While both of these markets have seen high demand during 2017, a secondary market influx of bonds may be a catalyst that begins to push yields higher.
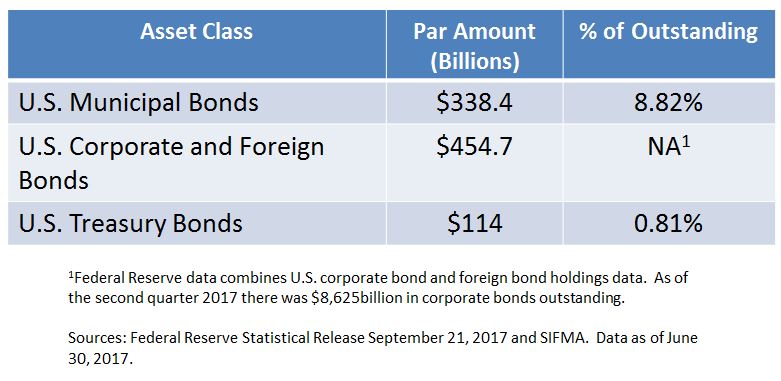
A quick look at data from the Federal Reserve shows the potential. With over $300billion of municipal bonds and over $400billion of corporate and foreign bonds held by these companies shows the pool of assets these companies could tap to offset liabilities is significant.
Munis: While it may appear the most vulnerable, the municipal bond market has had it’s supply / demand equilibrium out of kilter for some time due to low new issuance. The open question would be can it handle a wave of potential selling?
Corporate bonds: Again, U.S. and foreign demand for USD corporate bonds remains strong. Untested all year, this asset class has not seen any real selling pressure to benchmark against.
Table 1) Select asset classes held by property & casualty companies:
Meanwhile, the S&P National AMT-Free Municipal Bond Index (Investment grade) has recorded a 4.89% total return this year and the S&P 500/MarketAxess Investment Grade Corporate Bond Index has returned 5.59% return year-to-date (October 13, 2017.)
The posts on this blog are opinions, not advice. Please read our Disclaimers.


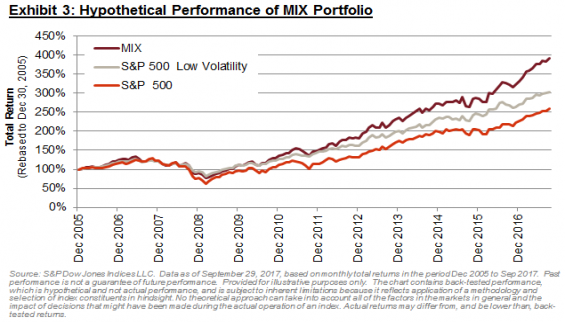
 On a hypothetical basis, the MIX portfolio achieved roughly 100% upside capture (i.e. it did not lag in bull markets), while retaining a considerable degree of protection (77% downside capture). The MIX portfolio also demonstrated favourable performance statistics over longer periods. Over all possible rolling 12-month periods during our study, Low Volatility outperformed around 59% of the time; this increases to 72% for the MIX portfolio (Exhibit 5).
 The
The