Get Indexology® Blog updates via email.

In This List

A New Generation of Buyback Indices: Introducing the S&P 500 Buyback Aristocrats Index

S&P 500 FC 7% Index: The Gold Standard of Indices Meet’s Today’s Technology

Tech Tantrums

The Dow Hits 50,000!

S&P Global Dividend 100 Index: Where High Yield Meets Quality

A New Generation of Buyback Indices: Introducing the S&P 500 Buyback Aristocrats Index

Contributor Image
Rupert Watts

Head of Factors and Dividends

S&P Dow Jones Indices

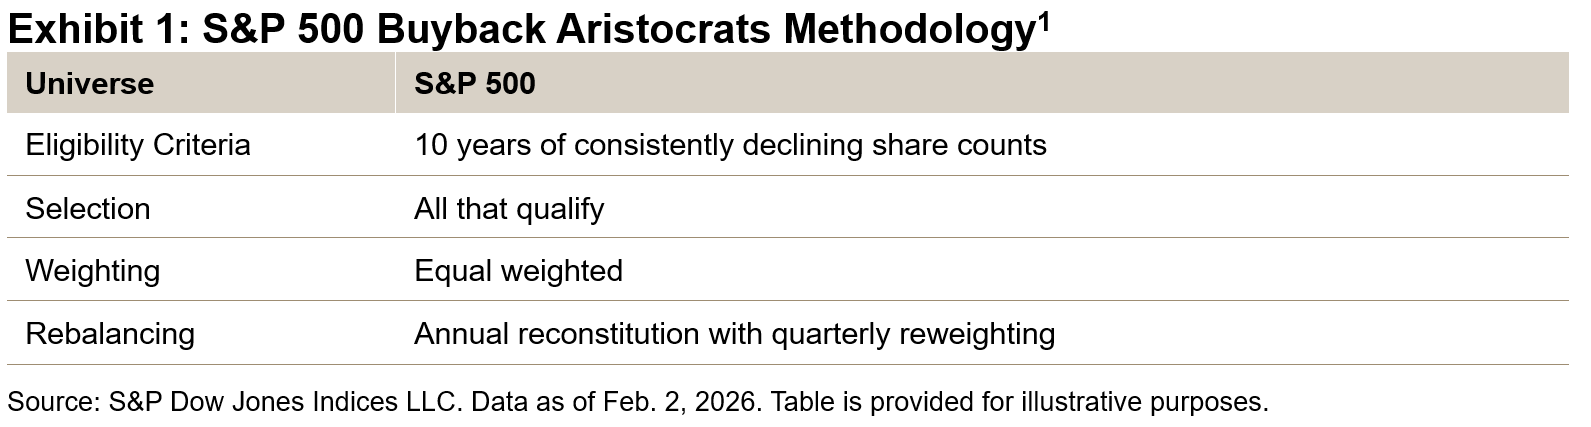
The latest addition to the S&P Aristocrats Index Series, the S&P 500® Buyback Aristocrats Index represents a new generation of buyback indices. This index tracks companies that have consistently reduced their common shares outstanding for at least 10 consecutive years—a rare achievement that signals disciplined capital management, financial strength and a steadfast commitment to shareholder interests.

Just as the S&P 500 Dividend Aristocrats® identifies companies with a proven history of growing dividend payments, the S&P 500 Buyback Aristocrats Index recognizes firms that demonstrate sustained dedication to share repurchases, with a particular emphasis on net share count reduction. This parallel underscores a core principle: quality is not defined by isolated actions, but by persistent behavior over time. By focusing on long-term buyback consistency, this index showcases companies focused on creating lasting value with a proven track record of enhancing shareholder returns.

A Differentiated Buyback Strategy

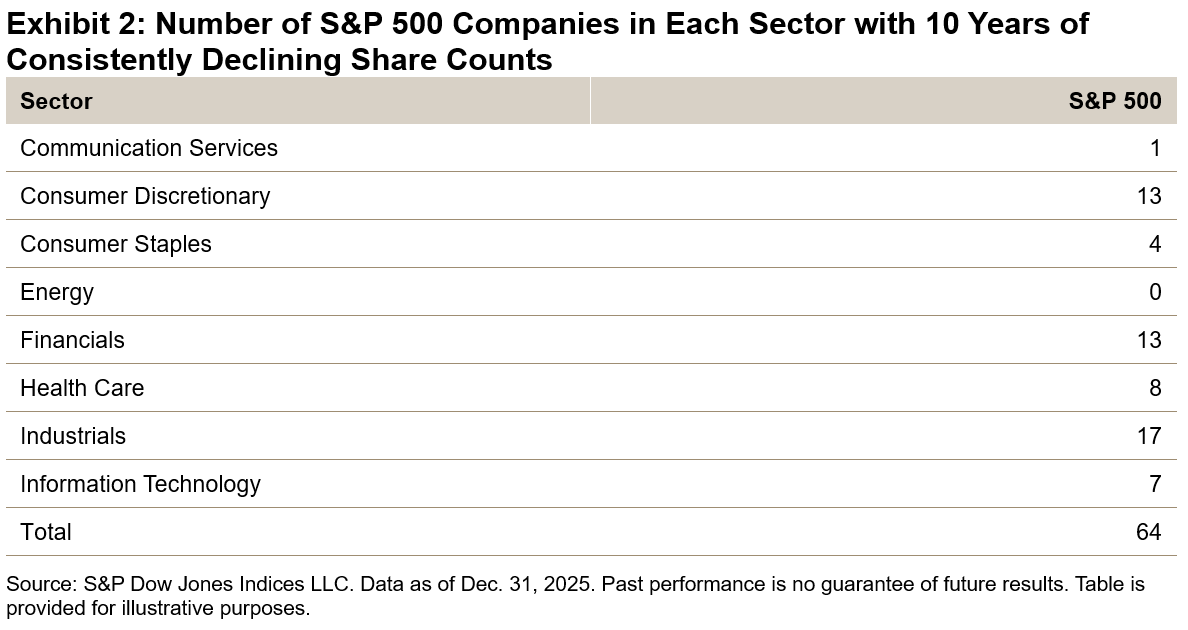
As of Dec. 31, 2025, the S&P 500 Buyback Aristocrats Index comprises 64 companies. Unlike traditional buyback strategies that rely on a single point-in-time assessment, this index emphasizes consistency across market cycles. This distinction is significant, as companies that regularly execute net buybacks tend to exhibit higher quality and more resilient earning power. Spreading buyback activity over multiple periods also helps address a common criticism of repurchases—that they are often poorly timed—thus resulting in a more balanced and reliable approach to capital return.

Long-Term Outperformance

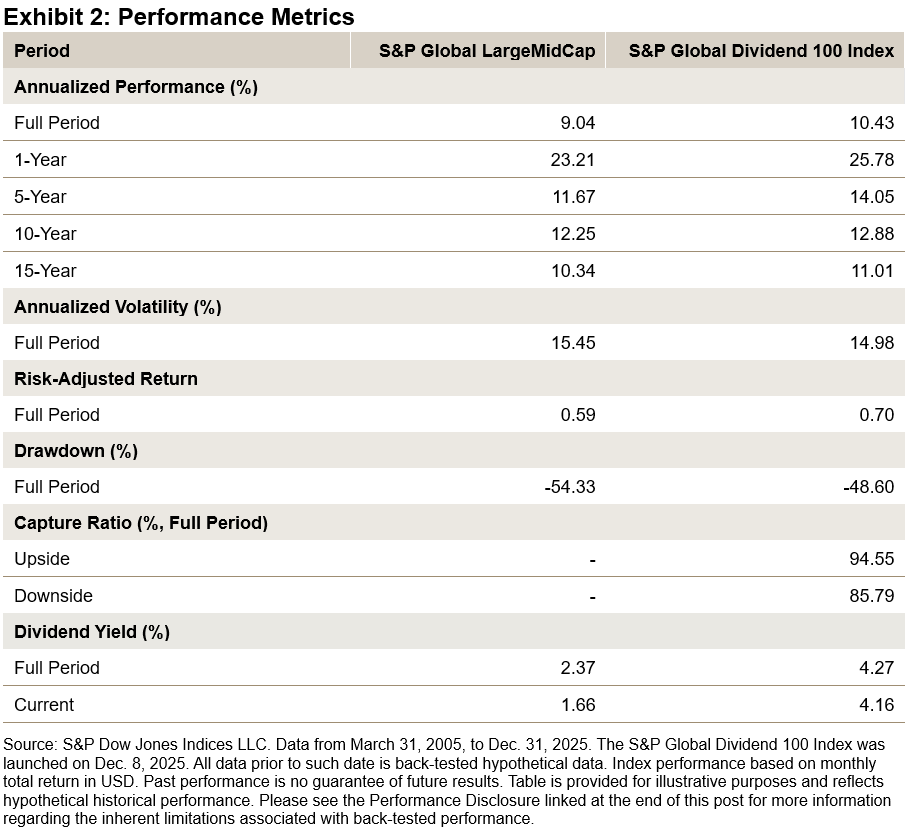
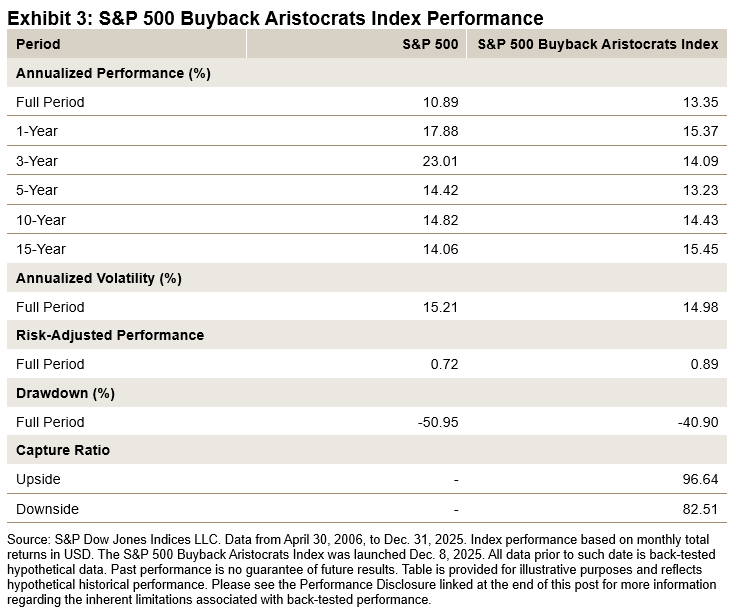
Back-tested data shows that the S&P 500 Buyback Aristocrats Index has outpaced the S&P 500 by 2.46% on an annualized basis since June 30, 2000. This long-term outperformance makes sense: as companies reduce their shares outstanding, each remaining share represents a larger claim on future earnings. Moreover, a sustained decrease in shares outstanding often signals a company’s ability to consistently generate strong cash flow and management’s ongoing commitment to returning capital to shareholders.

Defensiveness over the Business Cycle

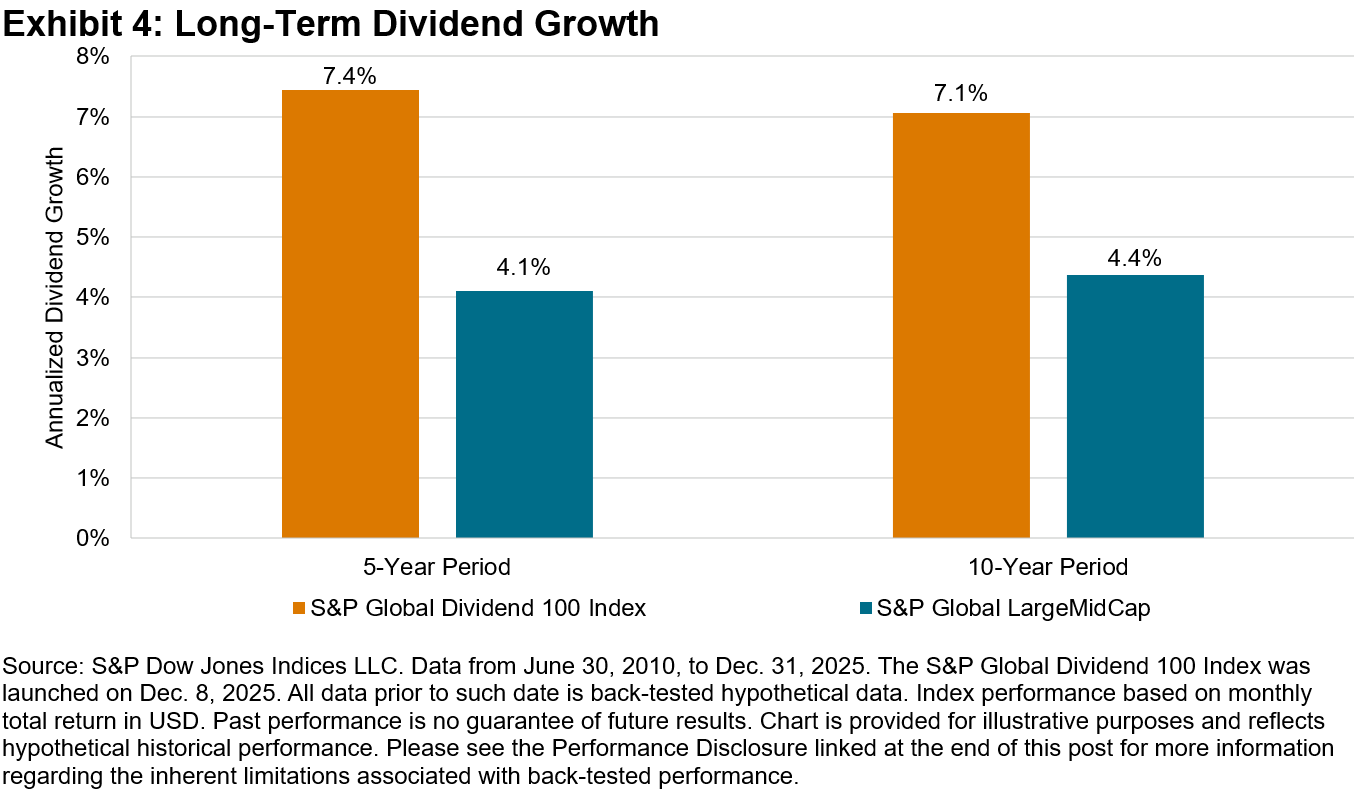
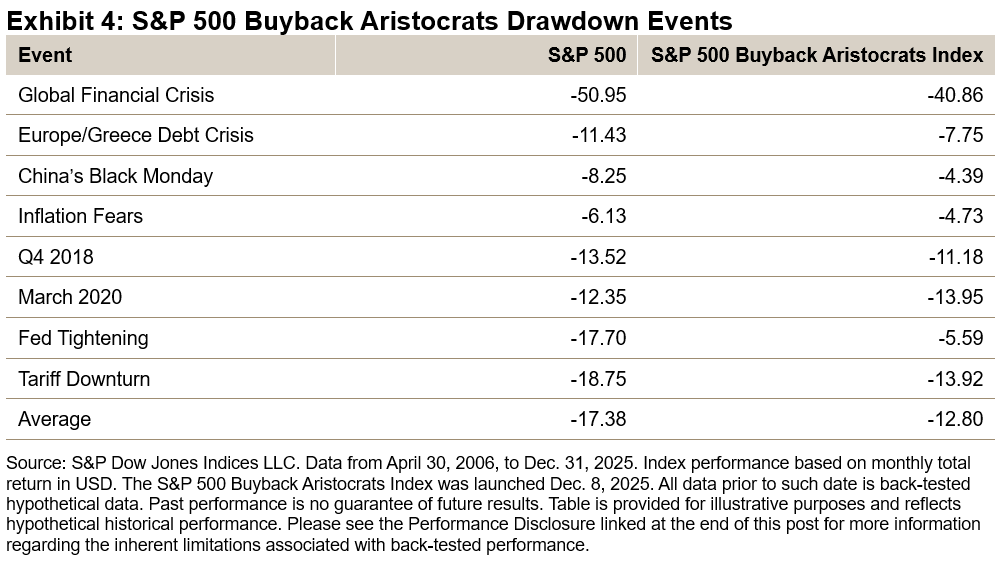
The defensive characteristics of the S&P 500 Buyback Aristocrats Index are particularly evident during periods of market stress. The index exhibited a lower downside capture than the S&P 500 and as shown in Exhibit 4, has demonstrated resilience during select drawdown events.

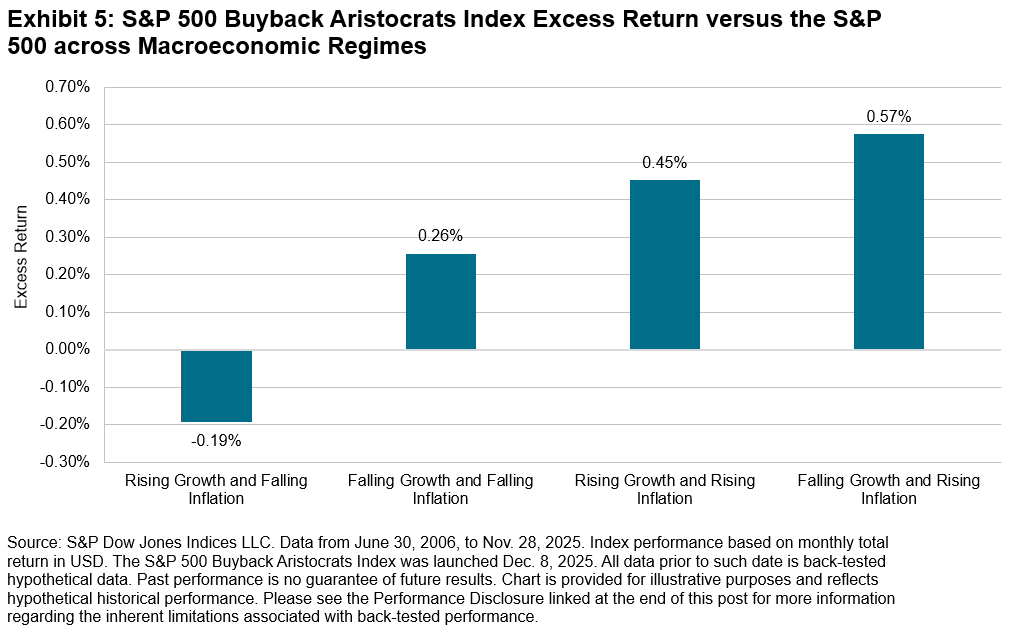
Like many factor-based strategies, performance relative to the benchmark may vary across macroeconomic regimes. Notably, across its back-tested history, the S&P 500 Buyback Aristocrats Index has outperformed during periods of rising inflation, as well as in environments characterized by slowing growth and declining inflation—conditions often associated with the later stages of the business cycle.

Conclusion

The S&P 500 Buyback Aristocrats Index stands out among buyback strategies by requiring constituents to demonstrate a reduction in shares outstanding for at least 10 consecutive years. This stringent requirement has historically driven outperformance and defensive qualities relative to its benchmark throughout its back-tested history.


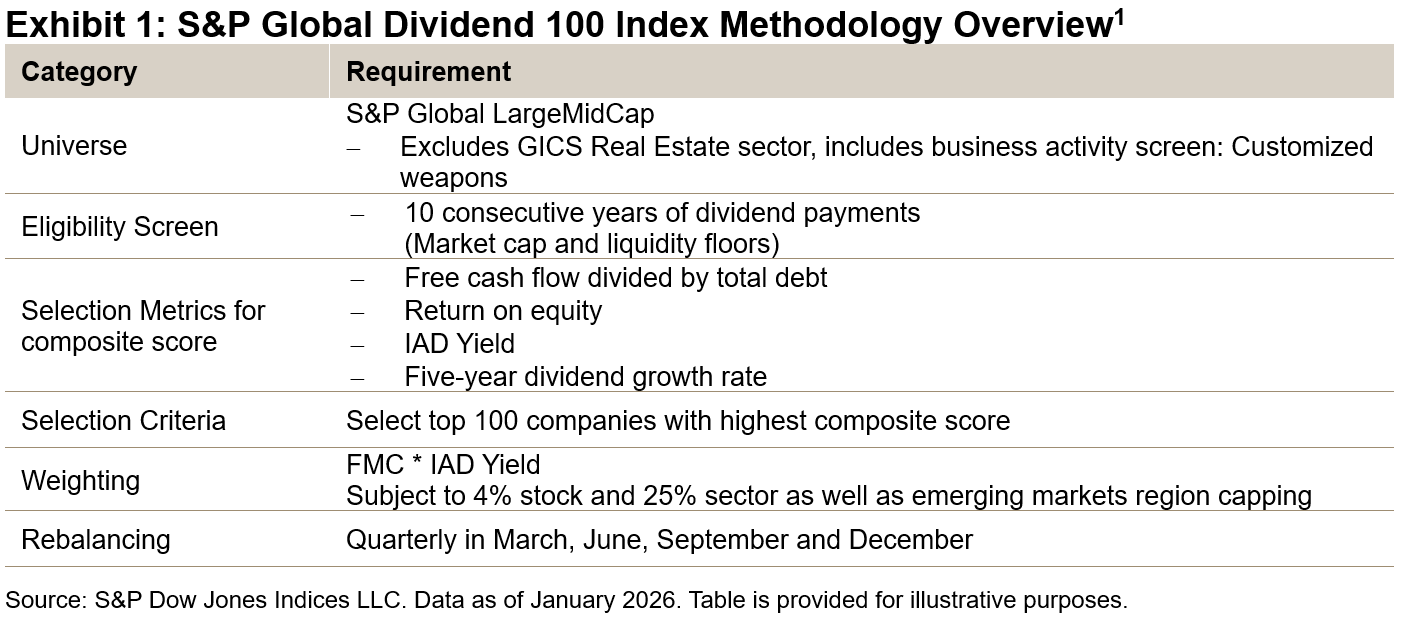
1 For the full methodology, please refer to the S&P 500 Buyback Aristocrats Index Methodology.


The posts on this blog are opinions, not advice. Please read our Disclaimers.

S&P 500 FC 7% Index: The Gold Standard of Indices Meet’s Today’s Technology

Look inside the S&P 500 FC 7% Index, an innovative index that seeks to provide optimized exposure to the S&P 500 via BofA’s Fast Convergence technology by using intraday volatility signals to adjust component allocations to systematically increase stability and limit exposure to large drawdowns.

The posts on this blog are opinions, not advice. Please read our Disclaimers.

Tech Tantrums

Contributor Image
Anu Ganti

Head of U.S. Index Investment Strategy

S&P Dow Jones Indices

The past week has been turbulent for Big Tech, with disappointing reactions to earnings from Microsoft, Amazon and Alphabet, while Apple and Meta emerged relatively unscathed after announcing their results. Concerns about growing capital expenditures on AI1 among these giants have led to renewed bubble fears among market participants.

In an environment characterized by such jitters, we would expect performance among mega caps to suffer, and it indeed has, with the S&P 500® Top 10 Index down 5% relative to the S&P 500 YTD as of Feb. 6, 2026. What is more surprising though is that the realized volatility of the top 10 index, while still higher than The 500®, has declined in relative terms.

Volatility manifests itself in both dispersion and correlation, each of which we explore in Exhibit 2 for the S&P 500 Top 10 Index to offer some perspective. Although the dispersion of the top 10 index has risen so far this year, correlations have declined steadily, which has helped dampen the realized index volatility of the mega caps. This is in contrast to early April 2025, when correlations spiked to 0.8, while dispersion remained relatively low, as Tech titans were buffeted across the board by trade-related tensions.

Looking under the hood specifically at those mega-cap companies belonging to the famous Magnificent 7 moniker, which span across the Information Technology, Communication Services and Consumer Discretionary sectors, can help further disentangle these volatility dynamics. Exhibit 3 illustrates that performance among the group has diverged over the last year, leading to a 75% cumulative performance differential between outperforming Alphabet and underperforming Amazon since Dec. 31, 2024. Only Alphabet and NVIDIA managed to outperform The 500 during this time period.

Only two companies continued to beat the benchmark in January, but the composition of outperformers has shifted to include Alphabet and now Apple, while Amazon and especially Microsoft have been punished, with more than USD 800 billion in market cap erased in the past month from these two companies. These trends are consistent with the rise in dispersion and decline in correlations witnessed in Exhibit 2.

As the market looks ahead to NVIDIA earnings later this month, concerns over Big Tech spending do not appear to be abating. We observe in Exhibit 4 that the implied volatility of the Tech sector is higher relative to The 500 and has been rising. Meanwhile, the implied volatility of The 500 excluding Technology relative to the benchmark has declined sharply. Understanding Tech’s recent tantrums from a volatility lens might help investors navigate these uncertain times.

1 Big Tech’s ‘breathtaking’ $660bn spending spree reignites AI bubble fears – Financial Times

The posts on this blog are opinions, not advice. Please read our Disclaimers.

The Dow Hits 50,000!

Contributor Image
Hamish Preston

Head of U.S. Equities

S&P Dow Jones Indices

The Dow Jones Industrial Average® (DJIA) just closed above 50,000 for the first time in its near 130-year history. The Dow®’s latest milestone marks the third time this decade that the U.S. equity barometer first surpassed a 10,000 increment and—unsurprisingly, perhaps, given successive milestones require smaller gains to be achieved—the latest milestone came in record time, less than two years after it first closed above 40,000 (see Exhibit 1).

Although skeptics may question the significance, psychological or otherwise, of market barometers hitting arbitrary thresholds, The Dow’s latest milestone provides an opportunity to reflect on the index’s storied history.

Born out of Charles Dow’s hunch at the end of the 19th century that industrial companies would be crucial contributors to U.S. economic growth, the DJIA has provided market participants with a way to measure the U.S. equity market for close to 130 years. The length of live index history is extremely valuable: one does not need to wonder how the U.S. equity market might have performed under simplifying assumptions typically associated with index back-tests. Nor does one have to consider the validity of those assumptions, the motives behind the choices, and their impact on hypothetical historical index performance. Instead, The Dow shows how the market did react to different environments, thereby helping market participants to contextualize U.S. equity market movements (see Exhibit 2).

In recent decades, the index has come to serve as the underlying for various index-linked products around the world, with an estimated USD 115 billion indexed or benchmarked to The Dow at the end of 2024. The Dow also has a robust trading ecosystem, promoting price transparency and market efficiency, with more than USD 8 trillion in index equivalent trading volume (IET) in products linked to the index in 2024.

A key reason that The Dow has continued to resonate around the world is that the index has evolved to reflect key trends in the U.S. equity market. For example, various manufacturers were added in the 20th century to reflect the prominence of these companies in the U.S. equity market at the time, while more recent constituent changes—including the latest updates—ensured the DJIA reflected the growing importance of other segments. Overall, the DJIA has seen 136 constituent changes since May 1896.

Exhibit 3 shows the impact of these changes on the average tenure of The Dow’s constituents. The Dow’s expansion from 12 stocks to 20 stocks in 1916, and its further expansion to the now familiar 30-stock count in 1928, contributed to notable declines in the average tenure in the first few decades. A prolonged period of relatively few constituent changes then saw the average tenure reach 48 years in the mid-1980s, before declining in recent decades; the average tenure was around 25 years at the end of January 2026.

Exhibit 4 illustrates the fact that The Dow’s constituent changes helped it to reflect recent U.S. equity market dynamics. In particular, Exhibit 4 shows the contribution of existing index constituents to The Dow between May 17, 2024, when the index first closed above 40,000, and yesterday’s close. Companies added in the past 30 years contributed around half of the gains from existing constituents.

As a result, the Dow Jones Industrial Average is one of the preeminent U.S. equity barometers, with close to 130 years of live history. However, the index is not your great-great-great grandparents’ Dow: the index has evolved and the latest milestone shows that it continues to reflect trends in the U.S. equity markets.

The posts on this blog are opinions, not advice. Please read our Disclaimers.

S&P Global Dividend 100 Index: Where High Yield Meets Quality

Contributor Image
Elizabeth Bebb

Director, Factor & Dividend Indices

S&P Dow Jones Indices

When selecting a high yield dividend strategy, headline yield matters—but so does the strength of the companies delivering it. The ability to sustain and grow dividends over time often depends on underlying business quality. Companies with strong profitability and resilient cash flows are typically better positioned to increase payouts and support long-term price performance.

To focus on this balance, the S&P Global Dividend 100 Index selects companies using a composite score that blends two dividend metrics with two measures of quality.

Methodology Overview

The methodology begins with the S&P Global LargeMidCap as the index universe, first screening to retain companies that have paid dividends for at least 10 consecutive years, then removing those with a below-median dividend yield. From the remaining subset, the top 100 companies are selected based on a composite score combining dividend yield, dividend growth, return on equity (ROE) and the ratio of free cash flow (FCF) to total debt.

Selected constituents are weighted by float market cap (FMC) times dividend yield, helping balance liquidity with enhanced income. To help reduce concentration risk and support diversification, individual stocks are capped at 4% and sector weights are limited to 25%.

Back-Tested Performance Overview

The S&P Global Dividend 100 Index has outperformed the benchmark over the long- and short-term back-tested period, with higher risk-adjusted returns and significantly higher long-term dividend yields. The defensiveness of the dividend index can be seen in the lower drawdown and downside capture, while still participating strongly in rising markets.

Dividend Yield

As of Dec. 31, 2025, the historical average long-term dividend yield for the S&P Global Dividend 100 Index was 4.27% versus 2.37% for the benchmark, a difference of 190 bps. Interestingly, the differential between the two current dividend yields was 250 bps as of Dec. 31, 2025, with the S&P Global Dividend 100 Index anticipating a dividend yield of 4.16%.

Dividend Growth

Growing dividends can help preserve purchasing power during periods of elevated inflation. During the back-tested period, the S&P Global Dividend 100 Index showed dividend growth of over 7% across both the 5- and 10-year periods (see Exhibit 5), compared with approximately 4% for the broader benchmark. This stronger growth profile suggests that income levels may have been more resilient during the higher inflation experienced in 2022 and 2023. These outcomes reflect the index’s methodology, which incorporates both dividend growth and quality fundamentals within the composite scoring framework.

Country/Region Breakdown Insights

As of Dec. 31, 2025, the S&P Global Dividend 100 Index displayed a more balanced regional mix relative to the benchmark. Europe and the Asia‑Pacific region each accounted for roughly 27 % of the index, while the U.S. and North America represented about 41.8 %—approximately a 20 % underweight versus the benchmark.

Sector Breakdown Insights

Exhibit 7 illustrates that the S&P Global Dividend 100 Index had the largest sector overweights in Energy and Financials as of Dec. 31, 2025. While still underweight in the Information Technology sector overall, the S&P Global Dividend 100 Index had a much higher weight in this sector than its global dividend index peers. This is due to the quality metric within the selection scoring, which screens for higher quality companies with dividend prospects within the sector.

Conclusion

The long-term back-tested performance of the S&P Global Dividend 100 Index highlights that the rules-based methodology prioritizes high dividend yield, consistent dividend growth and strong fundamentals. The index has historically shown relatively high risk-adjusted returns versus the benchmark, robust dividends and defensive qualities. By anchoring the selection of high yield stocks in the fundamental strength of companies, the index has also demonstrated robust dividend growth, which could help to preserve purchasing power.

1 For the full methodology, please refer to the Dow Jones Dividend Indices Methodology.

The posts on this blog are opinions, not advice. Please read our Disclaimers.