Get Indexology® Blog updates via email.

In This List

How AI Is Transforming Index Construction: Introducing the S&P 3AI Indices

Exploring an Index-Based Path to Leveraged Loans

Quality over Quantity: Features of the S&P 500 Quality Index

Stocks, Sectors and Success?

The Momentum Factor: Continuing to Thrive beyond U.S. Borders

How AI Is Transforming Index Construction: Introducing the S&P 3AI Indices

Contributor Image
Rupert Watts

Head of Factors and Dividends

S&P Dow Jones Indices

The recent advent of artificial intelligence (AI) is transforming daily life from streamlining routine tasks to augmenting productivity and facilitating data-driven decisions. Within indexing, it is a natural progression to explore how these technologies can enhance index construction within a human-validated and governed framework. Integrating machine learning, a subset of AI, systematically enables the analysis of vast datasets, the identification of complex relationships and the generation of forward-looking insights. Applied in this way, AI offers an adaptive evolution of traditional factor investing, further reshaping the alpha-beta continuum.

In this blog, we will introduce the S&P 3AI Indices by reviewing the methodology, performance and positioning of this new index series.

3AI and the 3AI Alpha Scores

3AI is a London-based quantitative research technology firm specializing in machine learning and stock alpha forecasting. Founded in 2018, 3AI develops machine-learning-driven forecasting systems deployed in live investment and research environments.

Alpha forecasts are produced through a fully systematic process governed by strict temporal and methodological constraints, with human oversight focused on model validation, risk controls and research governance. The output of this process is the 3AI Alpha Score, representing a 12-month expected excess return forecast.

These 3AI Alpha Scores are produced through a network of interconnected AI systems operating across bottom-up and top-down dimensions, drawing on more than 300 structured data inputs. Bottom-up models analyze company-level fundamentals, factors, analyst expectations, market behavior and technical indicators, while top-down models reflect sectoral and business-cycle effects. S&P Dow Jones Indices has collaborated with 3AI to incorporate these 3AI Alpha Scores into its indices.
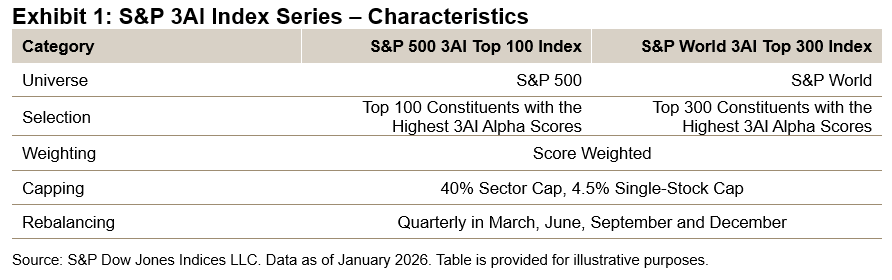
Methodology

Two of the first indices launched using these scores are the S&P 500® 3AI Top 100 Index and S&P World 3AI Top 300 Index. Each index selects the highest-scoring companies in its universe, hence tracking those with the strongest 12-month alpha forecasts. Constituents are weighted proportionally to their 3AI Alpha Scores, and the indices are rebalanced quarterly. See the index methodology for more details.

Performance Characteristics

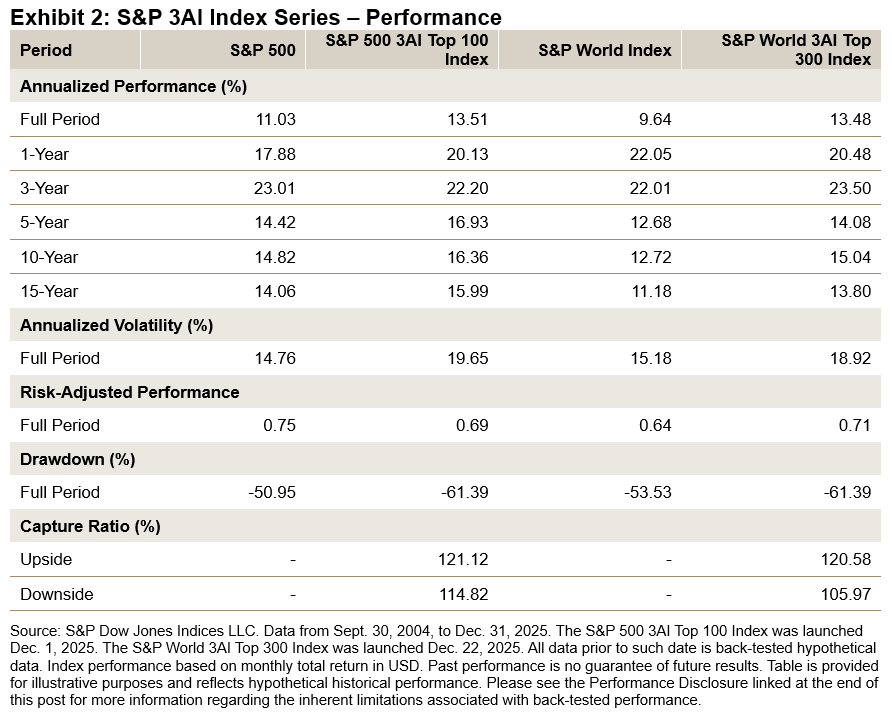
Since the index was launched in late 2025, any performance data prior to that date is considered back-tested. It is important to note that the development of a machine-learning forecasting process involves three distinct phases: model training, out-of-sample testing and, lastly, live implementation. During model training, only point-in-time data is utilized, ensuring that observed alpha is genuinely out-of-sample or live and is not influenced by the realized performance of the index or any related strategy. Once live, the model benefits from an expanding data and learning window.

Over the back-tested period studied from Sept. 30, 2004, to Dec. 31, 2025, the S&P 500 3AI Top 100 Index achieved approximately 2.5% annualized outperformance versus the S&P 500, while the S&P World 3AI Top 300 Index outperformed the S&P World Index by about 3.8% annualized.
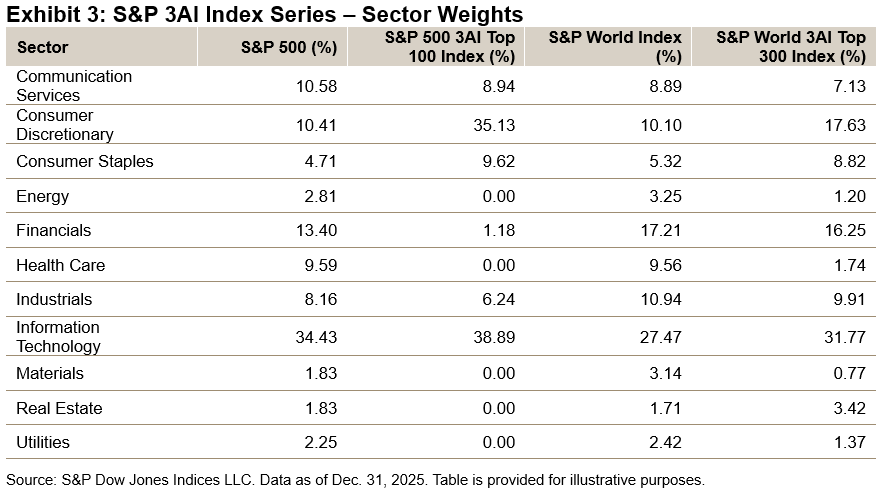
Sector Weights

As of Dec. 31, 2025, both indices exhibited notable overweights in Consumer Discretionary—approximately 25% above the benchmark for the S&P 500 3AI Top 100 Index—and in Consumer Staples, which was nearly double its benchmark weight. For both indices, Information Technology also showed an overweight relative to their benchmarks. In Financials, the S&P 500 3AI Top 100 Index was materially underweight, but the S&P World 3AI Top 300 Index was broadly in-line with its benchmark. This highlights a two-sided dynamic within the sector: U.S. Financials were de-emphasized, while Financials companies from other developed markets were overweighted. Health Care had a significant underweight in both indices, having been largely excluded.

Conclusion

The S&P 3AI Indices represent our first AI-enhanced indices that use predictive modeling to drive stock selection. While the underlying scores are derived from machine-learning models, the indices bring the benefits of transparency and robust human-led governance. We are excited to introduce these innovative benchmarks and are exploring the expansion of this series of indices. Stay tuned for further analysis and publications that will provide additional information on the machine-learning processes and offer detailed attribution of historical index performance.


The use of “3AI” in the name of the S&P 3AI indices is a reference to the machine learning technology firm, 3AI, which provides the 3AI Alpha Intelligence scores that are used by S&P Dow Jones Indices in the construction of these indices. These scores represent 12-month excess return forecasts, generated through the application of machine learning techniques across global equities, by analyzing company data and business-cycle sensitivities.

The Content may have been created with the assistance of an artificial intelligence (AI) tool. While the AI tool may provide suggestions and insights, the final Content was composed, reviewed, edited, and approved by a human(s) at S&P Dow Jones Indices. As such, S&P DJI claims full copyright ownership of this AI-assisted Content, in accordance with applicable laws and regulations.

The posts on this blog are opinions, not advice. Please read our Disclaimers.

Exploring an Index-Based Path to Leveraged Loans

What’s the role of indices in the fast-growing leveraged loans market? S&P DJI’s Frans Scheepers and State Street Investment Management’s Marcel Benjamin explore how indexing works for leveraged loans and take a closer look at the S&P USD Select Leveraged Loan Index. 

The posts on this blog are opinions, not advice. Please read our Disclaimers.

Quality over Quantity: Features of the S&P 500 Quality Index

Contributor Image
Wenli Bill Hao

Director, Factors and Dividends Indices, Product Management and Development

S&P Dow Jones Indices

Beyond being a familiar adage, “quality over quantity” lies at the heart of quality-based investing. Rather than concentrating on the largest stocks, quality indices systematically tilt toward companies with strong profitability, high earnings quality and robust balance sheets. Over the long term, the S&P 500® Quality Index has delivered impressive absolute and risk-adjusted returns as a result of tracking fundamentally sound businesses. In 2026, the index is off to a good start, outperforming the S&P 500 by 1.68% as of Jan. 30, 2026.

In this blog, we’ll explore the key selection metrics behind the S&P 500 Quality Index, review its long-term and YTD performance, and analyze its current constituent makeup.

Methodology Overview

The S&P 500 Quality Index uses three key metrics: return on equity (ROE), balance sheet accruals ratio (BSA) and financial leverage ratio (FLR). These metrics are combined into an overall quality score, which is used to select the top 100 stocks within the S&P 500. Selected constituents are then weighted based on the product of their market capitalization and quality scores.1

Long-Term Outperformance

Over the long term, including back-tested results, the S&P 500 Quality Index has delivered robust performance, outperforming The 500® by an annualized 256 bps (13.71% vs. 11.15% annualized return) since Dec. 16, 1994, while also exhibiting 87 bps lower risk (17.97% vs. 18.84% annualized volatility).

In contrast, the S&P 500 Quality – Lowest Quintile Index—representing the lowest quality quintile—has underperformed the S&P 500 by an annualized 180 bps over the same period (9.35% vs. 11.15% annualized return), while exhibiting a materially higher risk of 320 bps (22.04% vs. 18.84% annualized volatility). Together, these results highlight the pronounced performance divergence between high- and low-quality stocks (see Exhibit 2).

Outperformance YTD in 2026

Resilient U.S. economic growth and lower U.S. Federal Reserve rates have bolstered corporate earnings across a broad range of companies, extending well beyond the “Magnificent 7.” This environment has encouraged wider market participation and supported the S&P 500 Quality Index’s YTD outperformance.

Sector Weights

Currently, the S&P 500 Quality Index underweights the Communication Services and Information Technology sectors, while overweighting Industrials and Consumer Staples sectors, relative to The 500 (see Exhibit 4).

Reduced Weight in the Magnificent 7

The current AI hyperscaler buildout marks one of the largest capital investment cycles in modern equity markets. Although these investments may fuel long-term growth, they have rapidly expanded companies’ non-cash assets2, 3 (see Exhibit 5), which in turn has affected quality metrics such as balance sheet accruals and leverage. Consequently, the Magnificent 7 account for only 4.9 % of the S&P 500 Quality Index as of Dec. 31, 2025.

Conclusion

The S&P 500 Quality Index has demonstrated resilient characteristics over the long term. By systematically selecting companies based on strong profitability, superior earnings quality and robust financial health, it has historically outperformed in absolute and risk-adjusted terms. In today’s market, its disciplined methodology may help navigate concentration risk, offering a distinct lens from traditional market-cap-weighted approaches.

1 Please refer to S&P Quality Indices Methodology for more details.

2 Non-cash assets include net PPE, short-term receivables, total long-term investments and inventories

3 For Microsoft, the current fiscal year (CFY) shown ended in June 2025; for Alphabet, Meta and Amazon, the CFY ended in December 2024; for Nvidia, the CFY ended in January 2025.

The posts on this blog are opinions, not advice. Please read our Disclaimers.

Stocks, Sectors and Success?

Contributor Image
Liam Flaherty

Senior Analyst, Index Investment Strategy

S&P Dow Jones Indices

The recent market rotation toward small caps and value has also extended toward sectors,1 with Technology, which was one of the top-performing sectors of 2025, turning from a leader into a laggard in January. Meanwhile, cyclical sectors including Energy and Materials have outperformed.

But how challenging have the conditions been for sector allocators? Exhibit 1 shows that only three S&P Select Sector Indices2 outperformed The 500® last year, but that that number has broadened considerably since then, with seven sectors outperforming the benchmark in January.

Stock-pickers faced a similarly tough environment last year, as just 30% of stocks outperformed the S&P 500®.3 A natural question is the degree to which sector trends dictated the success of within-sector stock selection. Exhibit 2 shows that 50% of S&P 500 Consumer Discretionary and 47% of S&P 500 Energy stocks outperformed their respective sector benchmarks, compared to only 22% of S&P 500 Real Estate stocks. More recently, 51% of stocks outperformed their respective sector benchmarks in January, higher than the 36% average seen last year.

To analyze the tradeoffs of sector versus stock selection, we turn to dispersion, a measure of cross-sectional volatility and an indicator of opportunities for stock and sector selection. Specifically, we analyze the contribution of cross-sector effects to total market dispersion.4 The long-term average of 0.22 means that, on average, 22% of the market’s total dispersion was attributable to cross-sector effects. Exhibit 3 shows that the contribution of sectors to S&P 500 dispersion was above average for parts of 2025, particularly during the first half of the year, when tariff-related tensions meant greater rewards for choosing sectors that would succeed during the shifting global political landscape. The importance of sector selection also rose during November, when the impact of resurging fears of an AI bubble varied across sectors.

In addition to dispersion, correlations—particularly cross-sector correlations—can be a useful proxy for assessing the risk environment for sector allocation. Exhibit 4 shows that managers may have had ample opportunities for diversification as they navigated last year’s shifting volatility regime.5 Almost half of the correlations between daily select sector excess returns were between -0.3 and 0.3. Unsurprisingly, Technology, the largest and top-performing Select Sector, had a consistently negative correlation with all 10 other Select Sectors, which has continued in January.

With a potential market shift underway, understanding the nuances of sectors from a risk/return vantage point may prove useful when navigating geopolitical, economic and tariff-related uncertainties through the rest of 2026.

1 Fox, Rachel. “How to Spot—and Capitalize on—a Sector Rotation.” The Wall Street Journal. Jan. 4, 2026.

2 For information on the differences between S&P 500 Select Sectors and S&P 500 Sectors, see the S&P U.S. Indices Methodology

3 Ganti, Anu. “2026 Is the Year of the Stock Picker?” S&P Dow Jones Indices LLC. Dec. 16, 2025.

4 Edwards, Tim and Lazzara, Craig J. “Dispersion: Measuring Market Opportunity.” S&P Dow Jones Indices LLC. December 2013.

5 Further information can be found in our Dispersion, Volatility & Correlation dashboard.

The posts on this blog are opinions, not advice. Please read our Disclaimers.

The Momentum Factor: Continuing to Thrive beyond U.S. Borders

Contributor Image
George Valantasis

Director, Factors and Dividends

S&P Dow Jones Indices

Last August, we published a blog highlighting the impressive H1 2025 performance of the S&P World Ex-U.S. Momentum Index compared to both its benchmark universe and the S&P 500®. This strong momentum persisted through the remainder of 2025, with the S&P World Ex-U.S. Momentum Index closing the year with an impressive 43.22% gain (see Exhibit 1).

For international market participants, this development may seem long awaited, as the S&P World Ex-U.S. Index outperformed The 500® by 14.68%—its largest margin in more than 30 years, surpassing every other year since 1993’s 20.51% outperformance. Furthermore, the S&P World Ex-U.S. Momentum Index delivered a 25.44% outperformance over The 500, marking its strongest result since 1998, when it achieved an outperformance of 27.66%.

In addition to updated performance figures, this blog will present sector and geographic weights as of Dec. 31, 2025, along with a brief overview of the index methodology.

Index Methodology

Exhibit 2 provides a refresher on the index methodology. In short, the index selects constituents from developed markets (excluding the U.S. and South Korea) based on 12-month risk-adjusted price momentum, omitting the most recent period to reduce short-term reversal effects.

Performance Comparison

The S&P World Ex-U.S. Momentum Index consistently outperformed its benchmark across every back-tested period since Dec. 31, 1994, while also showing higher risk-adjusted returns and downside capture relative to the S&P World Ex-U.S. Index (see Exhibit 3).

Exhibit 4 highlights the S&P World Ex-U.S. Momentum Index’s strong and consistent outperformance, surpassing its benchmark universe in over 62% of rolling three-year periods, with a maximum outperformance of 110% and a minimum underperformance of just 17%.

Sector Weight Analysis

As of Dec. 31, 2025, the S&P World Ex-U.S. Momentum Index continued to show a significant overweight in the Financials sector, resulting in slight underweights across most other sectors (see Exhibit 5). As illustrated in Exhibit 6, the sector weights are highly dynamic and tend to shift rapidly in response to changes in the momentum signal, rather than exhibiting a consistent bias toward specific sectors.

Region Weight Analysis

As of Dec. 31, 2025, the S&P World Ex-U.S. Momentum Index maintained a significant underweight position in Japan. The Canadian market currently holds both the largest overweight at 7.2% and the highest absolute weight at 18.9% within the S&P World Ex-U.S. Momentum Index. Much like the full-period sector comparison, the index generally does not display consistent biases toward specific countries over the long term.

Conclusion

The S&P World Ex-U.S. Index’s strongest outperformance versus the S&P 500 in over three decades was likely welcome news for international market participants. Against this backdrop, the S&P World Ex-U.S. Momentum Index delivered a remarkable performance of 43.32% 2025—its strongest calendar year performance since 1999. The S&P World Ex-U.S. Momentum Index’s 2025 results highlight the recent strength of the momentum factor across developed markets internationally.

The posts on this blog are opinions, not advice. Please read our Disclaimers.