Get Indexology® Blog updates via email.

In This List

Your S&P Select Industry Indices 2025 Wrapped

Index-Based Investing in Islamic Finance: 2025 Review

The S&P Israel 30 LargeCap Index: Uncovering the Performance of Israel’s Large Caps

A Fundamental Approach to Weighting Stocks: The S&P 500 Revenue-Weighted Index

Cautioning the Clairvoyant

Your S&P Select Industry Indices 2025 Wrapped

Contributor Image
Sara Pineros

Quantitative Analyst, Index Investment Strategy

S&P Dow Jones Indices

Looking back at 2025, some key themes emerged and drove many market conversations. Many different themes—including the rise of artificial intelligence (AI), tariffs, risk of inflation and a focus on defense—set against a backdrop of broader macroeconomic, geopolitical and technological changes created a period of increased market uncertainty across industries. Volatility, as measured by VIX®, remained high for most of the year,1 reflecting ongoing investor concern. The S&P 500® experienced notable swings in 2025, approaching bear-market levels in April amid concerns over tariffs before rallying to record highs by June as enthusiasm for AI fueled the market.

But volatility was not the entire story. High readings for both VIX and the Cboe S&P 500 Dispersion Index (DSPX) emphasized that broad macroeconomic trends influenced market direction in 2025 and resulted in a wide variation in performance across industries.

So, who were the leaders and laggards across the U.S. equity landscape in 2025? In a year when headlines focused on big themes, the S&P Select Industry Indices offered a valuable way to look beyond the broad market and highlight the key factors driving this year’s most significant moves, as shown in Exhibit 1.

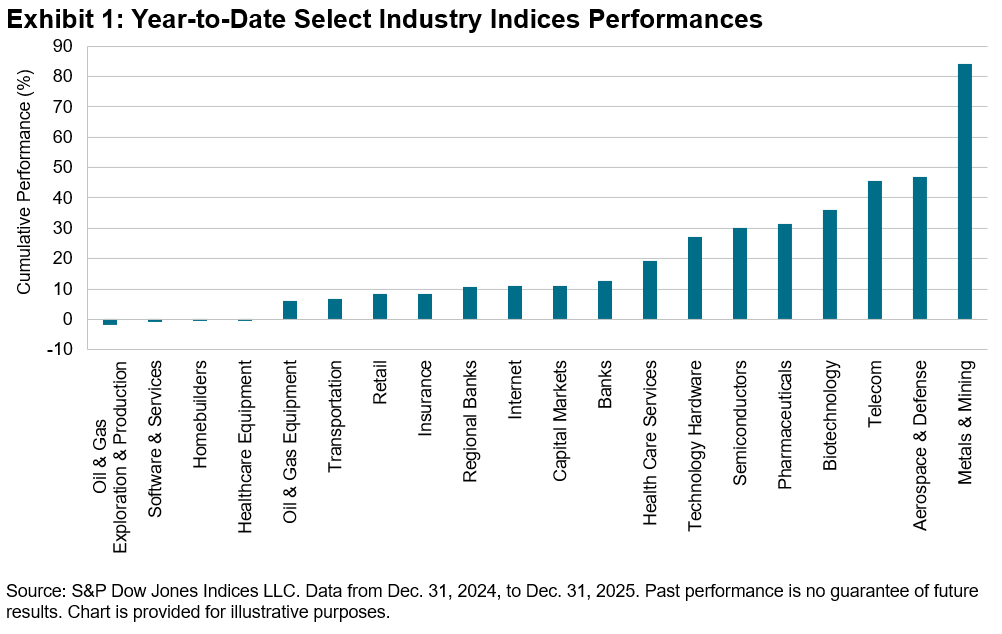
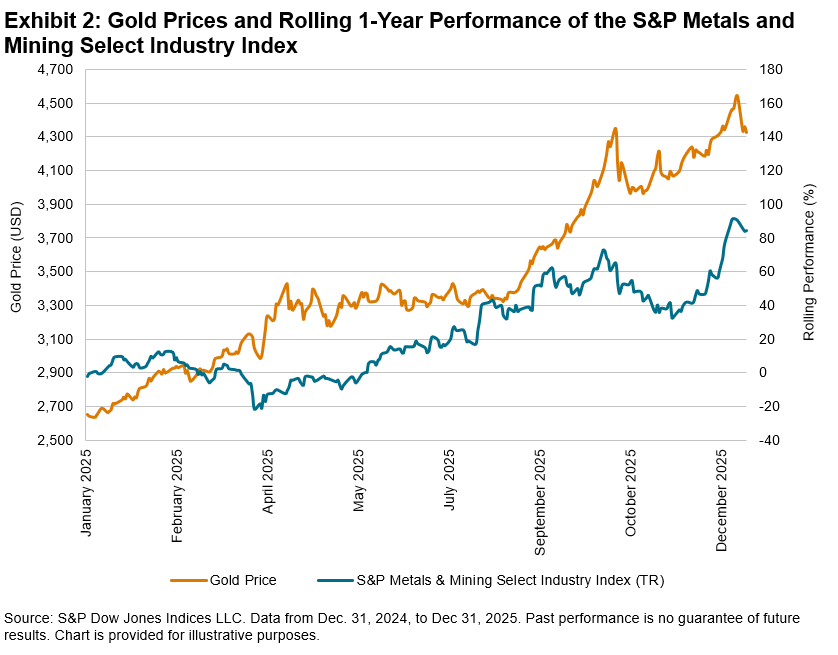
To start, the Metals & Mining industry had a golden year, experiencing an 84.2% increase in 2025. Rare earth elements drive the modern world, with technological advancements boosting demand across various sectors, from AI to defense. Amid rising geopolitical tensions, the U.S. government took measures to bolster domestic supply chains for strategic metals, further supporting the industry’s strong performance. To top it off, gold prices hit record highs in October, as shown in Exhibit 2, fueled by safe-haven demand amid ongoing geopolitical concerns, economic uncertainty and a weaker U.S. dollar.

Aerospace & Defense ranked as the second-highest growth sector among the S&P Select Industries, posting a significant 46.8% increase, largely driven by rising geopolitical tensions worldwide.

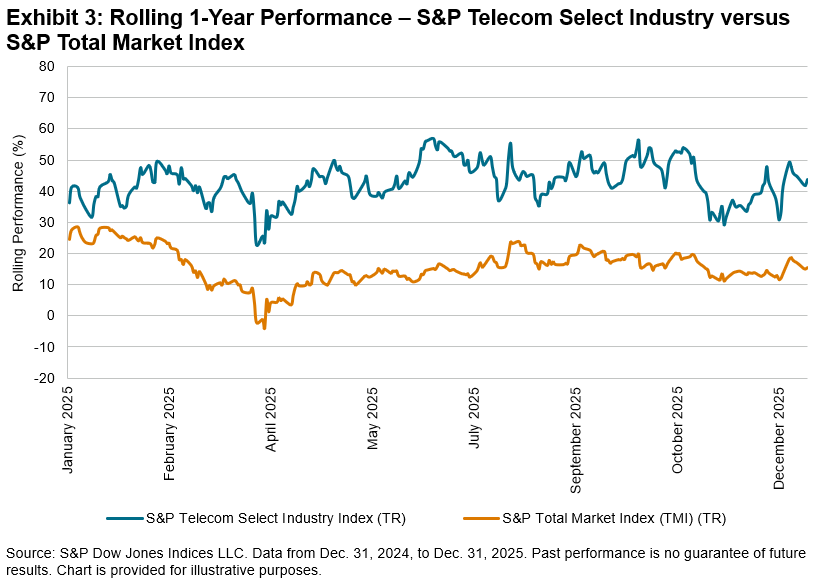
AI-related industries, including Semiconductors and Technology Hardware, also ranked among the top performers in 2025, increasing by 30.1% and 27.3%, respectively. Telecom, another industry closely tied to AI, also delivered strong results, with a 45.5% gain, outperforming the S&P Total Market Index as shown in Exhibit 3.

This standout performance in Telecom was fueled by strategic mergers, ongoing technological advancements and increasing demand for digital infrastructure.2 Defense-linked telecom companies contributed significantly as well. Ondas Holdings, for example, achieved an extraordinary YTD total increase of 1,022.0%,3 based on market optimism about its military and security technologies.

While some industries thrived, others that were more influenced by macroeconomic and political shifts and less influenced by technological trends faced significant challenges. Industries sensitive to tariffs, such as Homebuilders and Healthcare Equipment, struggled, as illustrated in Exhibit 4.

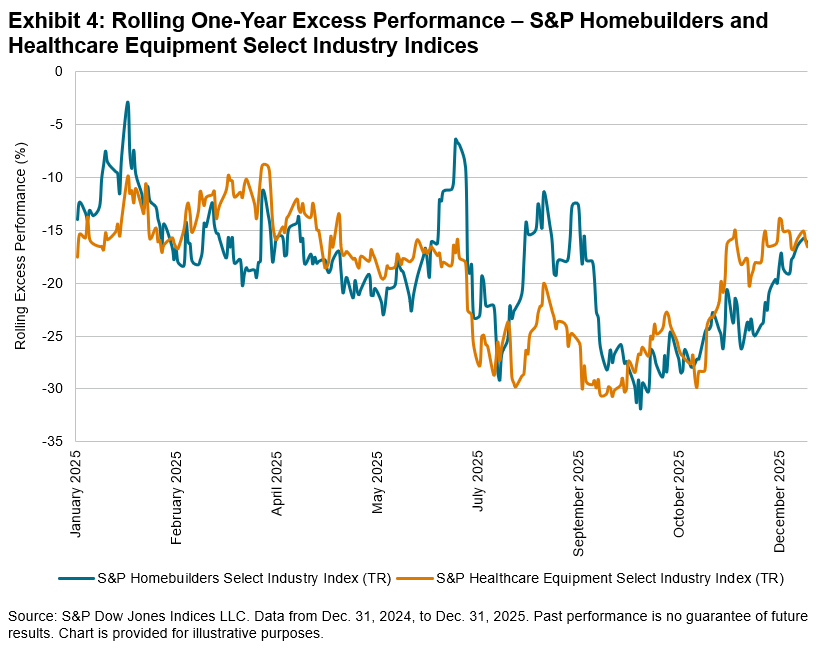
Homebuilders faced a difficult 2025, dropping 0.4% YTD. The industry struggled with declining new home sales, primarily due to affordability issues, higher construction material costs and persistently high interest rates. Looking ahead, tariffs on steel and aluminum are expected to further slow the construction market, possibly leading to more project delays and cancellations into 2026.4

Healthcare Equipment faced similar headwinds, dropping 0.3% YTD. Tariffs on medical devices and products weighed on suppliers, distributors and hospitals, further dampening overall industry sentiment.5

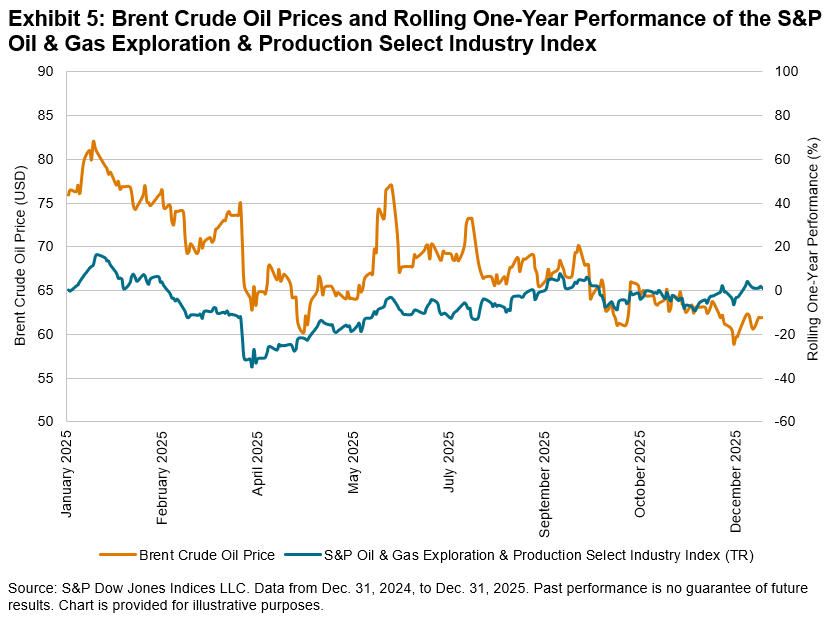
To close out the 2025 Wrapped, Oil & Gas Exploration & Production was the biggest decliner, falling 1.9% for the year. In 2025, crude oil prices overall declined as global supply exceeded demand, reflecting mainly negative performances for the industry, as shown in Exhibit 5.

In 2025, the market moved unevenly; some industries surged while others struggled, shaped by macro forces. The S&P Select Industry Indices offered valuable insights into these shifting trends, highlighting both leaders and laggards across the volatile and dispersed U.S. equity landscape. As market dynamics continue to evolve, with ongoing concerns about a potential AI bubble,6 lingering uncertainty over tariffs and rapidly changing geopolitics in the region, staying attuned to industry-level developments could prove crucial in helping understand the key drivers of the market and the economy in 2026.


1 Vörös, Benedek. “Rallies, Records and Relentless Restlessness: A Tale of Markets in 2025.” S&P Dow Jones Indices. Dec. 16, 2025.

2 S&P Global Ratings. “U.S. Telecom And Cable 2025 Outlook: Convergence, Consolidation, And Disruption.” Jan. 13, 2025.

3 Data as of Dec. 9, 2025.

4 S&P Market Intelligence. “US tariffs: Impact on the US construction industry.” July 21, 2025.

5 S&P Ratings. “The Health Care Credit Beat: Medical Devices And Supplies Tariff Impact Muted–For Now.” Oct. 22, 2025.

6 Ganti, Anu. “Animal Spirits or Anxiety?” S&P Dow Jones Indices. Nov. 13, 2025.

The posts on this blog are opinions, not advice. Please read our Disclaimers.

Index-Based Investing in Islamic Finance: 2025 Review

Contributor Image
Sue Lee

Director and APAC Head of Index Investment Strategy

S&P Dow Jones Indices

The Islamic asset management industry has been experiencing growth in index-based investing, and these trends have accelerated in 2025. As of October 2025, assets under management (AUM) in exchange-traded funds (ETFs) linked to Islamic indices reached USD 7.3 billion, a 44% YTD increase (see Exhibit 1)—outpacing the 30% growth observed in the global ETF market.1

While Islamic ETFs are traditionally more associated with equities, sukuk is becoming a significant segment, now comprising 9% of total AUM following two new ETF listings this year. Beyond sukuk, there is an expanding range of offerings that include sector, factor, sustainability, active and option-based strategies, offering innovative options for diversification and participation in the various components of the Islamic finance universe.

Performance of Global Islamic Equity and Sukuk Indices

Global equities have demonstrated strong performance this year, bolstered by global monetary easing and AI-driven enthusiasm. By the end of October 2025, the S&P Global BMI stood with a 21.0% increase YTD.2 However, Shariah-compliant global equities slightly underperformed their conventional counterparts overall, with the S&P Global BMI Shariah and Dow Jones Islamic Market (DJIM) World Index recording gains of 20.0% and 19.5%, respectively. If this trend continues, it will mark the first instance of annual underperformance for our global Islamic equity indices since 2022 (see Exhibit 2).

The relative performance of Islamic indices can be effectively analyzed through the lens of sectors. As of Oct. 31, 2025, Information Technology accounted for 40.4% of the S&P Global BMI Shariah, compared to 26.8% in the S&P Global BMI. This sector was instrumental in driving the Shariah index’s performance, contributing to 54.5% of the total return and posting an excess return of 3.1% relative to the conventional benchmark YTD. Conversely, Financials had a negative impact, resulting in an excess return of -3.5%. This is partly due to its lower weight: only 2.5% in the S&P Global BMI Shariah versus 16.5% in the S&P Global BMI. However, Shariah-compliant Financials companies also underperformed their non-compliant counterparts significantly: the S&P Global BMI Shariah Financials sector underperformed the S&P Global BMI Financials sector by 20.3% (see Exhibit 3).

Global bonds also performed well, aided by easing inflation and declining interest rates. As of the end of October 2025, USD-denominated investment grade bonds, as represented by the iBoxx $ Overall, gained 6.6% YTD. In comparison, the Dow Jones Sukuk Index (ex-Reinvestment), which tracks USD-denominated investment grade sukuk, outperformed at 7.2% YTD, driven in part by compression in credit spreads.

The Dow Jones Sukuk Index (ex-Reinvestment) displayed lower volatility in comparison to conventional bonds. Despite a wider credit spread, it outperformed with less volatility than the iBoxx $ Overall, resulting in higher risk-adjusted performance over the past decade (see Exhibit 5). This can be attributed to sukuk’s relatively shorter duration, but it may also reflect the nature of its investor base: the majority of sukuk investors are long-term, buy-and-hold Islamic institutions, including Islamic banks, insurers and pension funds, which often have regulatory or Shariah compliance requirements to hold sukuk. A relative absence of speculative trading may contribute to lower observed volatility.

Looking Ahead

The global sukuk market continues to expand; it surpassed the USD 1 trillion mark in outstanding issuance this year.3 The USD-denominated sukuk sector has gained prominence due to increasing financing needs of core Islamic finance countries and the growing interest of non-Islamic sovereigns in sukuk as a financing option. The historical performance and risk profile of USD-denominated sukuk also underscores its potential for wider adoption among non-Islamic fixed income market participants. However, the situation regarding Shariah Standard 62 of the Accounting and Auditing Organization for Islamic Financial Institutions (AAOIFI) remains uncertain, with amendments and delays in implementation that warrant close monitoring.4

Currently, most ETFs tracking Islamic indices are within products domiciled in North America and Europe, largely due to the more developed ETF markets in these regions. While this trend may persist and drive the majority of growth in the sector in the foreseeable future, other regions are also beginning to embrace index-based investing. The relevance of index-based investing to MENA-based investors is supported by a growing library of empirical evidence: the recent S&P Indices Versus Active (SPIVA®) Scorecard shows that actively managed MENA and GCC equity funds largely underperformed their relevant benchmarks.5

Amid these developments, indices could continue to play a role as benchmarks for Shariah-compliant investments and as the basis for innovative, transparent solutions to meet the evolving needs within the Islamic finance sector. As the market matures, the integration of index-based strategies changes the landscape for Islamic finance participants and fosters greater accessibility for a diverse range of investors. This evolution may support sustainable growth and help ensure that the Islamic finance sector remains adaptive in a rapidly changing global landscape.


This article was first published in IFN Annual Guide 2026.

1 Source: ETFGI. Data as of Oct. 31, 2025.

2 All returns mentioned in this post are total returns in USD.

3 Tan, Jessica. “Sukuk Market Hits USD 1 Trillion This Summer: What You Should Know.” S&P Dow Jones Indices. Sept. 2, 2025.

4Sukuk Issuance Trends Show Resilience.” S&P Global Ratings. July 8, 2025.

5 Ganti, Anu R. et al. “SPIVA® MENA Mid-Year 2025.” S&P Dow Jones Indices. Oct. 28 2025.

The posts on this blog are opinions, not advice. Please read our Disclaimers.

The S&P Israel 30 LargeCap Index: Uncovering the Performance of Israel’s Large Caps

Contributor Image
Carlos Mendizabal

Senior Analyst, Global and Thematic Equity Indices Product Management

S&P Dow Jones Indices

Opening the Door to Untapped Opportunities

As investors broaden their opportunity set beyond the most widely held markets, Israel’s large-cap equities have increasingly drawn attention. The S&P Israel 30 LargeCap Index offers a focused way to access this segment of the market, capturing many of the country’s most liquid companies across sectors such as Information Technology, Health Care, Financials, Industrials and Energy. In 2025, the index has been among the strongest performers in USD total return terms, highlighting Israel’s relevance within the global equity landscape.

Breaking Down the Index

The S&P Israel 30 LargeCap Index measures the performance of the 30 largest and most liquid companies listed and domiciled in Israel, drawn from the S&P Israel 100 Index as its underlying universe. The index follows a float-adjusted market capitalization weighting scheme and is rebalanced quarterly to reflect market dynamics. To mitigate concentration, single-stock weights are capped at 8% and single GICS® sector weights at 30% at each rebalance.

An important characteristic of the S&P Israel 30 LargeCap Index is its sector composition, which reflects the structure and diversity of Israel’s economy. As of Dec. 31, 2025, Financials represented the largest weight at 27.7%, providing a foundation of historic stability and liquidity through major banking institutions. Information Technology followed at 24.1%, highlighting the country’s strong presence in software, analytics and semiconductor development. Real Estate accounted for 9.5%, while Health Care contributed 8.4%, showing the presence of pharmaceuticals and medical innovation. Industrials (8.8%) and Energy (6.3%) added representation from manufacturing, defense and renewable energy segments. Smaller weights include Utilities (6.5%), Communication Services (4.2%), Materials (2.8%) and Consumer Staples (1.7%), demonstrating that the index reflects both growth-oriented sectors and essential services. This diversified structure offers a comprehensive view of Israel’s large-cap market, balancing innovation-driven industries with established sectors.

2025 in Review: The S&P Israel 30 LargeCap Index Led International Performance

In 2025, the S&P Israel 30 LargeCap Index stood out, punching above its weight. In USD total return (gross of tax) terms, the index gained 75.49%, materially ahead of major international large-cap peers. Over the same period, the S&P 500® gained 17.39%, the S&P Europe 350 gained 36.90%, the S&P Emerging LargeCap gained 26.70% and the S&P/Topix 150 gained 26.36%.

Positioned for Growth

Turning our sight toward valuations, the S&P Israel 30 LargeCap Index stands out. Despite a robust rebound from ’s levels, its historical forward valuation multiples remained strong on a relative basis. With a forward price-to-earnings ratio (P/E) of 14.07, the index currently trades at a significant discount compared to peers such as the S&P 500 (23.14) and S&P Europe 350 (16.41). This valuation is coupled with an expanding earnings growth outlook. Importantly, this growth trajectory is underpinned by Israel’s sophisticated, technology-driven corporate ecosystem, which has historically exhibited an ability to innovate while maintaining profitability.

Rounding Up the S&P Israel 30 LargeCap Index

The S&P Israel 30 LargeCap Index provides a focused view of Israel’s largest and most liquid companies, spanning both innovation-led industries and established financial and industrial leaders. After a strong 2025 performance, its valuation profile remains relatively strong versus several major large-cap benchmarks, making it a useful reference point for comparing global equity markets.


1 Source: S&P Capital IQ. Based on analysts’ consensus estimate for its future Earnings Per Share (EPS) for the next 12 months or fiscal year.


The posts on this blog are opinions, not advice. Please read our Disclaimers.

A Fundamental Approach to Weighting Stocks: The S&P 500 Revenue-Weighted Index

Contributor Image
Hugo Barrera

Senior Analyst, Product Management

S&P Dow Jones Indices

The S&P 500® Revenue-Weighted Index assigns company weights based on revenue rather than market capitalization. By anchoring weights to revenue, the index may help reduce concentration risk, limit weights in higher-valued stocks and increase representation of companies that generate more sales. In this blog, we review the index’s performance characteristics, valuation metrics and diversification profile.

Year-to-Date and Long-Term Outperformance

Year-to-date, the S&P 500 Revenue-Weighted Index has outperformed the S&P 500® by 2.18% and by 1.57% over the past year (see Exhibit 1). Over the long term, including back-tested performance, the index has also delivered strong results, with annualized performance of 11.92% and slightly lower volatility than The 500®.

Lower Valuations Relative to the S&P 500

Revenue-weighted indices have historically exhibited lower price multiples than market-cap-weighted indices, which naturally allocate the largest weights to stocks with the highest share price appreciation. As shown in Exhibits 2 and 3, the S&P 500 Revenue-Weighted Index’s price-to-earnings (P/E) and price-to-sales (P/S) ratios relative to The 500 currently stand at 0.75 and 0.25, respectively—well below their historical averages of 0.83 and 0.41, respectively. This reflects the index’s reduced weight in the most highly valued stocks and its increased weight in companies with large, established revenue bases.

Lower Weight in Magnificent 7 Stocks

As illustrated in Exhibit 4, the S&P 500 Revenue-Weighted Index assigns lower weights to each of the Magnificent 7 stocks compared to The 500. Overall, the index’s total weight in these stocks is 22.3% lower than that of The 500, further reducing concentration risk.

Sector Weight Comparison

As shown in Exhibit 5, Health Care (20.83%) and Financials (15.31%) currently represent the largest sector weights in the S&P 500 Revenue-Weighted Index, corresponding to overweights of 11.06% and 2.25%, respectively. In contrast, Information Technology is the most underweighted sector, with an 11.77% weight—22.81% below its weight in The 500. Overall, the S&P 500 Revenue-Weighted Index currently offers a more balanced sector distribution compared to The 500.

Conclusion

The S&P 500 Revenue-Weighted Index represents an alternative to traditional market-cap weighted benchmarks by prioritizing companies with strong top-line performance. By emphasizing sales, this approach aims to better reflect fundamental company strength, while offering reduced concentration risk and lower weight in higher-valued stocks.

The posts on this blog are opinions, not advice. Please read our Disclaimers.

Cautioning the Clairvoyant

Contributor Image
Anu Ganti

Head of U.S. Index Investment Strategy

S&P Dow Jones Indices

December is typically when we hear Wall Street strategists announce their forecasts for the S&P 500® for the year ahead, and this year has been no exception: 2026 forecasts have ranged from a relatively bearish 7,100 from Bank of America to a bullish 8,000 from Deutsche Bank. But how accurate have these forecasts been in the recent past?1

While 2025 is not quite in the books yet, we can look to forecasts from the end of 2023 and 2022 to understand how well strategists did at predicting S&P 500 performance in subsequent years. Exhibit 1 shows that what these forecasts had in common was they consistently underestimated the scale of market gains in both years, with The 500® up double digits in 2023 and 2024, a sharp contrast from the losses witnessed in 2022.

Complementing these top-down forecasts, a bottom-up forecasting approach involves industry analysts calculating price targets for individual S&P 500 constituents, the medians of which are then aggregated to arrive at a target price estimate for the index in the next 12 months. This target price can then be divided by the actual price to convert the estimate into an “implied” target return.

Exhibit 2 compares the actual S&P 500 12-month return to the implied target return on a quarterly frequency over a 20-year period. There were noticeable divergences between actual versus forecast returns, particularly during the financial crisis, when the S&P 500 decline of 39% in 2008 was significantly different from the gain of 17% predicted 12 months earlier. Another example occurred during 2022, when the actual index loss of 19% differed from the gain of 11% predicted a year earlier.

Predicting the S&P 500 target in a year may seem like a daunting effort, but what about forecasting market gains over a longer horizon? Exhibit 3 looks at the annualized average 10-year return forecast for the S&P 500 from the Philadelphia Federal Reserve’s Survey of Professional Forecasters2 and compares this statistic to the actual 10-year performance of the S&P 500. Spanning an almost 25-year period, predictions were generally bleak historically, most prominently in 2008 and 2009, with actual 10-year losses of 3% in each year for The 500 compared to forecasts of 8% and 9%, respectively, 10 years earlier.

Regardless of whether forecasts are top-down or bottom-up in nature, over one year or longer, history tells us that predicting future market performance may be a futile exercise.3 As we approach 2026, numerous unknowns remain, including the future rate trajectory of the Fed, the fate of Big Tech’s investment in AI, along with lingering inflation and tariff-related concerns globally. For those who decide to make asset allocation decisions based on these forecasts, caution may be warranted.

1 One of the earliest records analyzing the poor track record of forecasters is by Alfred Cowles in his paper, titled, “Can Stock Market Forecasters Forecast?” Econometrica, July 1933.

2 See “Survey of Professional Forecasters,” Federal Reserve Bank of Philadelphia.

3 Unless of course you have access to a genie, see indexologyblog.com/2025/11/13/animal-spirits-or-anxiety

The posts on this blog are opinions, not advice. Please read our Disclaimers.