Get Indexology® Blog updates via email.

In This List

Advisor Profile: How Direct Indexing SMA Users Evaluate Solutions and Indices

Multi-Factor Indices in the GCC Market

Understanding and Tracking Leveraged Loans

One Year On: The Rise of the S&P Quality FCF Aristocrats Indices

Powering the Future amid the AI Surge

Advisor Profile: How Direct Indexing SMA Users Evaluate Solutions and Indices

Contributor Image
Brandon Hass

Global Head of Client Solutions Group, Direct Indexing and Model Portfolios

S&P Dow Jones Indices

Direct indexing separately managed accounts (SMAs) are gaining traction, especially among financial advisors serving affluent and high-net-worth clients. In their recent whitepaper, Cerulli Associates projects a five-year compound annual growth rate (CAGR) of 16% for direct indexing SMA assets—the highest among all investment vehicles considered.1 In this blog, we unpack what is driving the growth of direct indexing SMAs and examine how advisors who use these solutions evaluate SMAs and their underlying indices.

Why Advisors Utilize Direct Indexing SMAs

Direct indexing SMAs are investment vehicles designed to allow users to track customized versions of well-known indices by owning the securities directly. This direct ownership creates opportunities for tax-loss harvesting, tilting for particular themes and accommodating specific client needs in other ways.

The wide range of potential applications of direct indexing SMAs may help advisors better serve their affluent and high-net-worth clients. Direct indexing SMAs traditionally require higher investment minimums compared to other investment vehicles but enable more optionality than mutual funds or ETFs.

What Matters Most to Advisors Considering Direct Indexing SMAs

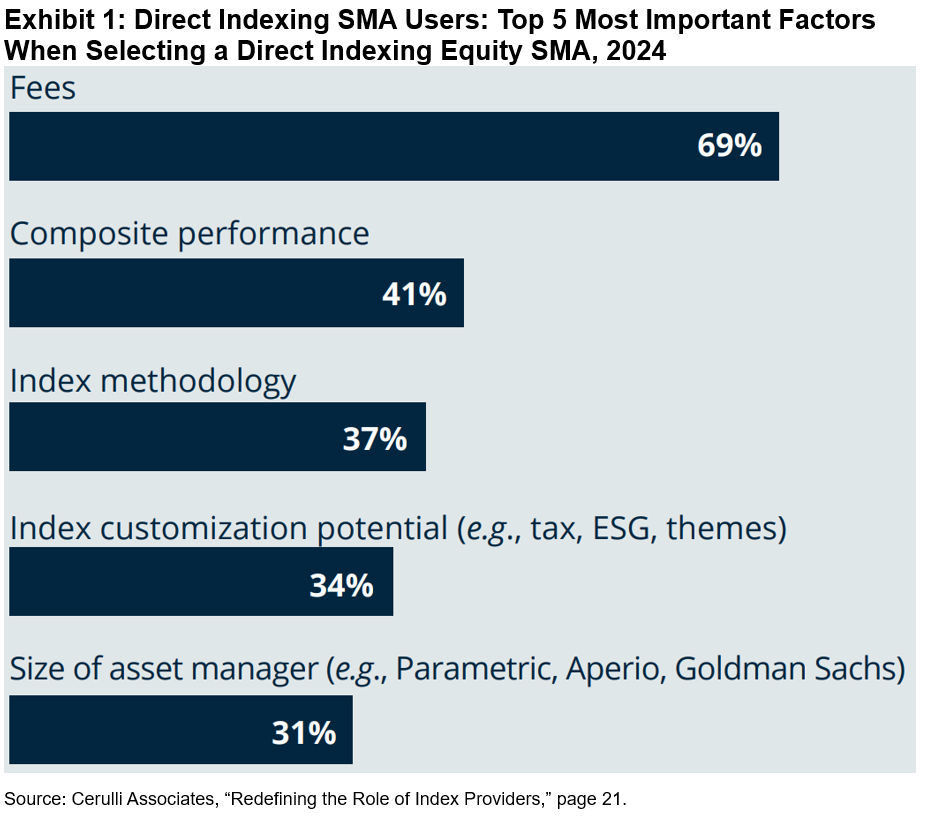
When selecting a direct indexing equity SMA, financial advisors commonly focus on fees (69%), performance (41%), index methodology (37%) and index customization potential (34%), as shown in Exhibit 1.2

These priorities reflect direct indexing SMA users’ focus on cost efficiency, outcomes and the flexibility to shape portfolios around client-specific objectives.

Key Considerations for Evaluating the Underlying Index

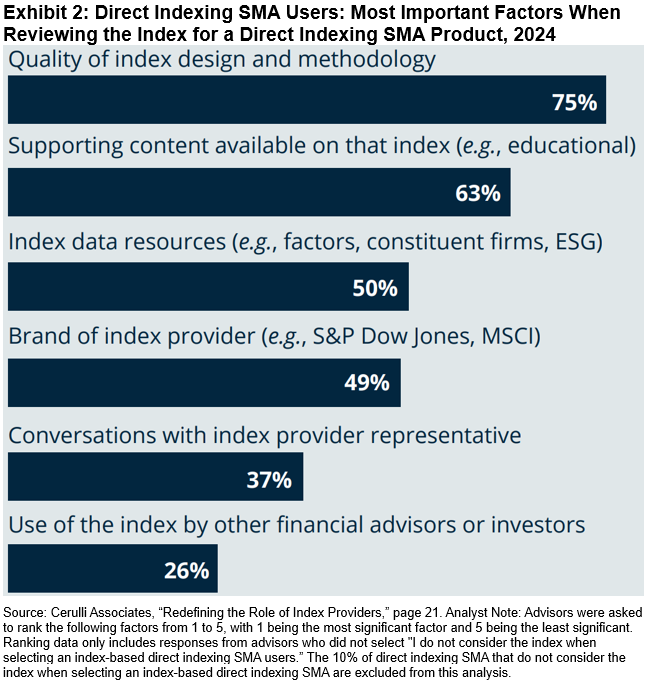
In their review of a direct indexing SMA’s underlying benchmark, financial advisors commonly focus on quality of index design and methodology (75%), supporting content available on that index (63%), index data resources (50%), brand of the index provider (49%) and conversations with an index provider representative (37%), as shown in Exhibit 2.

Index providers with strong brand equity can be an important resource by supplying the above index information to advisors for client conversations. According to Cerulli, most financial advisors using direct indexing SMAs report using index performance data (90%), index design and methodology information (83%), and performance attribution analyses (82%)2—all of which are readily available and accessible from leading index providers.

Index providers “collaborate with us on index design; we use their data and [they] help raise awareness and education for direct indexing,” an executive at an asset manager told Cerulli.3

Cerulli reports that 31% of direct indexing SMA advisors actively engage with index providers, while 35% expect they will engage more in the future.2 This growing trend underscores the potential for index providers to act as a key resource to advisors using direct indexing SMAs as they seek to improve their practices’ functions.

Opportunities for Direct Indexing SMA Users

The survey results suggest that direct indexing SMA users value index providers that can deliver both flexibility and education. Advisors in this segment may need resources that help explain to clients how and why a customized index may align with their objectives.

By providing accessible supporting content, robust data resources and opportunities for direct engagement, index providers offer resources that help these advisors differentiate their practices as direct indexing adoption continues to grow.

To learn more about how financial advisors are using direct indexing SMAs and working with index providers, explore the full Cerulli whitepaper, “Redefining the Role of Index Providers.”


1 The Cerulli Associates whitepaper “Redefining the Role of Index Providers” was sponsored by S&P Dow Jones Indices. Please see page 4.

2 Please see page 21 of Cerulli Associates’ “Redefining the Role of Index Providers.”

3 Please see page 5 of Cerulli Associates’ “Redefining the Role of Index Providers.”

The posts on this blog are opinions, not advice. Please read our Disclaimers.

Multi-Factor Indices in the GCC Market

Contributor Image
Kevin Multhaup

Senior Analyst, Factors and Dividends Indices

S&P Dow Jones Indices

The Middle East is a rapidly evolving region and one of its key growth areas has been factor indexing. The increasing adoption of these strategies has been driven by a desire for risk reduction, enhanced returns and cost efficiencies. This trend is evident not only in the adoption of single-factor styles but also in multi-factor approaches that combine single factors with low correlations for greater diversification.

The S&P GCC Composite Quality, Value & Momentum (QVM) Multi-Factor Index tracks companies within the GCC area—comprising Bahrain, Kuwait, Oman, Qatar, Saudi Arabia and the United Arab Emirates (UAE)—that exhibit the highest combined scores in quality, value and momentum. Utilizing a bottom-up approach, the index averages each constituent’s individual factor scores to produce a combined multi-factor score, identifying constituents that score highly, on average, across each factor.

Higher Risk-Adjusted Returns Relative to Single-Factor Indices

The combination of quality, value and momentum has the potential to be complementary, as each factor may react differently to various phases of the business cycle. Quality tends to be more defensive, value is generally pro-cyclical, while momentum often outperforms during sustained market trends. By harnessing these factors in tandem, there is a possibility for improved risk-adjusted returns compared to relying on any single factor alone.

Exhibit 2 illustrates this point, showing that the annualized return per unit of risk was higher for the multi-factor index compared to the single-factor indices over the long term (2008-2025).

Strong Long-Term Outperformance

The S&P GCC Composite QVM Multi-Factor Index outperformed each of the individual single-factor indices and its benchmark universe on both an absolute and risk-adjusted basis over the full back-tested period. In the shorter term, the index outperformed over one-, three- and five-year periods. A review of its capture ratios reveals that the index outperformed in upward-trending markets while maintaining moderate defensive qualities during downturns.

Diversification across the Economic Cycle

Most factors exhibit outperformance over the long run; however, none work all the time. Individual factor styles react in unique ways to the different phases of the economic cycles, outperforming at various stages. This is illustrated in Exhibit 4, which charts individual factor performance for each year between 2009 and 2024.

Low Excess Return Correlations

Some market participants may utilize single factors tactically, while others prefer multi-factor approaches that eliminate the need for precise timing. Exhibit 5 shows the historical low correlations of excess returns among the S&P GCC Single-Factor Indices. This characteristic is a key reason why combining these factors within the QVM methodology tends to result in a smoothing of risk-reward profiles.

Conclusion

By leveraging a multi-factor approach, there is a potential for diversification within the GCC markets versus the benchmark universe. The different factor characteristics such as the defensiveness of quality and the cyclical benefits of value across market cycles has helped to smooth performance for the S&P GCC Composite QVM Multi-Factor Index, with recent live and longer-term hypothetical back-tested performance showing enhanced risk-adjusted returns. A multi-factor strategy also has the potential to benefit from positive developments in the region. Additionally, those seeking to learn more about Shariah-compliant options may want to explore the S&P GCC Composite QVM Multi-Factor Shariah Index.


The posts on this blog are opinions, not advice. Please read our Disclaimers.

Understanding and Tracking Leveraged Loans

How are benchmarks like the S&P UBS Leveraged Loan Index and S&P UBS Western European Leveraged Loan Index helping bring transparency to one of the largest fixed income markets? Take a fundamental look at leveraged loans with Marco Pouw, S&P DJI’s Director of Fixed Income Indices.

The posts on this blog are opinions, not advice. Please read our Disclaimers.

One Year On: The Rise of the S&P Quality FCF Aristocrats Indices

Contributor Image
Elizabeth Bebb

Director, Factor & Dividend Indices

S&P Dow Jones Indices

Launched Sept. 23, 2024, the S&P Quality FCF Aristocrats® Indices track companies that consistently generate robust free cash flow (FCF) over a specific number of years. FCF, which represents the cash remaining after a business meets its operational costs and capital investments, serves as a key barometer of company quality.

The S&P Quality FCF Aristocrats Indices were initially introduced across two universes: the S&P 500® Quality FCF Aristocrats Index and the S&P Developed Quality FCF Aristocrats Index, which both require positive FCF for at least 10 consecutive years. Both indices have outperformed their respective benchmark universes over the one-year period since their launch and on a YTD basis in 2025. The S&P 500 Quality FCF Aristocrats Index notably outperformed during the tariff-related drawdowns, while the S&P Developed Quality FCF Aristocrats Index saw a slightly higher drawdown, reflecting the different responses to the economic backdrop across regions.

Over the long term, including hypothetical back-tested performance, both indices have consistently outperformed their benchmark universes, demonstrating strong absolute terms as well as impressive risk-adjusted performance.

An analysis of these indices across various macroeconomic environments, including hypothetical back-tested performance, shows that they have excelled in a range of regimes characterized by rising and falling inflation and growth. Historically, the S&P Developed Quality FCF Aristocrats Index outperformed or matched the S&P Developed Large MidCap in all four environments. The S&P 500 Quality FCF Aristocrats Index only underperformed the S&P 500 during periods of high growth and high inflation.

These indices aim to identify high-quality companies through FCF-based screening and selection metrics utilized in their methodology. Exhibit 4 examines the metrics that make up the FCF score for both indices, revealing that they exhibit higher return on equity (ROE), higher operating margins and lower financial leverage compared to their respective benchmark universes.

Quality can be assessed by various metrics; however, FCF has historically proven to be an effective lens for identifying high-quality companies. The S&P Quality FCF Aristocrats Indices have had a strong start, outperforming their benchmark universes since launch while also demonstrating positive risk-adjusted performance, robust fundamentals and defensiveness over longer back-tested periods.

The posts on this blog are opinions, not advice. Please read our Disclaimers.

Powering the Future amid the AI Surge

Contributor Image
Abbie Zhang

Senior Analyst, Thematic Indices

S&P Dow Jones Indices

Reports indicate that AI is a major force driving markets, with nearly 50% of S&P 500® earnings estimated to be directly or indirectly linked to AI.1 The narrative surrounding AI earnings and spending is largely focused on the infrastructure development necessary to support the anticipated productivity boom, particularly in data centers and the power infrastructure.

Growth of Data Centers and Power Infrastructure

As organizations increasingly depend on data-driven decision-making, demand for cloud computing is surging, leading to significant growth in the data center market. This market is projected to reach USD 584.9 billion by 2032, reflecting a compound annual growth rate of 11.7%.2 Global electricity demand from data centers is expected to more than double by 2030, with U.S. data centers anticipated to account for nearly half of the growth in electricity demand, contributing over 20% to the overall growth.3

To meet the growing energy demands of data centers and other technology-driven applications,4 U.S. electricity demand is projected to increase by 25% by 2030 and by 78% by 2050, compared to 2023 levels.5 This growth could have significant implications for the reliability and affordability of electricity, highlighting the urgency of building a robust power system. Research indicates that investments in U.S. power infrastructure are expected to total USD 1 trillion from 2025 through 2029.6

The substantial capital flowing into these infrastructure segments has attracted market attention, as their utilization rate will likely be an early sign of the fortunes of AI and its impact on the global economy. S&P Dow Jones Indices aligns with this trend by offering two indices that track these areas: the S&P Data Center, Tower REIT and Communications Equipment Index and the S&P U.S. Power Infrastructure Select Index.

S&P Data Center, Tower REIT and Communications Equipment Index

The S&P Data Center, Tower REIT and Communications Equipment Index measures the performance of developed market-domiciled, U.S.-listed organizations involved in the ownership and management of data centers, telecommunication towers and related equipment.

This index employs FactSet’s Revere Business Industry Classification System (RBICS) Focus data to select relevant companies, which are organized into two tiers: Data Center and Tower REITs, accounting for approximately 53% of the index, and Communication Equipment, comprising about 47% as of Sept. 20, 2025.

The index includes 25 constituents, with a substantial 94% weight attributed to U.S.-domiciled companies (see Exhibit 1). In terms of GICS® breakdown, most of the weight comes from the Information Technology and Real Estate sectors, accounting for 53.5% and 42.5%, respectively (see Exhibit 2).

The S&P Data Center, Tower REIT and Communications Equipment Index has outperformed the S&P Telecom Select Industry Index over the past three years, though it has recently underperformed (see Exhibit 3). The outperformance was primarily driven by the relatively higher-weighted communications equipment companies, while the recent lag can be attributed to a higher weight in the underperforming Real Estate sector.

S&P U.S. Power Infrastructure Select Index

The S&P U.S. Power Infrastructure Select Index tracks the performance of publicly traded companies from the S&P Composite 1500® that are involved in U.S. power infrastructure. This index employs RBICS to define companies related to U.S. power infrastructure and categorizes them into three sub-themes based on their revenue exposure: Power Transmission and Distribution, Energy Supply for Electrification, and Power Generation. These sub-themes encompass the entire industry’s value chain.

As of Sept. 30, 2025, the index comprised 66 constituents, with most of its weight coming from the Utilities, Industrials and Energy sectors. Notably, the Utilities sector accounted for nearly half of the total weight (see Exhibit 4).

Compared to the S&P Composite 1500 Utilities, the S&P U.S. Power Infrastructure Select Index outperformed by 4.38% in annualized total return terms over the past three years, achieving an annualized return of 17.94% (see Exhibit 5). Since May, there has been a notable surge in performance, primarily driven by the strong performance of Electrical Equipment companies.

Conclusion

As we enter a transformative era driven by AI, the demand for robust infrastructure—especially data centers and power systems—has become increasingly critical. The S&P U.S. Power Infrastructure Select Index and the S&P Data Center, Tower REIT and Communications Equipment Index serve as essential benchmarks for evaluating the performance of companies within these vital sectors that could be a window into AI adoption across the global economy.

1   Analysis-Investors on guard for risks that could derail the AI gravy train By Reuters

2   https://www.fortunebusinessinsights.com/data-center-market-109851

3   AI is set to drive surging electricity demand from data centres while offering the potential to transform how the energy sector works – News – IEA

4   https://www.iea.org/news/global-electricity-demand-to-keep-growing-robustly-through-2026-despite-economic-headwinds

5   U.S. Demand Growth Forecast | ICF

6   https://www.spglobal.com/market-intelligence/en/news-insights/research/energy-utility-capex-projected-to-eclipse-790b-from-2025-through-202b

The posts on this blog are opinions, not advice. Please read our Disclaimers.