As financial markets respond to the ongoing energy transition, market participants are exploring ways to address the related risks and opportunities. Indices can provide insights to these factors. In this context, the S&P Global Carbon Credit Index, which turned six years old on July 25, 2025, emerges as a potential tool for enhancing diversification and to help understand the performance of underlying carbon credit markets.1
The S&P Global Carbon Credit Index tracks the most liquid segment of the tradable carbon credit futures markets, including futures contracts on European Union Allowances, U.K. Allowances, California Carbon Allowances and the Regional Greenhouse Gas Initiative and Washington Carbon Allowances (WCA), with pricing data from ICE Futures Pricing.
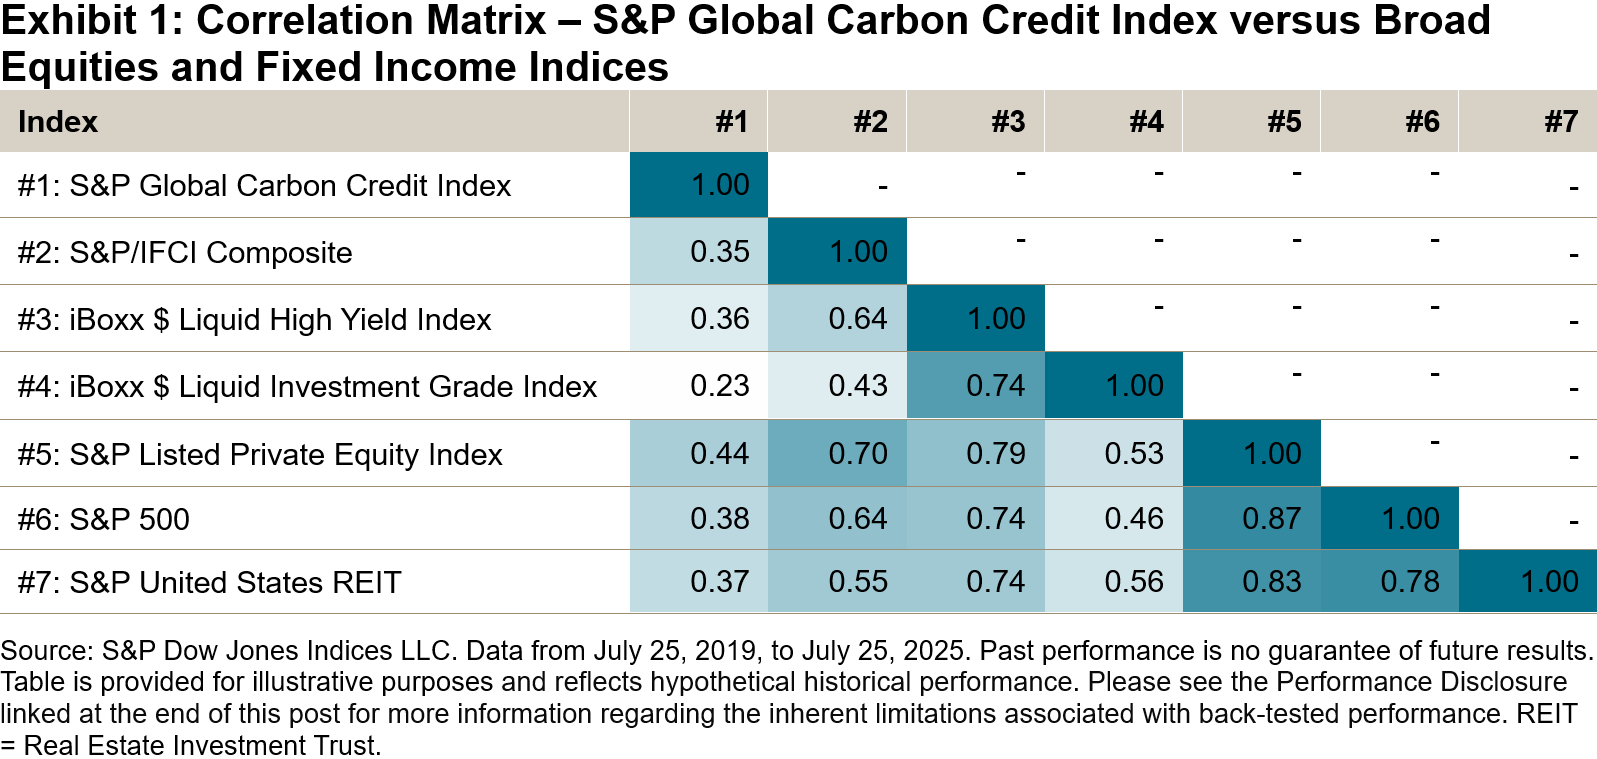
Exhibit 1 presents a correlation matrix that uses five-trading-day rolling returns to compare the S&P Global Carbon Credit Index with indices such as the S&P/IFCI Composite, iBoxx $ Liquid High Yield Index, iBoxx $ Liquid Investment Grade Index, S&P Listed Private Equity Index, S&P 500® and S&P United States REIT, covering the period from July 25, 2019, to July 25, 2025. The results of this analysis show that the S&P Global Carbon Credit Index exhibited a low correlation with these traditional indices, particularly with the iBoxx $ Liquid Investment Grade Index and iBoxx $ Liquid High Yield Index, with correlation values of 0.23 and 0.36, respectively.
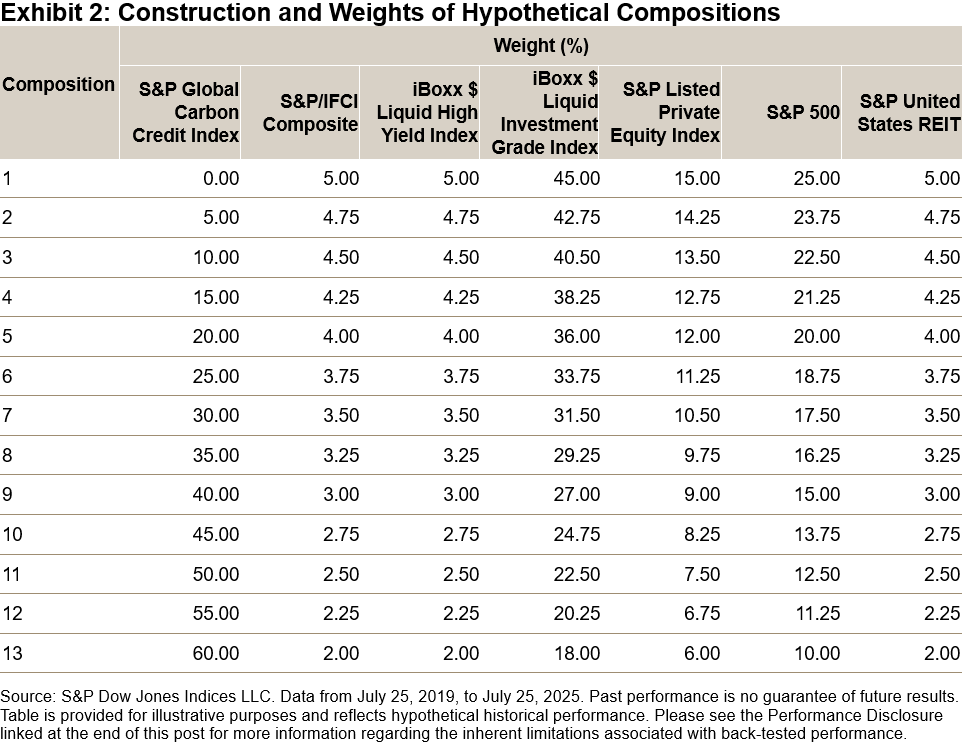
To evaluate the potential diversification characteristics of the S&P Global Carbon Credit Index, we explored 13 hypothetical compositions, as illustrated in Exhibit 2. Starting with Composition 1, which contained only indices #2 to #7 in Exhibit 1, we examined the hypothetical impact of adding weight to the S&P Global Carbon Credit Index in 5% increments, with the remaining composition weights retaining their original relative proportions. As a result, we rebalanced each composition by proportionately decreasing the weight of the other indices, ensuring they retained their initial allocation ratios from Composition 1 in all subsequent compositions, while excluding the weight of the S&P Global Carbon Credit Index. For example, in Composition 1, the S&P 500 represents 25% of the composition. In Composition 2, with the addition of the S&P Global Carbon Credit Index at 5%, the weight of the S&P 500 is adjusted to 23.75%, reflecting 25% of 95% of the total composition.
Next, we calculated the performance for each hypothetical composition (assuming a daily rebalance to the target weights) for the period from July 25, 2019, to July 25, 2025. The resulting annualized returns, annualized volatilities and corresponding return/risk ratios are summarized in Exhibits 3 and 4.
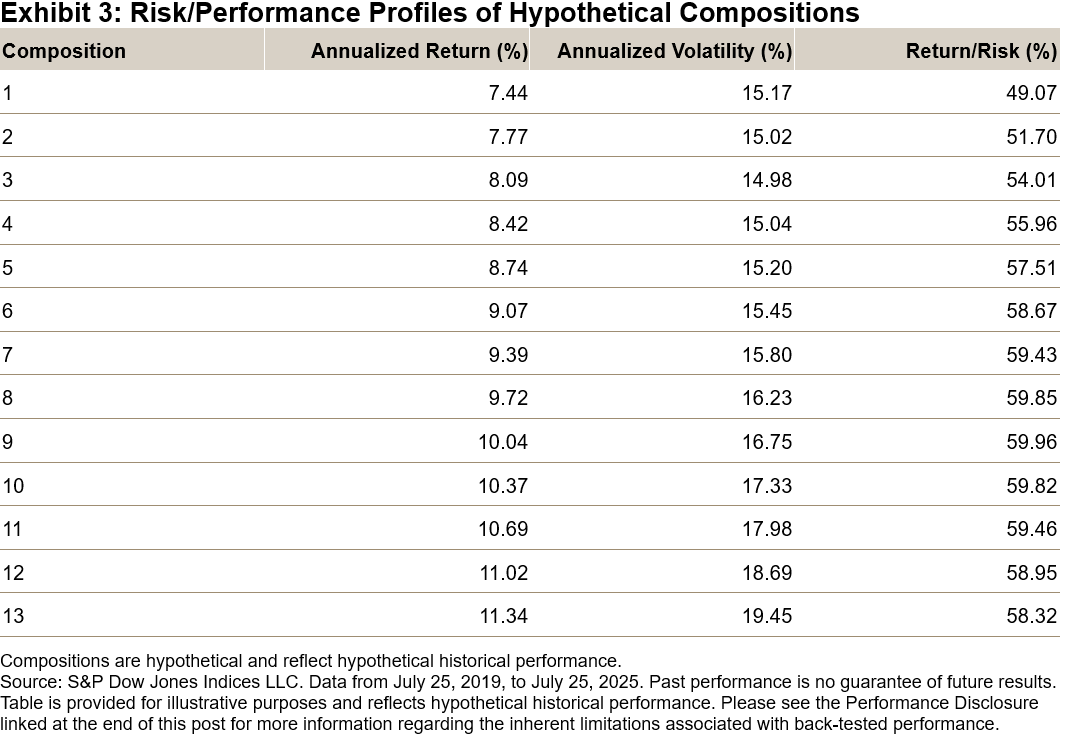
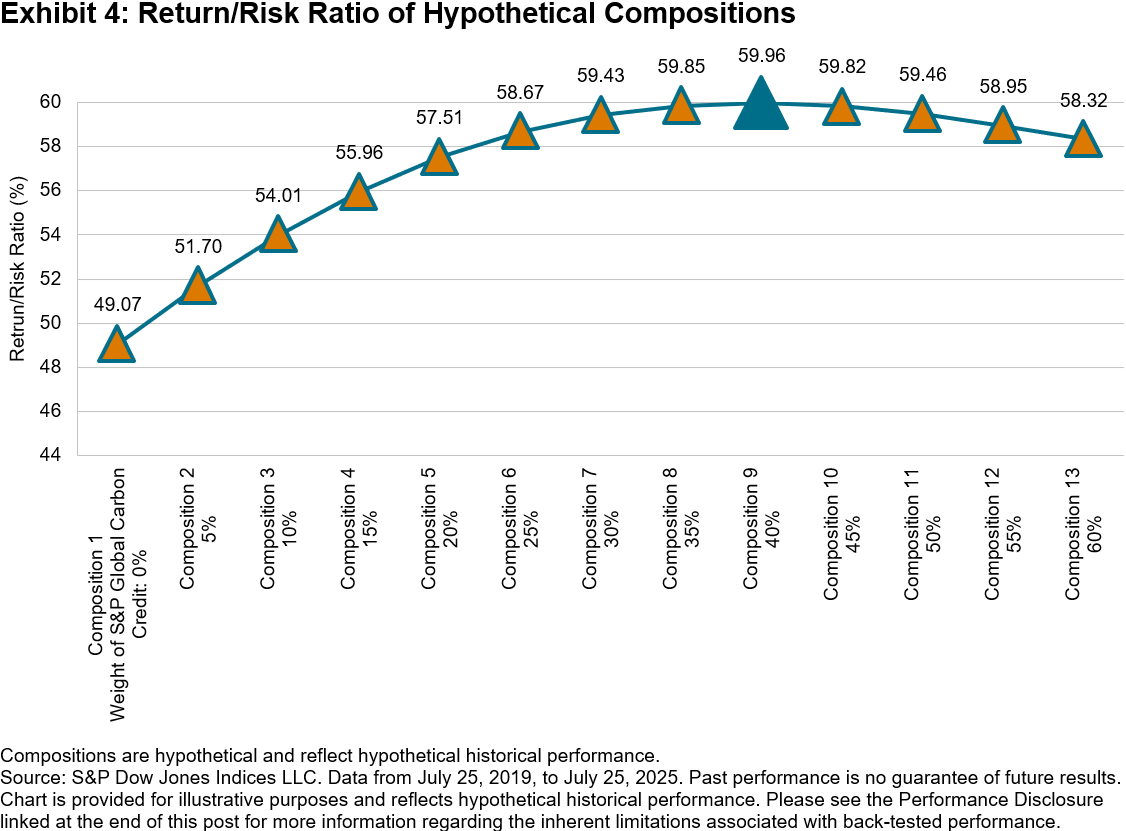
The results of this assessment were revealing. Composition 1 began with an annualized volatility of 15.17%, resulting in a return/risk ratio of 49.07%. As the weight of the S&P Global Carbon Credit Index increased, both the return/risk ratio improved and the annualized return increased. This trend peaked in Composition 9, which recorded values of 59.96% for the return/risk ratio and 10.04% for the annualized return, associated with a 40% weight to the S&P Global Carbon Credit Index.
However, beyond Composition 9, as the weights in the S&P Global Carbon Index grew larger, volatility began to increase, while the return/risk ratio declined.
Accordingly, we may conclude that over its live history, carefully considered tilts to the S&P Global Carbon Credit Index could have led to enhanced risk-adjusted performance. Moreover, due to its historically low correlation with other traditional asset class benchmarks, the S&P Global Carbon Credit Index may provide the basis for a strategic diversification of traditional market risks as they evolve, while simultaneously serving as a mechanism for addressing emissions exposure and mitigating the potential risks associated with the energy transition.
The author would like to thank Maya Beyhan for her continued mentorship and contributions to this blog.
1 For more details on how carbon credit futures can help mitigate emission exposures and energy transition risks, see Beyhan, Maya, and Kennedy, William, “The role of indexes in the energy transition,” S&P Global, March 4, 2025.
The posts on this blog are opinions, not advice. Please read our Disclaimers.