Get Indexology® Blog updates via email.

In This List

Tech Titans and Global Champions: A Look Inside the S&P Global 100

The Market Measure: June 2025

Unlocking the Advantage of Volatility-Control Innovation

S&P ADR Indices: Focusing on Foreign Equities

Tactical Exposure to U.S. Asset Classes

Tech Titans and Global Champions: A Look Inside the S&P Global 100

Contributor Image
Carlos Mendizabal

Senior Analyst, Global and Thematic Equity Indices Product Management

S&P Dow Jones Indices

The author would like to thank Darius Nass for his contributions to this blog.

Global Champions in a Cross-Current Macro Landscape

In early 2025, global equity markets were marked by heightened volatility due to AI-driven earnings growth, monetary policy normalization and rising trade uncertainty. Despite these challenges and mixed market signals, the S&P Global 100, consisting of diversified multinational companies, showed resilience and seems to have effectively navigated the market YTD.

Index Composition and Methodology

The S&P Global 100 is a subset of the S&P Global 1200 and consists of 100 of the world’s leading publicly listed companies. Constituents are selected based on international revenue exposure, sector representation, liquidity and market capitalization. To qualify, companies must generate over 30% of their revenue and hold over 30% of their assets outside their home country, ensuring genuine global exposure. The index is weighted by float-adjusted market capitalization (FMC) and rebalanced quarterly in March, June, September and December.

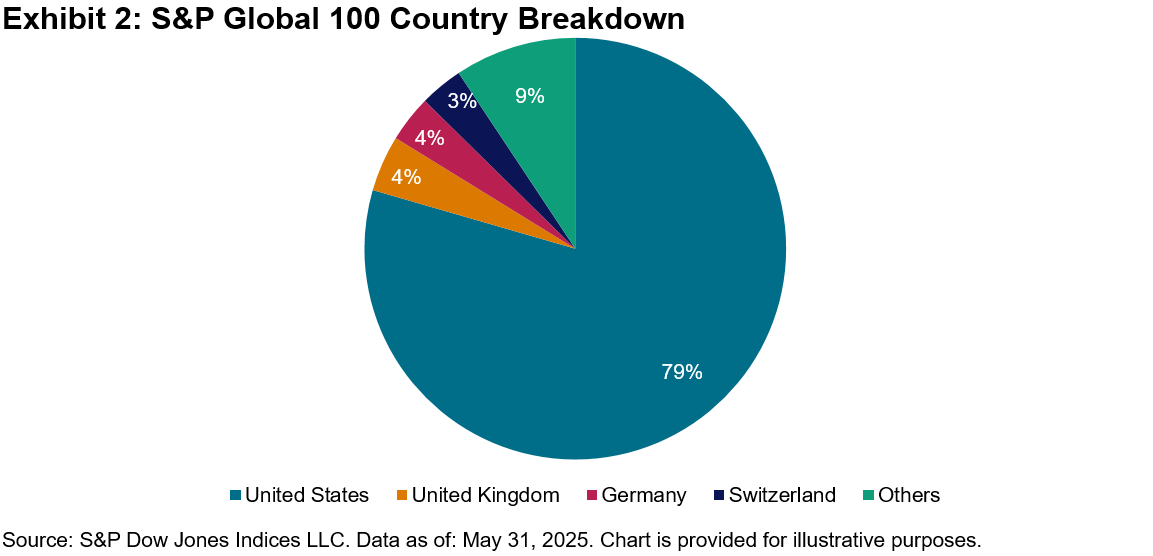
Although the index has significant weight in U.S.-domiciled companies as a byproduct of its methodology, its real economic exposure is more nuanced.

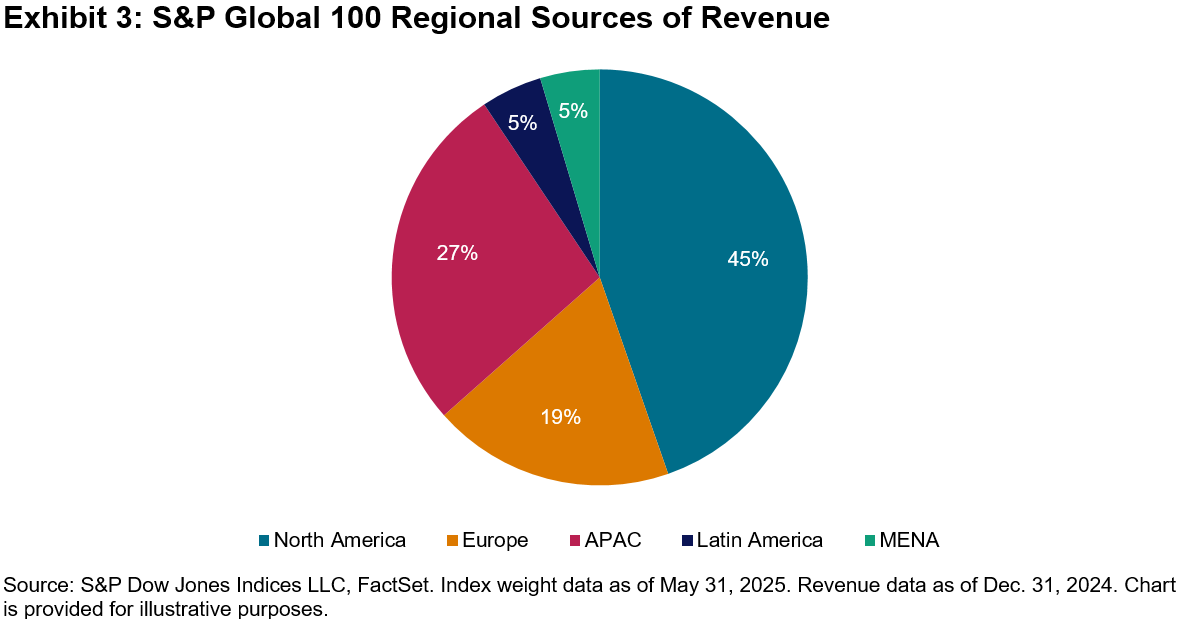
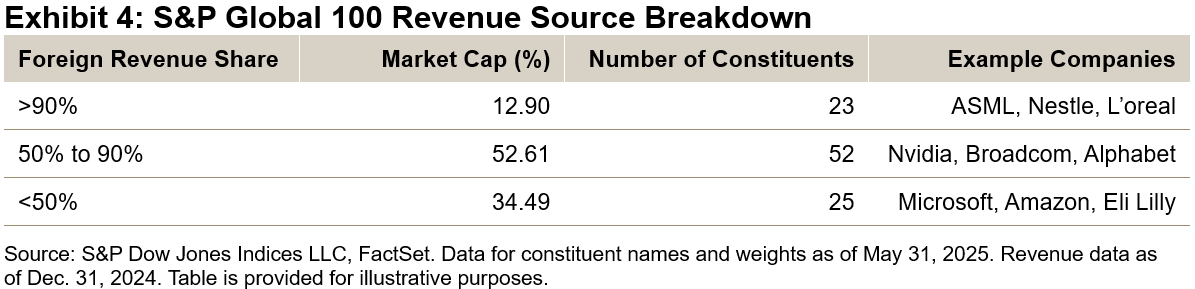
The FMC-weighted foreign revenue share of the index is approximately 60%, with a mean of 67% among all constituents. On average, index constituents generate more than half of their revenue outside their economic region.[1] Less than 15% of the index’s FMC is near the 30% threshold, and none of these constituents overlap in terms of GICS® sector. As such, despite recent discussions on reshoring and global trade risks, significant turnover of the index appears unlikely.

Performance Review

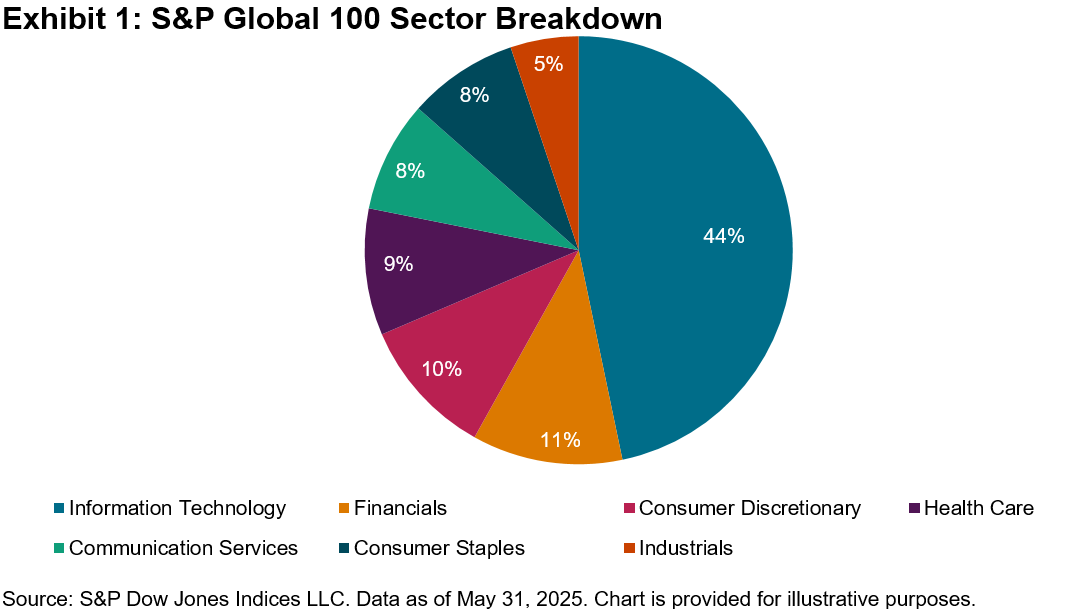
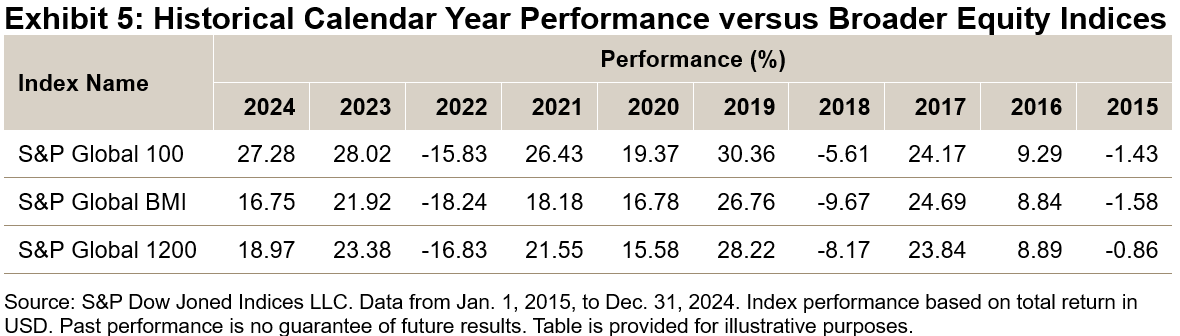
Following a robust 27.28% rally in 2024—driven by Big Tech earnings and multiple expansion—2025 has seen increased volatility due to changing rates expectations, high valuations and trade uncertainty. As of May 31, 2025, the S&P Global 100 posted a YTD gain of 2.30%, reflecting noticeable return differences across sectors and regions. Financials led with a contribution of 1.73% on the back of the elevated interest rate environment, while Consumer Staples and Industrials added 0.90% and 0.67%, respectively. Conversely, Information Technology, Consumer Discretionary and Communication Services lagged, with declines of 0.84%, 0.40% and 0.30%, respectively, as investors shifted from growth-oriented sectors. Regionally, U.S. equities contributed to a 0.80% decline in the index performance, while Europe more than offset that loss with a 2.55% impact due to favorable policies and attractive valuations. Asia-Pacific also contributed with a 0.54% gain, amid trade disruptions and tariff issues.[2]

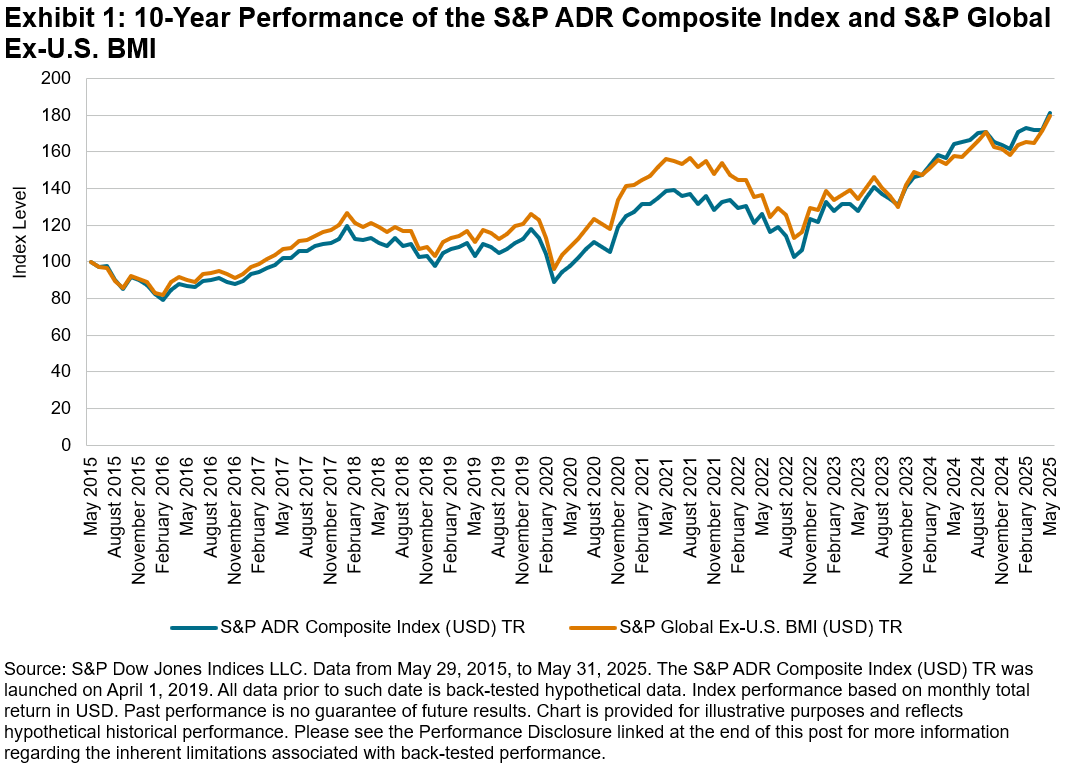
Over the past decade, the index consistently outperformed broader global equity markets, demonstrating long-term resilience.

Concluding Insights

The S&P Global 100 continues to serve as a robust benchmark for tracking globally influential companies. Despite its focus on large float-adjusted market cap firms, the index’s thoughtful design helps mitigate sector concentration and enhances revenue diversification. These characteristics make it particularly well-suited for navigating today’s complex market environment, marked by macroeconomic uncertainty and shifting global dynamics.


[1] Source: S&P Dow Jones Indices LLC, FactSet. Data for constituent names and weights as of May 31, 2025. Revenue data as of Dec. 31, 2024.

[2] Source: S&P Dow Jones Indices LLC. Data as of May 31, 2025. Calculations are based on gross total return index levels in USD. Past performance is no guarantee of future results.

The posts on this blog are opinions, not advice. Please read our Disclaimers.

The Market Measure: June 2025

Review a resurgent S&P 500, check in on the performance of trend-following equities, dig into two factor indices—the S&P 500 High Beta Index and S&P 500 Low Volatility Index—that took a very different route to the same destination, make a detour for a look at the performance of select international equities and find out what VIX is telling us about the coming summer.

To make sure you never miss an episode, sign up for content alerts.

The posts on this blog are opinions, not advice. Please read our Disclaimers.

Unlocking the Advantage of Volatility-Control Innovation

How are indices using new risk-control techniques to help enhance stability and responsiveness to evolving market conditions? Look inside the S&P 500 Advantage Index and explore how this innovative tool observes intraday volatility and uses estimations of future market movements to dynamically adjust its weights between equity and cash to navigate potential market declines and recoveries while targeting a consistent volatility level. 

The posts on this blog are opinions, not advice. Please read our Disclaimers.

S&P ADR Indices: Focusing on Foreign Equities

Contributor Image
Diego Zurita

Analyst, Global Equities & Thematics

S&P Dow Jones Indices

International equities have been gaining attention in 2025. As discussed in a previous blog post, international stocks have been outperforming U.S. stocks so far this year. The S&P ADR Index Series is one of the S&P Dow Jones Indices offerings that focuses on international markets through U.S.-listed securities.

American depositary receipts (ADRs) are securities that represent shares of non-U.S. companies that are held by a U.S. depositary bank and are listed on U.S. stock exchanges. They provide U.S. market participants access to foreign stocks, but incur fees different from those of their local listings. ADRs are suitable for direct indexing and could be of interest to those who don’t have easy access to foreign stock markets.1

One might wonder if indices that measure these type of securities perform similarly to those that measure stocks listed on foreign exchanges. Compared to the S&P Global BMI Series, the S&P ADR Indices differ in their performance (see Exhibit 1). As not every international stock has an ADR, the number of constituents and the market capitalization of their indices has tended to be less, as illustrated by Exhibit 2. ADR indices have tended to include fewer small-cap companies, as evidenced by a higher mean and median float-adjusted market cap.

Additionally, due to the lower number of constituents, the S&P ADR Composite Index presented a higher concentration in its top 10 constituents than the S&P Global Ex-U.S. BMI. Notably, as shown by Exhibit 3, both indices share some companies as their top constituents.

Sector-wise, the weight in Information Technology stocks in the S&P ADR Composite Index was almost twice that of the S&P Global Ex-U.S. BMI (24.1% versus 12.3%) as of May 31, 2025, making the former more concetrated in growth stocks, which might tend to perform better in bull markets, but may underperform in lower growth macroeconomic environments. On the other hand, Exhibit 4 also shows that the S&P Global Ex-U.S. BMI had a higher weight in the Industrials sector.

Due to variations in their country classification, the country composition of these indices differs. For instance, the S&P ADR Composite Index had more weight in the U.K. and Taiwan, while the S&P Global Ex-U.S. BMI had a bigger proportion of Japanese companies.

However, despite the differences in their composition and performance, historically S&P ADR Indices have shown a high correlation with their foreign-listed equities index counterparts, particularly over the long term, as Exhibit 6 shows.

In conclusion, while S&P ADR Indices differ from international indices in composition, over the the long run they have compared closely in their performance and moved in a similar trend. Based on that, and after weighting the costs and benefits of ADRs, these indices can be used to gain insight into foreign equities.

1 For further information about these securities, please see the investor bulletin published by the Securities and Exchange Commision.

The posts on this blog are opinions, not advice. Please read our Disclaimers.

Tactical Exposure to U.S. Asset Classes

How are multi-asset indices combining diversification and tactical signals to meet the challenges of today’s unpredictable markets? Meet the S&P U.S. Tactical Multi-Asset 4.5% TCA 0.65% Decrement Index, a rules-based solution that uses signals to dynamically adjust long and short exposures to its U.S. equity and fixed income components, all while targeting a 4.5% volatility level. 

The posts on this blog are opinions, not advice. Please read our Disclaimers.