


How are multi-asset indices combining diversification and tactical signals to meet the challenges of today’s unpredictable markets? Meet the S&P U.S. Tactical Multi-Asset 4.5% TCA 0.65% Decrement Index, a rules-based solution that uses signals to dynamically adjust long and short exposures to its U.S. equity and fixed income components, all while targeting a 4.5% volatility level.
The posts on this blog are opinions, not advice. Please read our Disclaimers.Tactical Exposure to U.S. Asset Classes
Rebalance Review of the S&P Global Clean Energy Transition Index – H1 2025
En Garde!
Full Circle: The Resilience of Leveraged Finance
Yippy Yields and Dollar Dilemmas
Tactical Exposure to U.S. Asset Classes
Rebalance Review of the S&P Global Clean Energy Transition Index – H1 2025

Rebalance Review of the S&P Global Clean Energy Transition Index – H1 2025
Launched in 2007, the S&P Global Clean Energy Transition Index has been a headline benchmark for measuring clean energy-related companies’ performance over the past 17 years. In April 2021, we launched the S&P Global Clean Energy Select Index to measure the performance of the 30 largest companies in global clean energy businesses listed on developed market exchanges.
S&P Global Clean Energy Transition Index Rebalance in April 2025
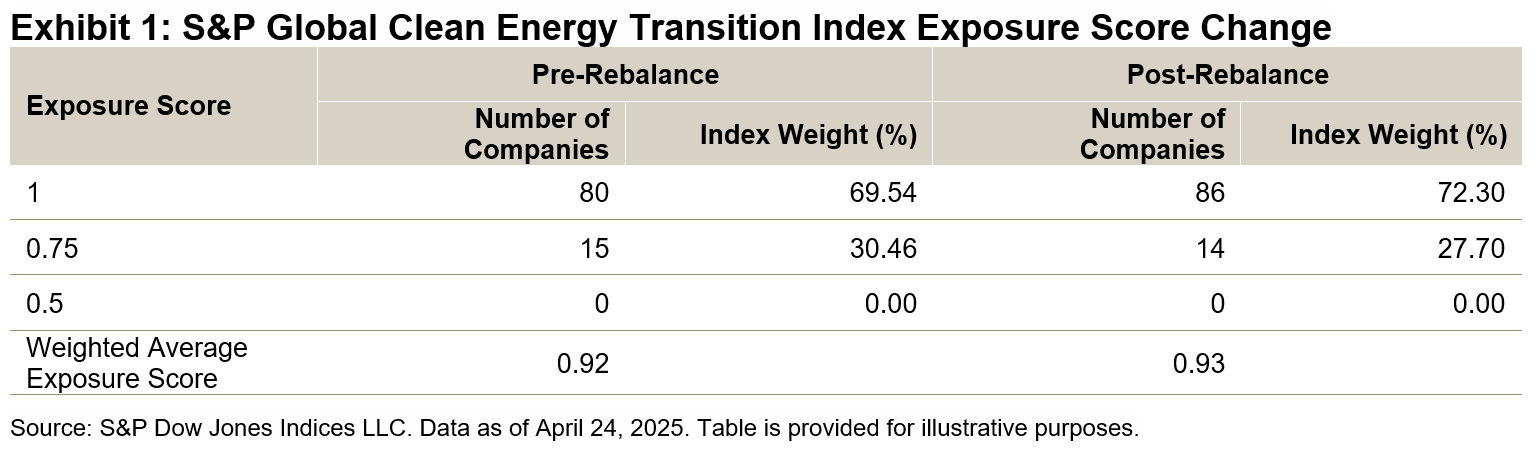
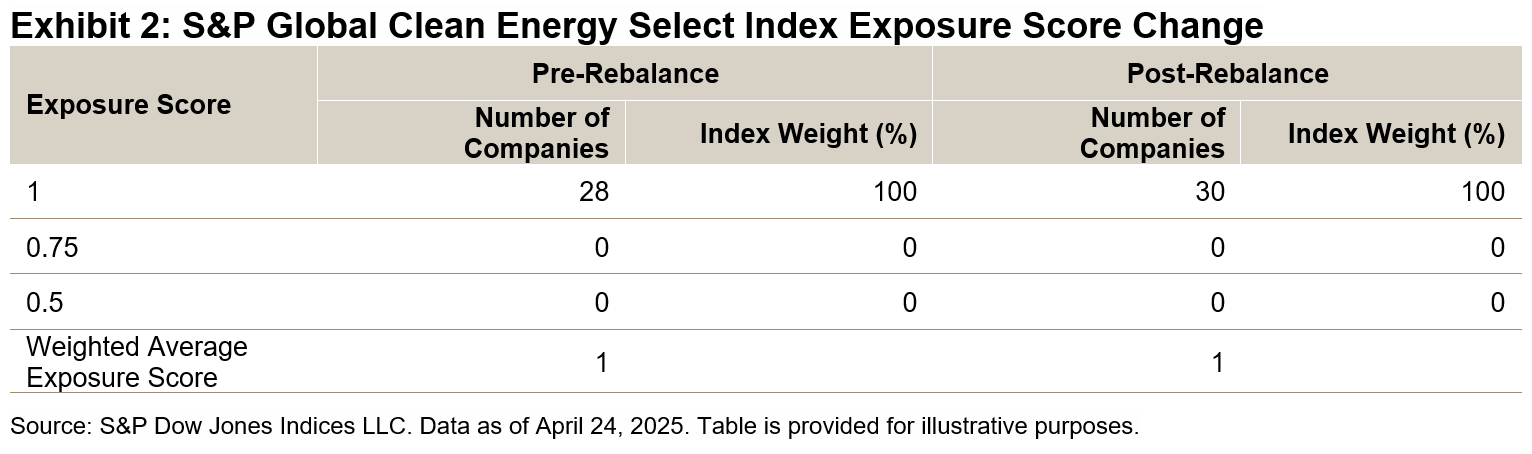
The index methodology calculates exposure scores for each company to assess their clean energy business purity, utilizing the GICS® classification system, FactSet’s Revere Business Industry Classification System (RBICS) and S&P Global Trucost’s power generation data. Companies are categorized into four exposure score buckets, ranging from 0 to 1 in increments of 0.25, reflecting increasing levels of clean energy business relevance. Both indices had their semiannual rebalances on April 24, 2025. Exhibits 1 and 2 show the change in exposures before and after the April rebalance for both indices.
For the S&P Global Clean Energy Transition Index, the weighted average exposure score increased slightly from 0.92 to 0.93 (see Exhibit 1). The S&P Global Clean Energy Select Index consists of 30 companies with an exposure score of 1 listed on the developed market exchanges (see Exhibit 2).
In the geographical exposure breakdown, prominent changes in the S&P Global Clean Energy Transition Index following the rebalance include a 3.67% weight increase for the U.S. and a 0.96% increase for China, alongside a 1.25% decrease for Spain. Meanwhile, in the S&P Global Clean Energy Select Index, China’s weight rose by 4.37% and New Zealand’s weight rose by 3.46%, while the weight of Canada declined by 2.05%.
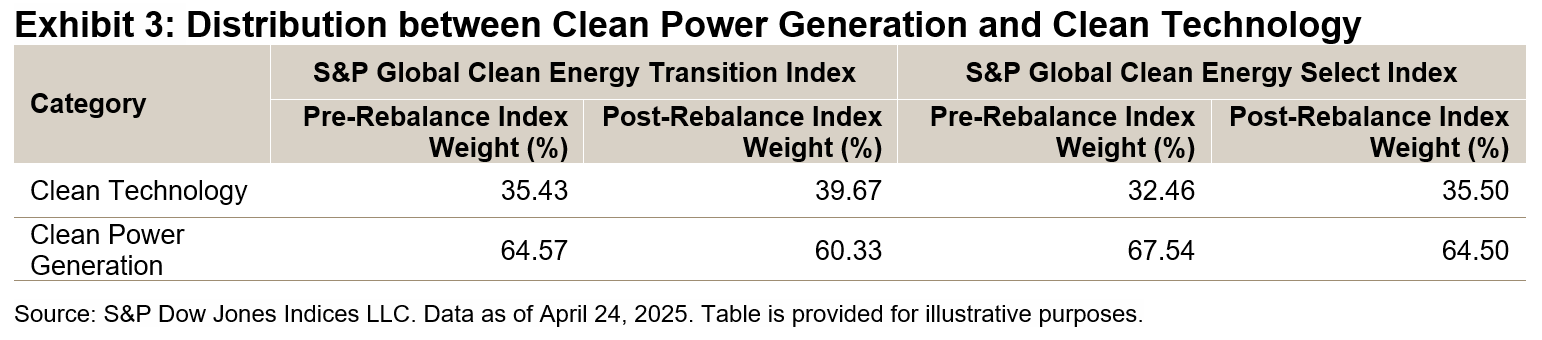
In the energy category, companies are classified into Clean Technology and Clean Power Generation based on RBICS subindustries. Clean Technology encompasses subindustries that focus on clean energy systems and manufacturing, while Clean Power Generation includes various wholesale power and electric utilities subindustries.
During the recent rebalance, the weights for clean technology increased in both indices (see Exhibit 3), primarily driven by significant gains in the weights of the Photovoltaic and Solar Cells and Systems Providers subindustries, as well as Fuel Cell Equipment and Technology Providers. Conversely, the index weight for clean power generation declined, largely due to a 1.22% decrease in the Europe Mixed Wholesale Power RBICS subindustry for the S&P Global Clean Energy Transition Index and a 1.74% decrease in the same subindustry for the S&P Global Clean Energy Select Index.
S&P Global Clean Energy Transition Index Performance YTD in 2025
As of May 30, 2025, the S&P Global Clean Energy Select Index achieved an 8.84% total return YTD in USD terms, while the S&P Global Clean Energy Transition Index gained 11.54%. Both indices outperformed the S&P Global BMI, which stood at 5.5% for the same period.
Regarding regional performance, companies domiciled in Germany within the S&P Global Clean Energy Transition Index were up 71.63% YTD. South Korea followed with an increase of 53.77%, while Brazil gained 37.61%.1
The S&P Global Clean Energy Transition Index tracks the dynamic changes in the clean energy transition and reflects the performance of clean energy-related companies, serving as a key benchmark for the global clean energy sector.
1 Source: S&P Dow Jones Indices LLC and FactSet. Data as of May 30, 2025.
The posts on this blog are opinions, not advice. Please read our Disclaimers.
En Garde!

In a world marked by geopolitical instability, the importance of defense has surged, especially within Europe. With nations increasingly pledging historically high levels of funding to enhance their military capabilities, the spotlight is on constituents that lead the charge in defense technology and infrastructure. These typically operate in crucial industry groups1 such as Aerospace & Defense, Technology Hardware & Equipment and Software & Services. Although these industry groups are pivotal for national security, their collective weight in broad indices may underrepresent their global impact. For instance, as of May 30, 2025, the Aerospace & Defense industry group constituted just 2.2% of the S&P 500®. This disparity raises an essential question: How can market participants effectively track cutting-edge defense constituents that significantly contribute to national and international security?
This might call to mind benchmarks that contain many defense-related firms such as the S&P Aerospace & Defense Select Industry Index, the S&P Software & Services Select Industry Index and the S&P Technology Hardware Select Industry Index, which are derived from the GICS framework. However, such indices are designed with a broader perspective, rather than a cross-sectoral focus, as the constituent selection for each is not based on purity to the defense theme. For example, commercial aircraft companies that do not serve the defense industry might still be included in broader Aerospace & Defense indices.2
This complexity underscores the relevance of the S&P Europe Defense Vision Index, launched on April 7, 2025, that measures the performance of industrial and technology companies across Europe that are actively involved in the manufacturing, assembly, sale and transportation of both core military weaponry and a broader range of military-related, non-weapon products and services, such as military vehicles, wearable technology, military-grade software and communication systems.3 It uses the S&P Global Business Involvement Screens Military Contracting data, which can identify use cases, going beyond just product or service, and more accurately select constituents based on purity to the defense theme.
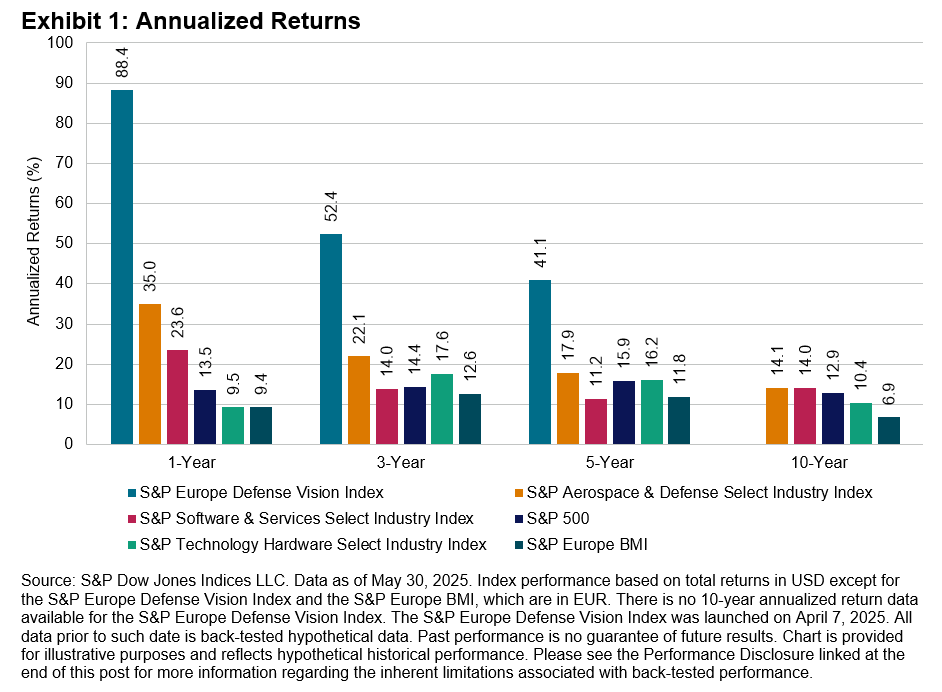
To assess the performance of defense-related indices relative to the broad market, Exhibit 1 summarizes an overview of annualized returns for the S&P Europe Defense Vision Index compared to the S&P Europe BMI, as well as the S&P Aerospace & Defense Select Industry Index, S&P Software & Services Select Industry Index and S&P Technology Hardware Select Industry Index compared to The 500™ over 1-, 3-, 5- and 10-year periods. The S&P Europe Defense Vision Index led the pack alongside the S&P Aerospace & Defense Select Industry Index (see Exhibit 1), and as of May 30, 2025, it had a cumulative return of 33.4% since its launch.
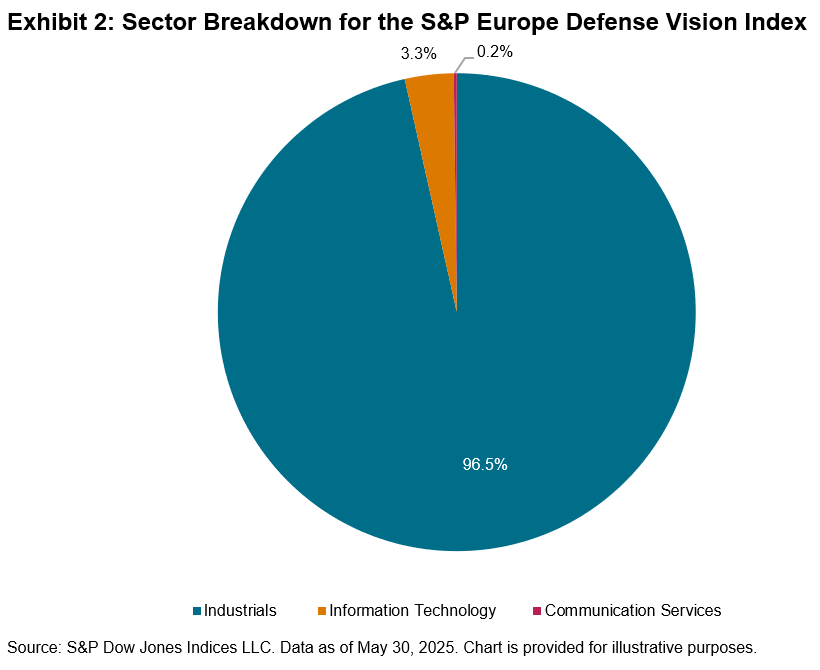
In addition to ensuring the constituent selection is based on purity to the defense theme, the S&P Europe Defense Vision Index also broadens its scope beyond industry groups within the Industrials sector to include Information Technology and Communication Services sectors, recognizing that modern defense relies heavily on cyber capabilities, software innovations and military satellite technologies. The sector breakdown represented in Exhibit 2 reflects this comprehensive approach, showing that the index measures the full spectrum of industry groups and sectors involved in defense innovation.
In conclusion, the S&P Europe Defense Vision Index stands as a benchmark for the rapidly evolving defense sector. En garde! The future of defense-based index solutions is here, and it’s ripe for exploration.
1 See the Methodology Information for GICS: Global Industry Classification Standard.
2 See the S&P Select Industry Indices Methodology.
3 See the S&P Thematic Indices Methodology.
The author would like to thank Vidushan Ragukaran for his contributions to this blog.
The posts on this blog are opinions, not advice. Please read our Disclaimers.Full Circle: The Resilience of Leveraged Finance

After Q1 2025 began with positive momentum, Q2 has seen some of the largest bouts of volatility in the recent past. The April 2 tariff announcements sent markets on a series of extraordinary swings. On April 8, the S&P 500® was down 15% YTD and VIX® spiked to 52.33.1 However, positive trade developments that followed the initial announcement, including a trade truce with China on May 12, have resulted in markets retracing the moves from early April, bringing them almost full circle to where they began the year.
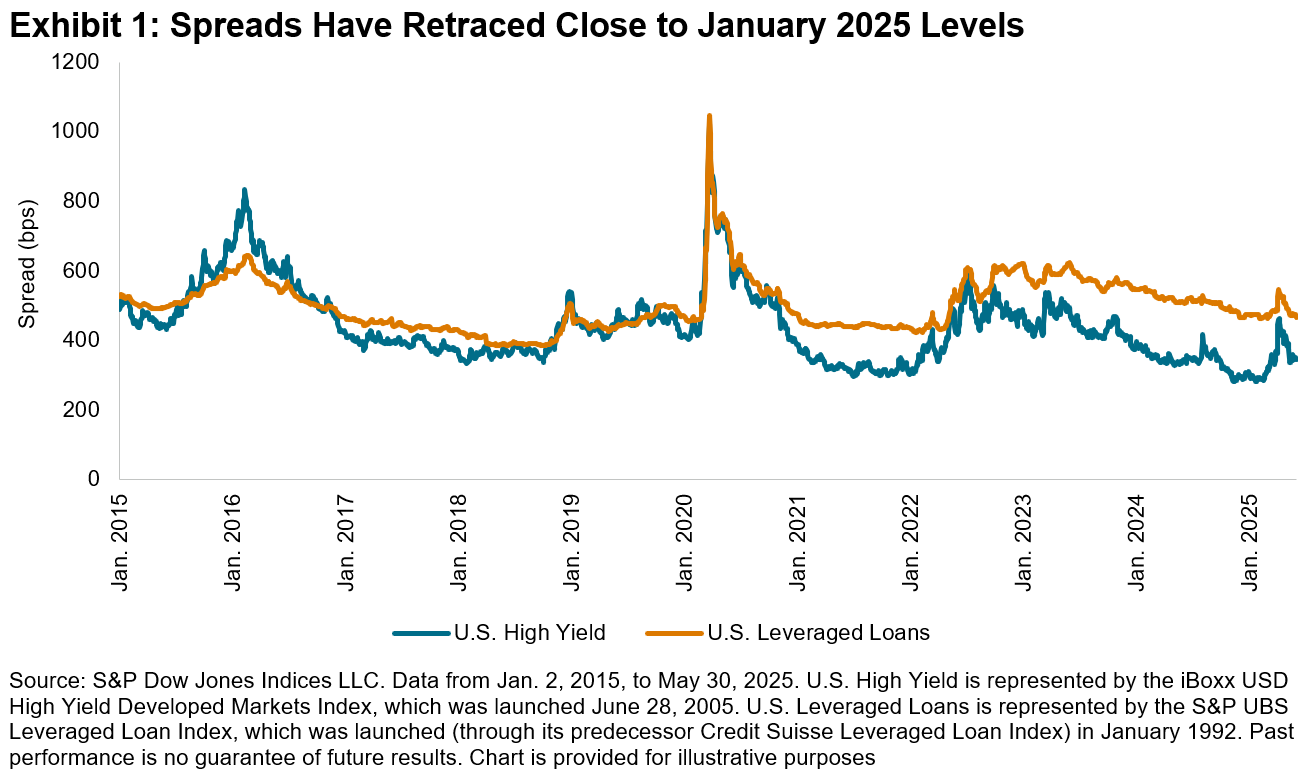
Within fixed income, U.S. high yield and bank loans (see Exhibit 1) felt much of the early-April volatility, with high yield spreads widening to 545 bps before retracing to 473 bps by the end of May. Bank loan spreads moved in similar fashion, reaching a YTD high of 462 bps on April 8 before falling back to 350 bps on May 30.2
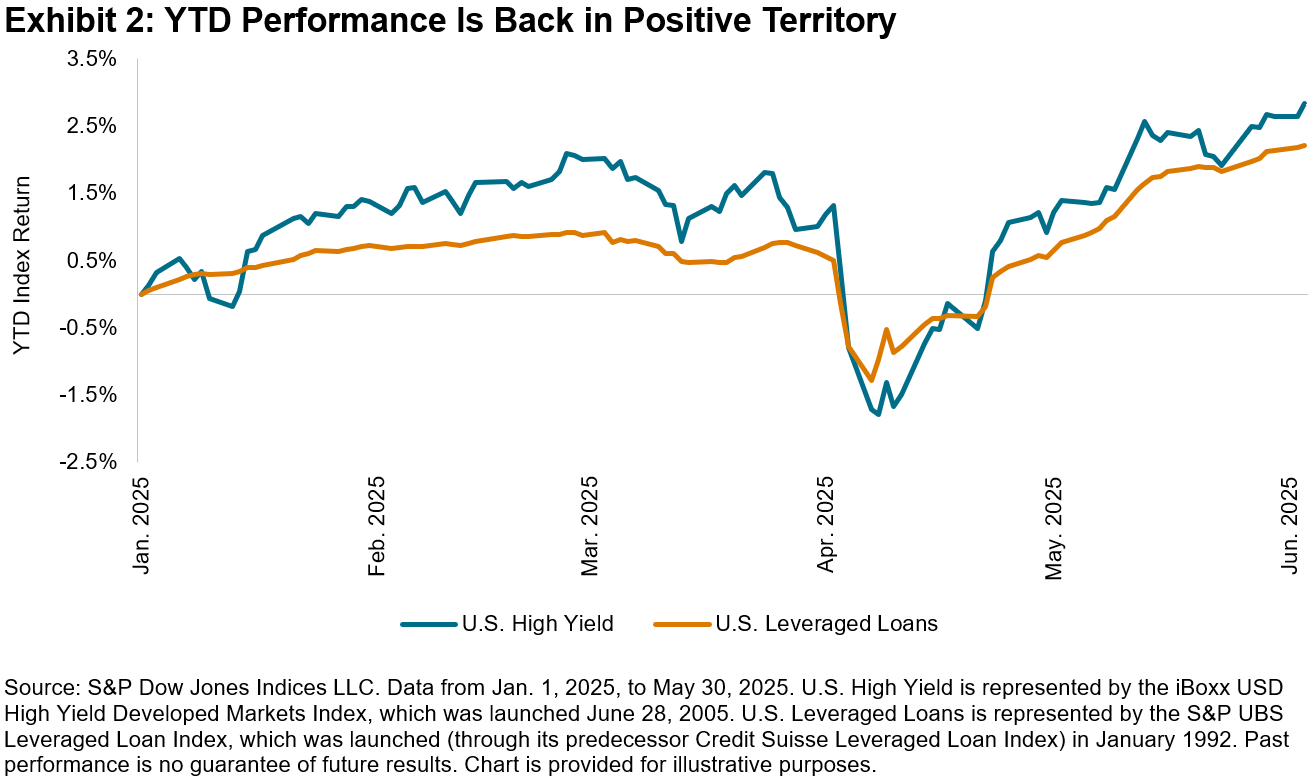
Despite the volatility of the second quarter, leveraged finance asset classes finished May back in positive return territory on a YTD basis, with high yield at 2.6% and bank loans at 2.1% as of May 30, 2025. This rebound was after both markets held negative returns for over two weeks in mid-April.
Moving into the summer, as the uncertainty surrounding tariff policy remains center stage, it is notable that credit markets have largely erased nearly all their weakness YTD. The number of bank loans trading at par or above stands at 27% as of June 6, a sharp increase from April 30’s level of 3.5%.3 While this is still far from January’s 54% level, the technical support for bank loans remains evident. Additionally, the LSTA reported a record loan trading volume of USD 253 billion in Q1 2025, 2% higher than the previous record in Q1 2020,4 evidencing the continued growth in liquidity and depth of the leveraged loan market. The U.S. leveraged loan market currently stands at USD 1.5 trillion in market value, having grown to rival the size of the U.S. high yield bond market (USD 1.4 trillion),5 a testament to the evolution of the liquidity and tradability of this asset class. With the majority of the market expecting two U.S. Fed rate cuts of 25 bps in 2025,6 leveraged loan indices and high yield bond indices, representing floating rate and fixed rate indices, respectively, may help market participants navigate the path ahead.
1 Source: S&P Dow Jones Indices, Federal Reserve Bank of St. Louis, June 8, 2025.
2 Discount margin to maturity is used for bank loan spread.
3 Source: S&P Dow Jones Indices, as of June 8, 2025.
4 Source: LSTA “1Q25 Loan Trading Volume Report”, April 22, 2025.
5 Source: S&P Dow Jones Indices, U.S. leveraged loan market represented as the USD market value of the S&P UBS Leveraged Loan Index. U.S. high yield bond market represented as the USD market value of the iBoxx USD High Yield Developed Markets Index, as of June 2, 2025.
6 Source: CME Group, June 8, 2025.
The posts on this blog are opinions, not advice. Please read our Disclaimers.Yippy Yields and Dollar Dilemmas

Equity markets have made a remarkable recovery following a turbulent start to the second quarter, with the S&P 500® closing out May up 6%. However, ongoing uncertainties surrounding tariffs and their inflationary impact, concerns about the fiscal deficit and potential shifts in foreign demand for U.S. Treasuries have weighed on the bond market, with the iBoxx $ Treasuries down 1% in May—marking its first monthly loss this year.
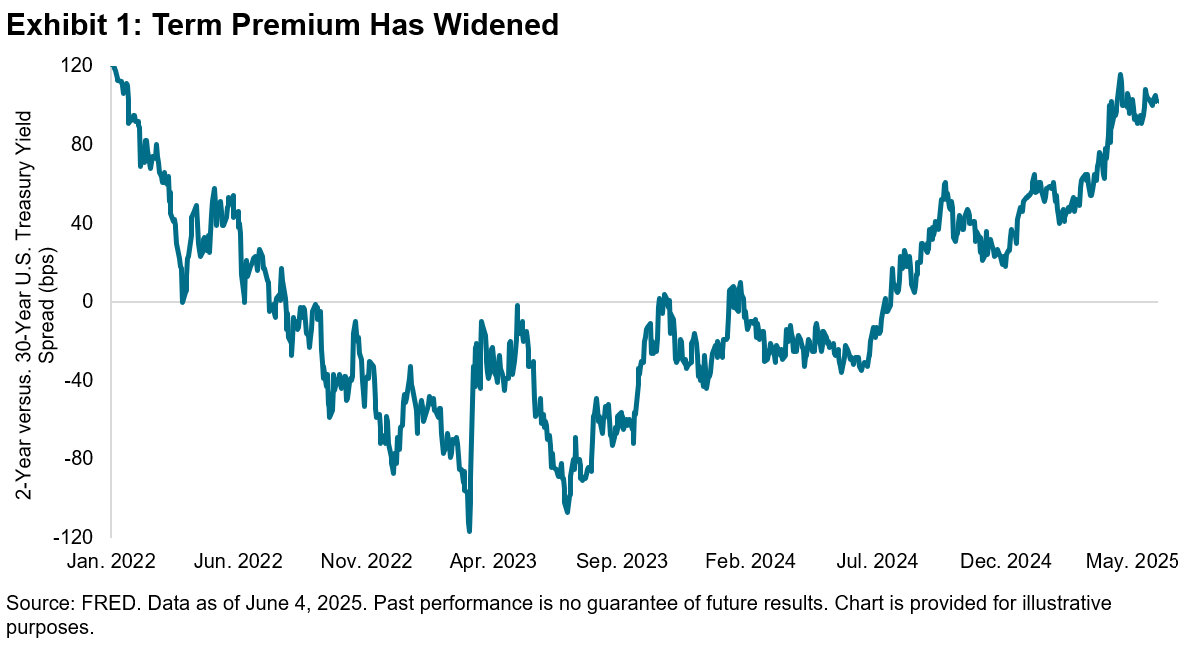
Despite declines across the yield curve on June 4, 2025, following a soft labor market report, 2-Year and 30-Year U.S. Treasury yields have surged by over 23 and 27 bps,1 respectively, since the end of April, with the 30-Year Treasury yield briefly surpassing 5% following weak demand in the 20-Year U.S. Treasury auction. As a result, the spread between short- and long-term U.S. Treasury yields has widened, suggesting that investors may be demanding greater compensation for holding longer-term debt. Exhibit 1 highlights the spread between 2-Year and 30-Year U.S. Treasury yields, which has increased to over 100 bps, reaching levels not seen since 2022.
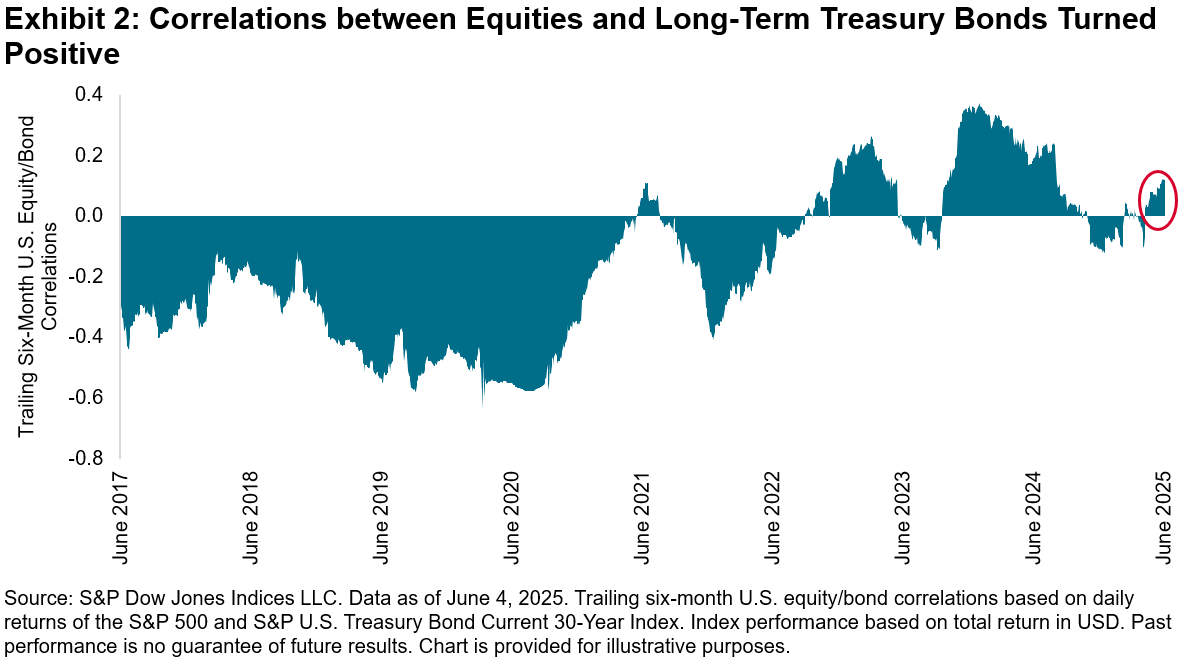
Rising yields also may affect the potential for diversification across asset classes. Traditionally, bonds have tended to exhibit an inverse correlation to equities, with notable outliers such as most of 2024. However, after witnessing negative correlations so far this year, Exhibit 2 reveals that the six-month correlations between The 500™ and the S&P U.S. Treasury Bond Current 30-Year Index have turned positive. If sustained, a positive relationship could be indicative of a potential headwind for risk-adjusted performance for combinations of both asset classes.
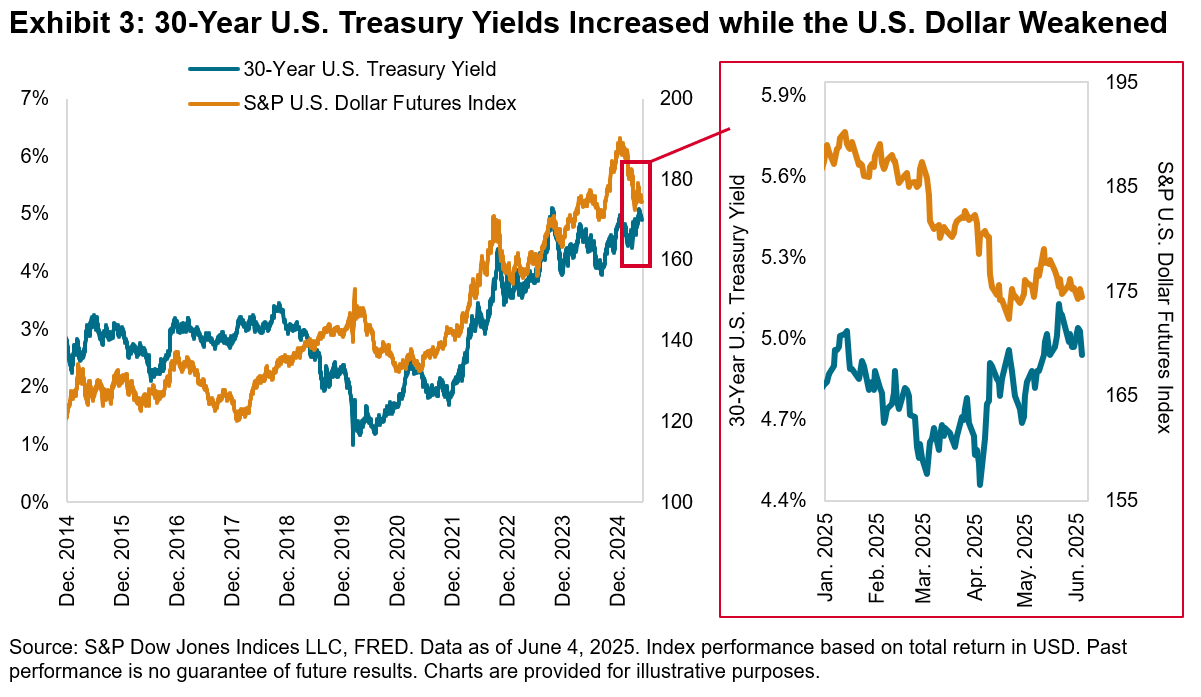
In addition to their impact on diversification, we can also examine the currency dynamics associated with an increase in bond yields, which could be particularly relevant for global asset owners who may be affected by currency hedging decisions. Notably, despite the rise in long-term U.S. Treasury yields, the U.S. dollar has weakened, with the S&P U.S. Dollar Futures Index down 4% quarter-to-date. Although the dollar stabilized in May, the currency’s weakness coinciding with rising bonds yields marks a departure from their typical positive relationship, as shown in Exhibit 3. Recent risks, including fiscal concerns and doubts about the dollar’s safe haven status, may have contributed to this diverging trend.
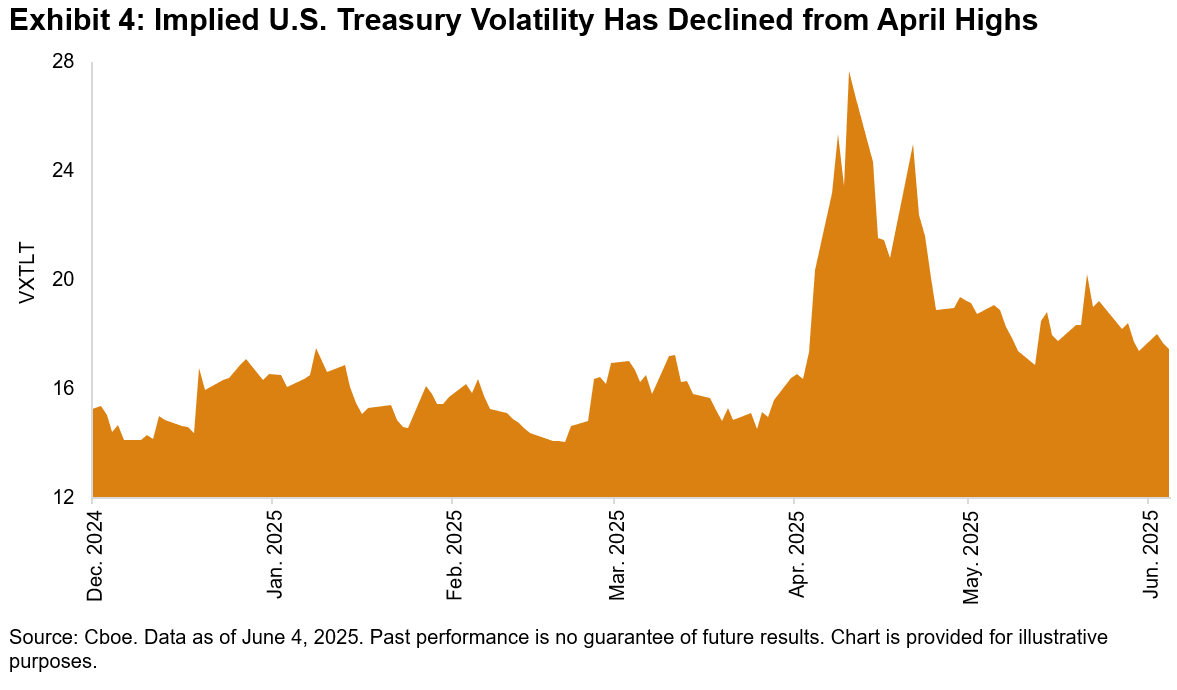
While the future trajectory of U.S. Treasury yields remains uncertain, we can look to market expectations for long-dated U.S. Treasury volatility, as measured by the options market with the Cboe 20+ Year Treasury Bond ETF Volatility Index (VXTLT). After declining from the highs observed during the market turbulence in April, Exhibit 4 shows that VXTLT rose along with longer-dated yields, surpassing the 20 mark on May 21, 2025, and closed above the 17 handle as of June 4.
Looking ahead, although numerous unknowns remain, the impact of U.S. Treasury yields on the term premium, along with the associated diversification and currency dynamics, could have significant implications for asset owners across asset classes.
1 Data as of June 4, 2025.
The posts on this blog are opinions, not advice. Please read our Disclaimers.