Get Indexology® Blog updates via email.

In This List

Diversification Redefined: Exploring the S&P 500 Diversified Sector Weight Index

Direct Indexing: Customization, Transparency and Control

Mid-Cap Express

A New Approach to S&P Aristocrats: Meet the S&P Quality FCF Aristocrats Indices

SPIVA Around the World

Diversification Redefined: Exploring the S&P 500 Diversified Sector Weight Index

Contributor Image
Wenli Bill Hao

Director, Factors and Dividends Indices, Product Management and Development

S&P Dow Jones Indices

The S&P 500® continues to be a trusted benchmark for the broad U.S. market, measuring the performance of U.S. large-cap companies across various sectors. As the market moves, certain stocks and sectors grow to represent a larger share of the index, highlighting their significant influence on the economy. While this is the natural result of market-cap weighting, some market participants are exploring alternative strategies in pursuit of enhanced diversification.

In this blog, we introduce the S&P 500 Diversified Sector Weight Index, which aims to mitigate concentration risk and address sector imbalances by reweighting companies within The 500™. This innovative approach employs a hierarchical equal sector weight methodology, utilizing Syntax’s FIS® sector taxonomy.

FIS’s Sector Taxonomy

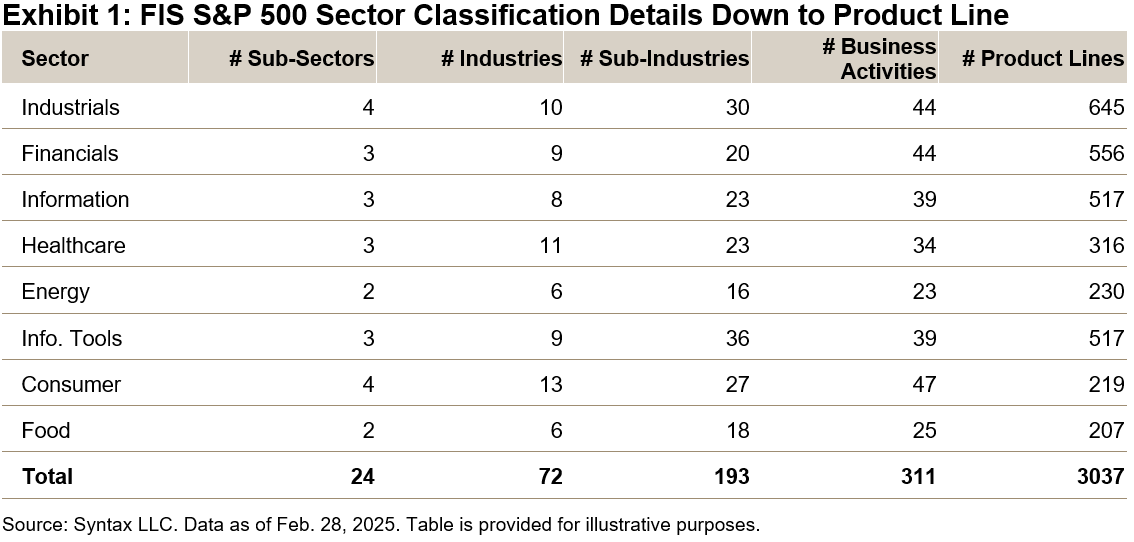
This six-level classification system captures the diverse business models and product lines of companies. As shown in Exhibit 1, the FIS sector taxonomy consists of 8 sectors, 24 sub-sectors, 72 industries, 193 sub-industries, 311 business activities and over 3000 individual product lines in the S&P 500 universe.

Index Methodology

The S&P 500 Diversified Sector Weight Index equally weights each of the eight primary sectors defined by Syntax FIS with quarterly rebalancing.1 Within each sector, level 2 sub-sectors are equally weighted, as are level 3 industries, and so forth down to business activities level (see Exhibit 2). At the lowest level, within each business activity,2 stocks are weighted proportionally based on the revenue generated within that specific activity.

Diversification Beyond Primary Business

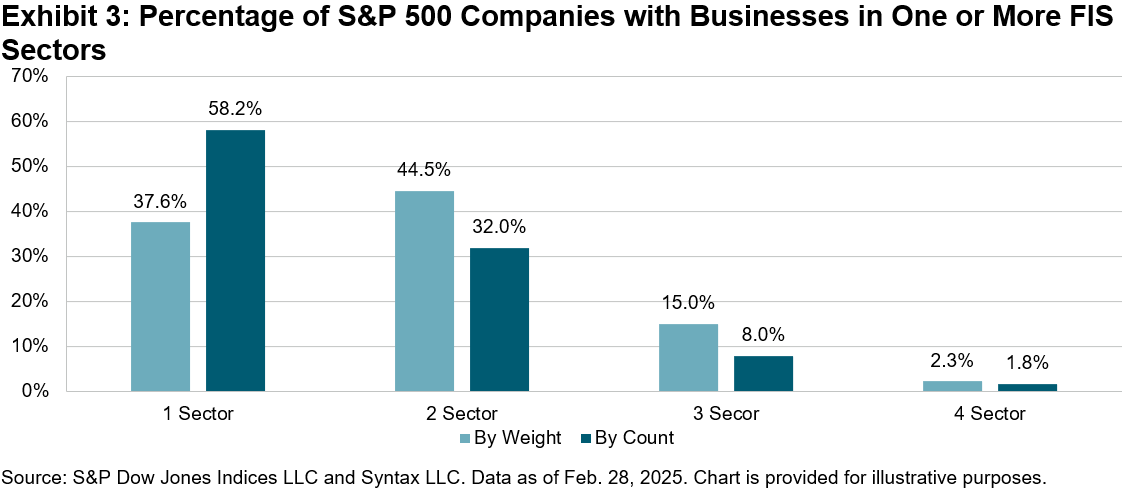
Unlike traditional classification systems that categorize companies solely by their primary business segment, the FIS classification scheme enables a single company to be represented across multiple sectors and industries. As a result, if a company generates revenue from more than one business activity, its final weight in the index is the sum of the weights from each of its business activities.

As shown in Exhibit 3, over 41% of S&P 500 companies engage in business activities across more than one FIS sectors, collectively accounting for 62% of the index’s total weight.

A Short- and Long-Term View of Performance

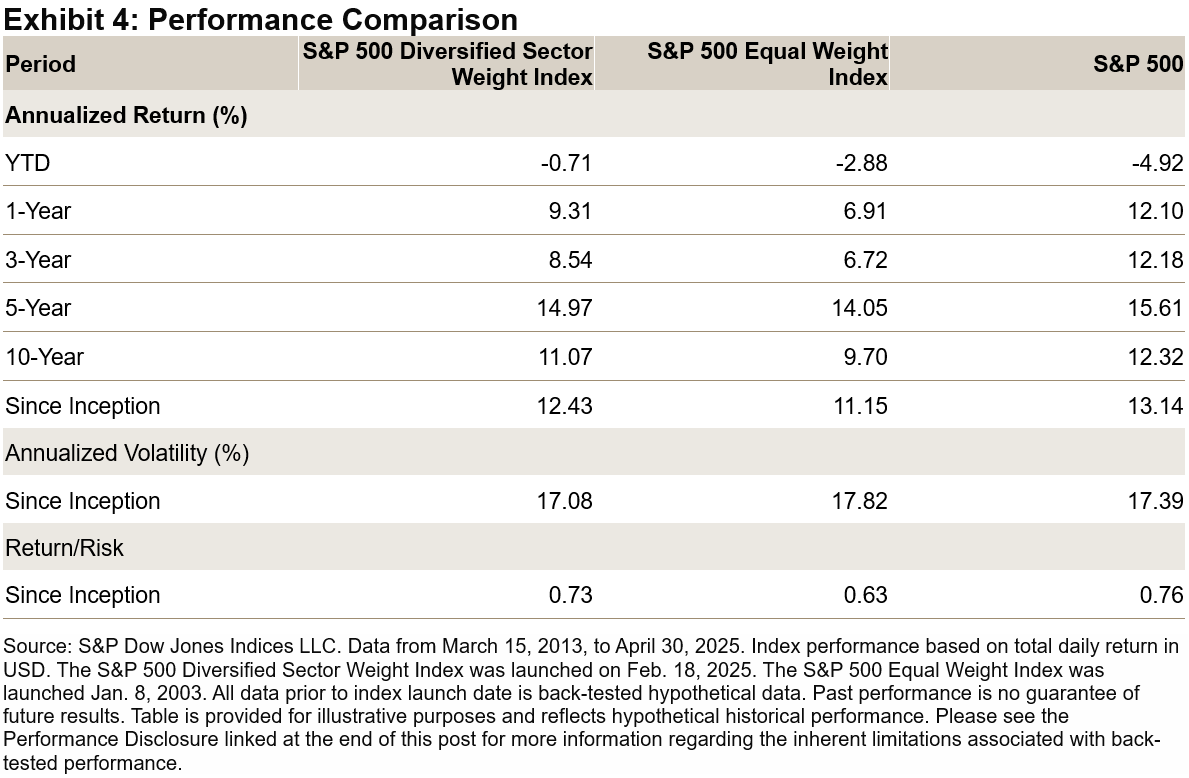
Exhibit 4 illustrates that S&P 500 Diversified Sector Weight Index has historically outperformed the S&P 500 Equal Weight Index in terms of both absolute returns and risk-adjusted returns, across both short- and long-term periods.

Characteristics of the S&P 500 Diversified Sector Weight Index

Sector Level Diversification

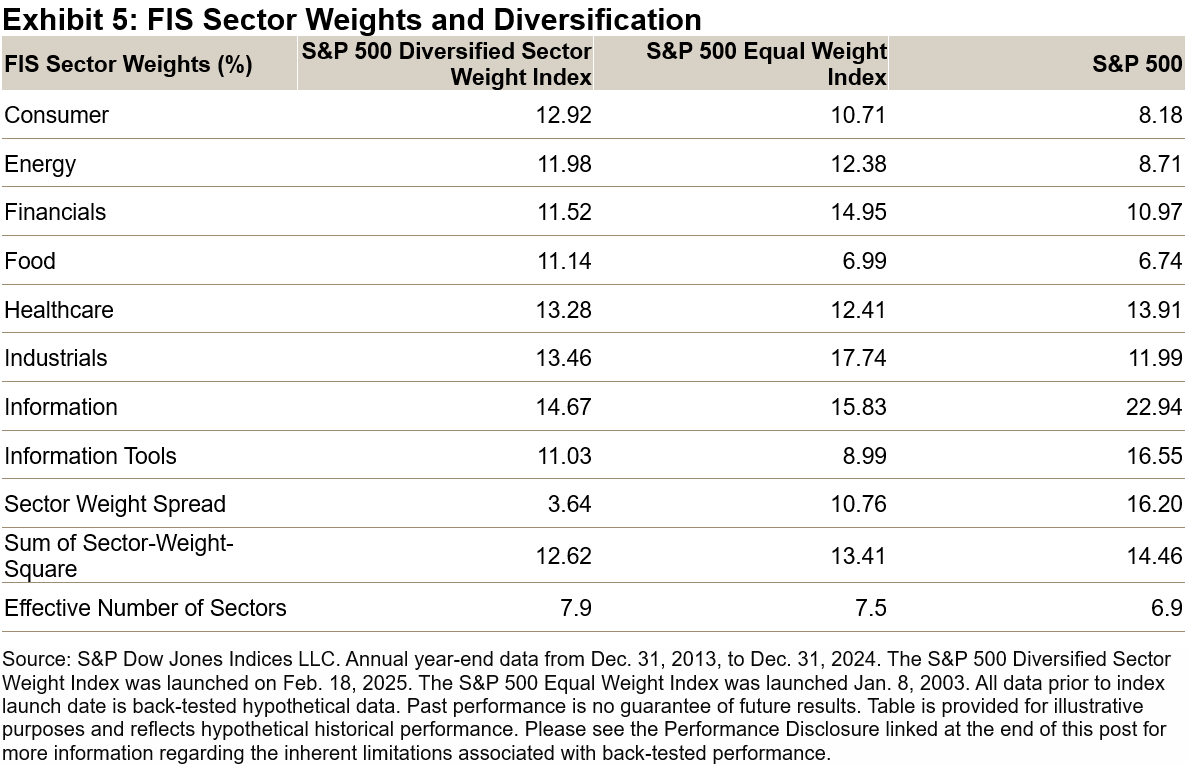
Exhibit 5 illustrates that the S&P 500 Diversified Sector Weight Index boasts the smallest sector weight spreads and a higher effective number of sectors3 compared to its counterparts.

Stock Level Diversification

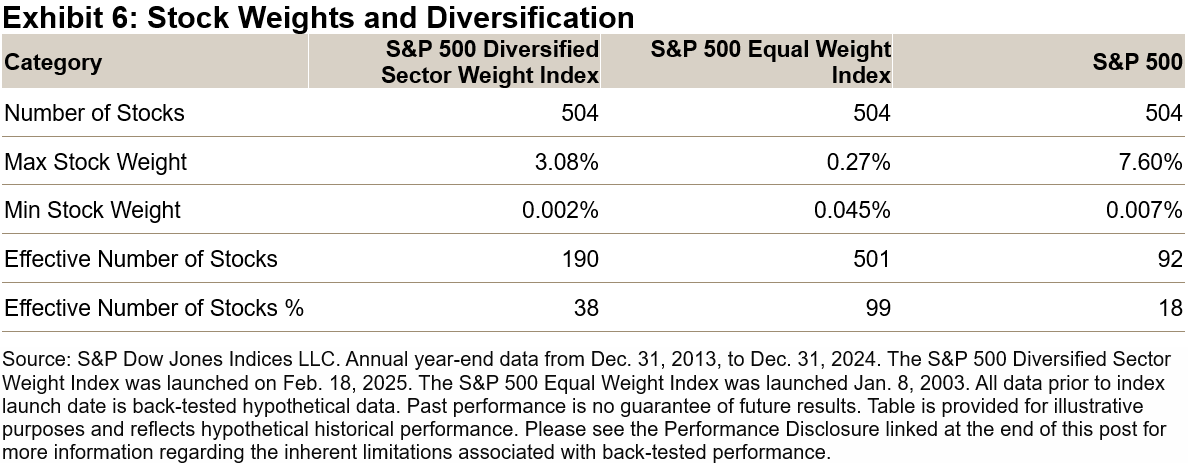
Although primarily designed to equalize sector weights and balance business risks, the S&P 500 Diversified Sector Weight Index has also historically reduced single-stock concentration. Compared to The 500, it maintained a higher effective number of stocks and featured lower maximum stock weights (see Exhibit 6).

Conclusion

The S&P 500 Diversified Sector Weight Index has had a more balanced representation of sectors and business risks within the S&P 500 universe. Furthermore, it has historically had lower single-stock concentration. Moreover, the S&P 500 Diversified Sector Weight Index has historically outperformed the S&P 500 Equal Weight Index.

1 Please refer to S&P 500 Diversified Sector Index methodology for more detailed info.

2 Within each Business Activity, each company is assigned a weight based on the product of (1) the weight of that Business Activity and (2) the trailing last 12 months’ revenue that the company derives from that Business Activity, divided by the sum of revenue that all companies derive from that Business Activity. If a company derives revenue from multiple Business Activities, a company’s final weight is the sum of the weights from each of the company’s Business Activities.

3 Effective number of sectors is defined as the inverse of the sum of squared sector weights for each index.

The posts on this blog are opinions, not advice. Please read our Disclaimers.

Direct Indexing: Customization, Transparency and Control

How can S&P DJI indices be used with direct indexing? Direct indexing is helping reshape the future of investing, enabling customized solutions that go beyond traditional passive strategies. With hundreds of thousands of our indices available for direct indexing, the possibility for customization is extensive. 

The posts on this blog are opinions, not advice. Please read our Disclaimers.

Mid-Cap Express

Contributor Image
Maya Beyhan

Global Head of Sustainability, Index Investment Strategy

S&P Dow Jones Indices

The mid-cap segment of the U.S. equity universe, as represented by the S&P MidCap 400®, has historically offered distinct views in terms of concentration, sector weights and return drivers. This prompts an exploration of whether these trends are reflected in the S&P MidCap 400 Scored & Screened Index,1 which is a broad-based, market-cap-weighted index designed to measure the performance of securities meeting sustainability criteria, while maintaining similar overall industry group weights as the S&P MidCap 400.2

Starting with concentration, Exhibit 1 illustrates the weight of the 10 largest stocks in the S&P MidCap 400 Scored & Screened Index since its launch on Jan. 11, 2021, to April 30, 2025. The average weight stood at 9.20%, slightly higher than the S&P MidCap 400’s 6.35%. However, this concentration was significantly lower than the S&P 500 Scored & Screened Index, where the 10 largest stocks accounted for an average weight of 37.82% versus 30.05% for the S&P 500®. This indicates that while the S&P MidCap 400 Scored & Screened Index showed some concentration, it still retained greater diversification compared to its large-cap counterpart.

Next, we direct our attention to sectoral weights and their relation to excess return in the S&P MidCap 400 Scored & Screened Index versus the S&P MidCap 400. Exhibit 2 summarizes the results of the Brinson3 attribution analysis for the year ending April 30, 2025. The S&P MidCap 400 Scored & Screened Index outperformed the S&P MidCap 400 by 0.32%, primarily due to stock selection effects (0.29%) as opposed to sector weighting effects (0.03%). This aligns with the index’s construction methodology, which aims to maintain overall similar industry weights to the S&P MidCap 400.

Further analysis of excess returns reveals key distinctions between the S&P MidCap 400 Scored & Screened Index and its large-cap counterpart, the S&P 500 Scored & Screened Index. Exhibit 3 summarizes the results of a similar Brinson2 attribution analysis and shows that the S&P 500 Scored & Screened Index underperformed the S&P 500 by 2.82% over the one-year period shown, primarily due to negative stock selection effects (-2.64%). Sector contributions varied significantly: the performance of the S&P MidCap 400 Scored & Screened Index was boosted by the Health Care (0.86%) sector, while Industrials (-0.64%) contributed negatively to performance (see Exhibit 2). Conversely, the S&P 500 Scored & Screened Index faced significant negative selection effects in Information Technology (-1.11%) and Communication Services (-1.09%), with only a minor negative stock selection effect from Health Care (-0.03%; see Exhibit 3).

In summary, past results underscore the distinct differences in concentration, sector exposures and return drivers between the S&P MidCap 400 Scored & Screened Index and the S&P 500 Scored & Screened Index, reflecting the historical trends in their respective broad market benchmarks. Given these insights, the S&P MidCap 400 Scored & Screened Index shows its potential as a diversified benchmark for the mid-cap U.S. equity universe while pursuing sustainability criteria.

1 Formerly known as the S&P MidCap 400 ESG Index.

2 See the S&P Scored & Screened Index Series Methodology.

3 For more information on this widely used performance attribution model, see Brinson, Gary P., Hood, L. Randolph, Beebower, Gilbert L., “Determinants of Portfolio Performance,” Financial Analysts Journal, July-August, 1986.

The posts on this blog are opinions, not advice. Please read our Disclaimers.

A New Approach to S&P Aristocrats: Meet the S&P Quality FCF Aristocrats Indices

How does at least 10 consecutive years of free cash flow growth influence risk/return? Look inside the S&P Quality FCF Aristocrats Indices and see how a focus on consistent and efficient free cash flow generation has historically led to improved fundamentals, defensive characteristics and outperformance relative to the benchmark.

The posts on this blog are opinions, not advice. Please read our Disclaimers.

SPIVA Around the World

Contributor Image
Nick Didio

Quantitative Analyst, Index Investment Strategy

S&P Dow Jones Indices

S&P DJI’s SPIVA (S&P Indices versus Active) Scorecards have been measuring active funds’ performance against appropriate benchmarks for over 20 years. With the release of the SPIVA Asia Ex-Japan Year-End 2024 Scorecard, our latest regional addition, all 11 regional SPIVA Scorecards tracking fund performance in 2024 are now available.

2024 was another challenging year for active managers, with a cross-category, fund-weighted average of 71% of equity funds listed across all regions in Exhibit 1 underperforming their respective benchmarks. Exhibit 1 shows the underperformance rates by region for selected equity fund categories across 1-, 3- and 5-year horizons. Note that majority outperformance in 2024 was only achieved by active managers in Mexico, South Africa and the MENA region.

U.S. dominance prevailed versus the rest of the world, with the S&P 500® up 25.0% in 2024, outperforming the S&P World Ex-U.S. Index by 19.2%. Large-cap dominance meant a higher hurdle for active managers to climb, with only 28% of constituents outperforming the S&P 500. Given the increasing concentration and outperformance of the largest stocks in 2024, it is unsurprising that 65% of large cap managers, who may often be underweight the largest stocks,1 underperformed The 500™.

The challenge of stock selection was not a phenomenon unique to the U.S. in 2024—it was also observed globally, as 59% of stocks on average failed to beat their respective benchmarks globally (see Exhibit 2). Chile, Mexico and South Africa were bright spots, with only 39%, 47% and 52% of stocks underperforming their respective benchmarks, coinciding with majority outperformance rates in two of the three regions: Mexico and South Africa.

While generating outperformance was tough for stock pickers, fixed income managers performed relatively better than their equity peers, with only 48%2 of funds listed across all regions in Exhibit 3 underperforming their respective benchmarks. In the U.K., German and U.S. bond markets, the beginning of 2024 saw heightened interest rates and an inverted yield curve that disinverted throughout the year. Bond managers who shortened their duration exposures may have been the benefactors of such an environment. Exhibit 3 shows underperformance rates by region for selected fixed income fund categories across 1-, 3- and 5-year horizons.

Tilting toward riskier credit segments was a potential tailwind for bond managers in regions like the U.S., with a 7% excess return between the iBoxx $ Liquid High Yield Index and iBoxx $ Liquid Investment Grade Index. Only 30% of Investment-Grade funds underperformed the iBoxx $ Liquid Investment Grade Index compared to 66% of High Yield funds versus the iBoxx $ Liquid High Yield Index. European credit managers also fared well, with majority outperformance rates for euro-denominated corporate and high yield funds.

Despite strong relative performance in 2024 from most fixed income fund categories, the long-term trends of underperformance remained. Exhibit 4 shows that, on average, 80%3 of funds in categories included in Exhibit 3 underperformed their respective benchmarks over the 10-year horizon. Only one fixed income category, the South Africa Short-Term Bond benchmarked against the STeFi Composite, recorded majority outperformance over the past 10 years.

While active manager performance varies across regions and across asset classes, one trend remained true: outperforming the benchmark is difficult, especially over the long term. Find out more from our SPIVA Library.

1 Chan, Fei Mei and Lazzara, Craig, “Degrees of Difficulty”, S&P Dow Jones Indices, January 2022

2, 3 Cross-category, fund-weighted average

The posts on this blog are opinions, not advice. Please read our Disclaimers.