


How can S&P DJI indices be used with direct indexing? Direct indexing is helping reshape the future of investing, enabling customized solutions that go beyond traditional passive strategies. With hundreds of thousands of our indices available for direct indexing, the possibility for customization is extensive.
The posts on this blog are opinions, not advice. Please read our Disclaimers.Direct Indexing: Customization, Transparency and Control
Mid-Cap Express
A New Approach to S&P Aristocrats: Meet the S&P Quality FCF Aristocrats Indices
SPIVA Around the World
The Market Measure: May 2025
Direct Indexing: Customization, Transparency and Control
Mid-Cap Express

The mid-cap segment of the U.S. equity universe, as represented by the S&P MidCap 400®, has historically offered distinct views in terms of concentration, sector weights and return drivers. This prompts an exploration of whether these trends are reflected in the S&P MidCap 400 Scored & Screened Index,1 which is a broad-based, market-cap-weighted index designed to measure the performance of securities meeting sustainability criteria, while maintaining similar overall industry group weights as the S&P MidCap 400.2
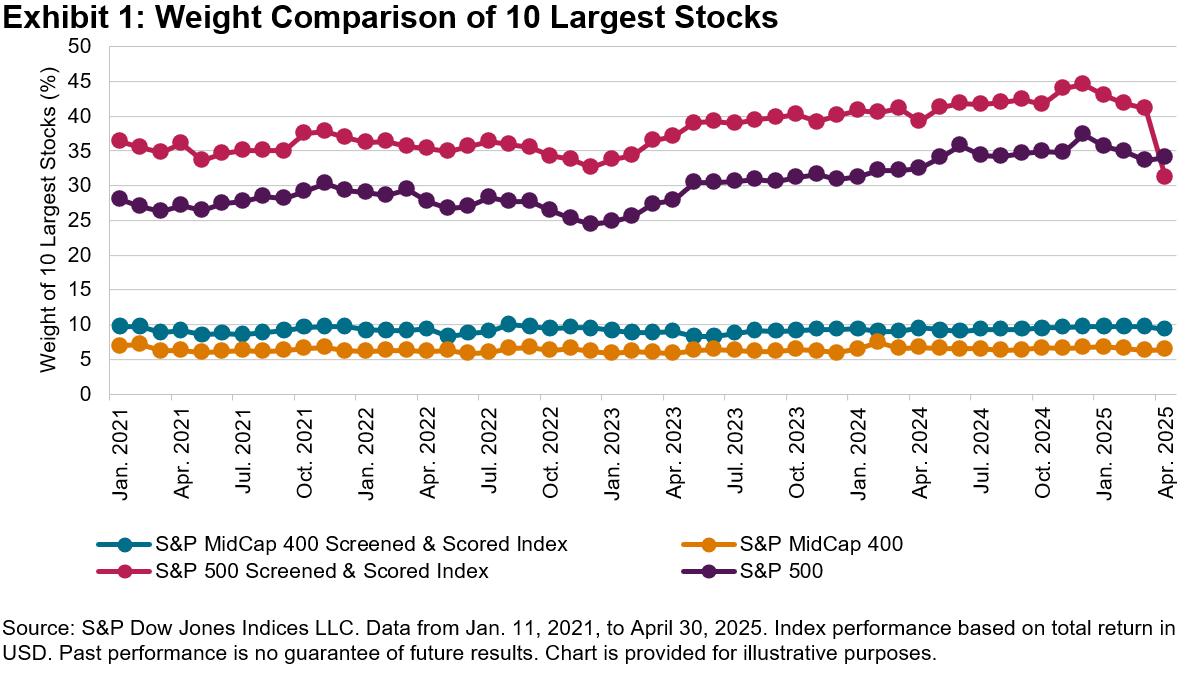
Starting with concentration, Exhibit 1 illustrates the weight of the 10 largest stocks in the S&P MidCap 400 Scored & Screened Index since its launch on Jan. 11, 2021, to April 30, 2025. The average weight stood at 9.20%, slightly higher than the S&P MidCap 400’s 6.35%. However, this concentration was significantly lower than the S&P 500 Scored & Screened Index, where the 10 largest stocks accounted for an average weight of 37.82% versus 30.05% for the S&P 500®. This indicates that while the S&P MidCap 400 Scored & Screened Index showed some concentration, it still retained greater diversification compared to its large-cap counterpart.
Next, we direct our attention to sectoral weights and their relation to excess return in the S&P MidCap 400 Scored & Screened Index versus the S&P MidCap 400. Exhibit 2 summarizes the results of the Brinson3 attribution analysis for the year ending April 30, 2025. The S&P MidCap 400 Scored & Screened Index outperformed the S&P MidCap 400 by 0.32%, primarily due to stock selection effects (0.29%) as opposed to sector weighting effects (0.03%). This aligns with the index’s construction methodology, which aims to maintain overall similar industry weights to the S&P MidCap 400.
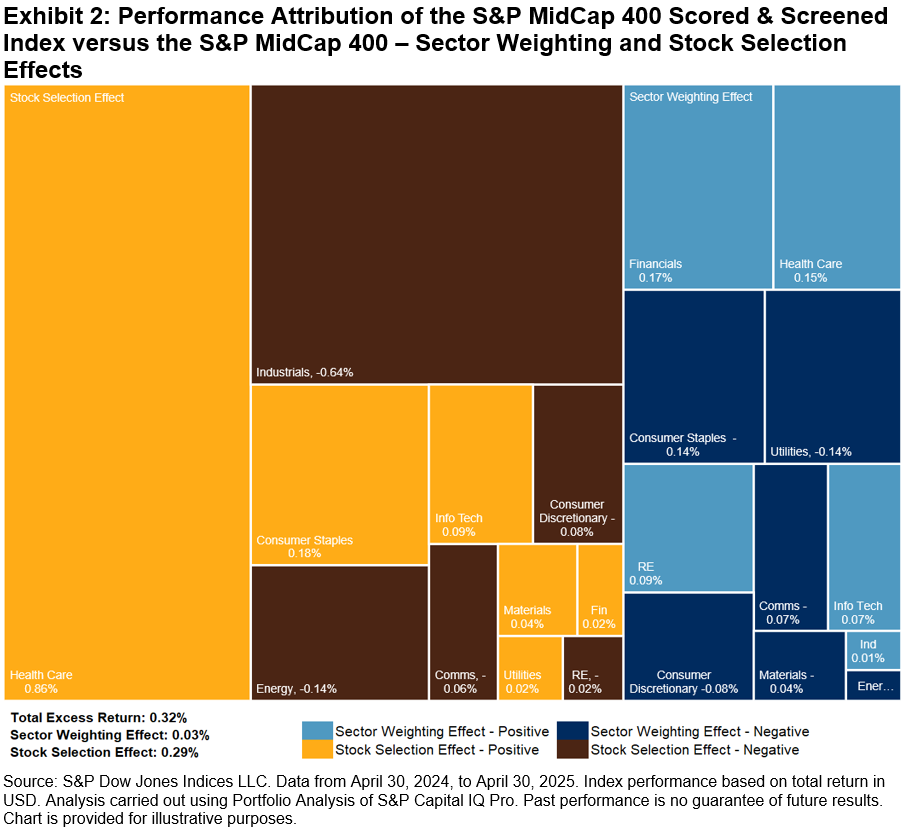
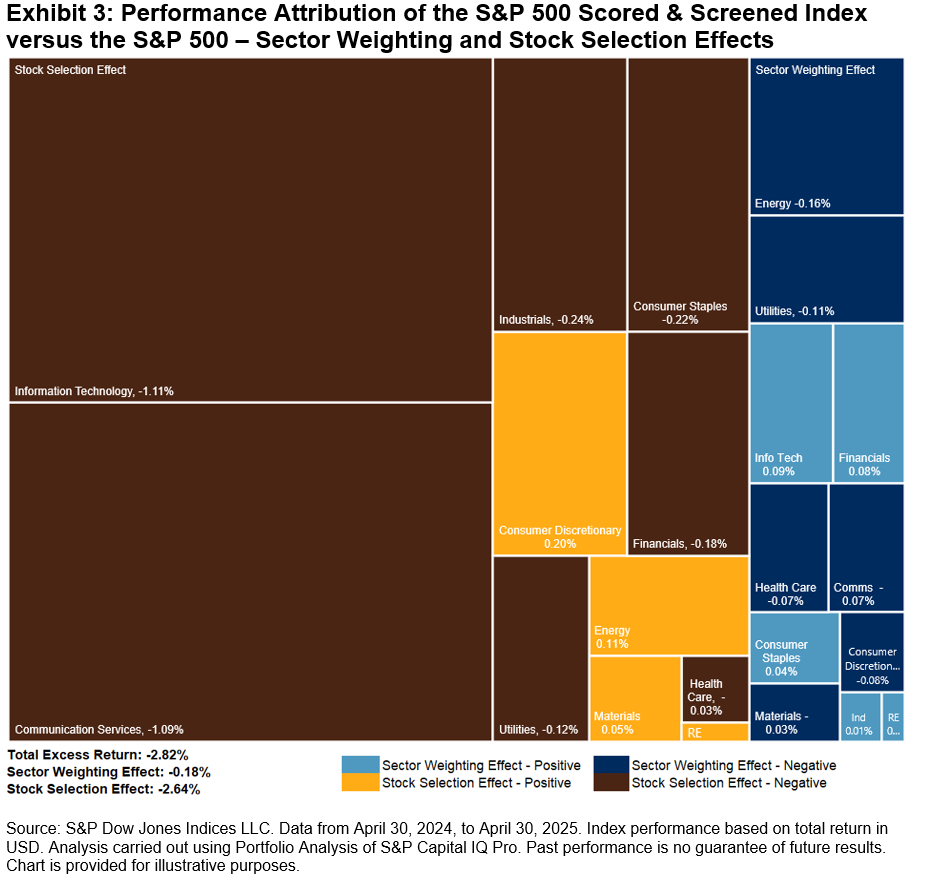
Further analysis of excess returns reveals key distinctions between the S&P MidCap 400 Scored & Screened Index and its large-cap counterpart, the S&P 500 Scored & Screened Index. Exhibit 3 summarizes the results of a similar Brinson2 attribution analysis and shows that the S&P 500 Scored & Screened Index underperformed the S&P 500 by 2.82% over the one-year period shown, primarily due to negative stock selection effects (-2.64%). Sector contributions varied significantly: the performance of the S&P MidCap 400 Scored & Screened Index was boosted by the Health Care (0.86%) sector, while Industrials (-0.64%) contributed negatively to performance (see Exhibit 2). Conversely, the S&P 500 Scored & Screened Index faced significant negative selection effects in Information Technology (-1.11%) and Communication Services (-1.09%), with only a minor negative stock selection effect from Health Care (-0.03%; see Exhibit 3).
In summary, past results underscore the distinct differences in concentration, sector exposures and return drivers between the S&P MidCap 400 Scored & Screened Index and the S&P 500 Scored & Screened Index, reflecting the historical trends in their respective broad market benchmarks. Given these insights, the S&P MidCap 400 Scored & Screened Index shows its potential as a diversified benchmark for the mid-cap U.S. equity universe while pursuing sustainability criteria.
1 Formerly known as the S&P MidCap 400 ESG Index.
2 See the S&P Scored & Screened Index Series Methodology.
3 For more information on this widely used performance attribution model, see Brinson, Gary P., Hood, L. Randolph, Beebower, Gilbert L., “Determinants of Portfolio Performance,” Financial Analysts Journal, July-August, 1986.
The posts on this blog are opinions, not advice. Please read our Disclaimers.A New Approach to S&P Aristocrats: Meet the S&P Quality FCF Aristocrats Indices
How does at least 10 consecutive years of free cash flow growth influence risk/return? Look inside the S&P Quality FCF Aristocrats Indices and see how a focus on consistent and efficient free cash flow generation has historically led to improved fundamentals, defensive characteristics and outperformance relative to the benchmark.
The posts on this blog are opinions, not advice. Please read our Disclaimers.SPIVA Around the World

S&P DJI’s SPIVA (S&P Indices versus Active) Scorecards have been measuring active funds’ performance against appropriate benchmarks for over 20 years. With the release of the SPIVA Asia Ex-Japan Year-End 2024 Scorecard, our latest regional addition, all 11 regional SPIVA Scorecards tracking fund performance in 2024 are now available.
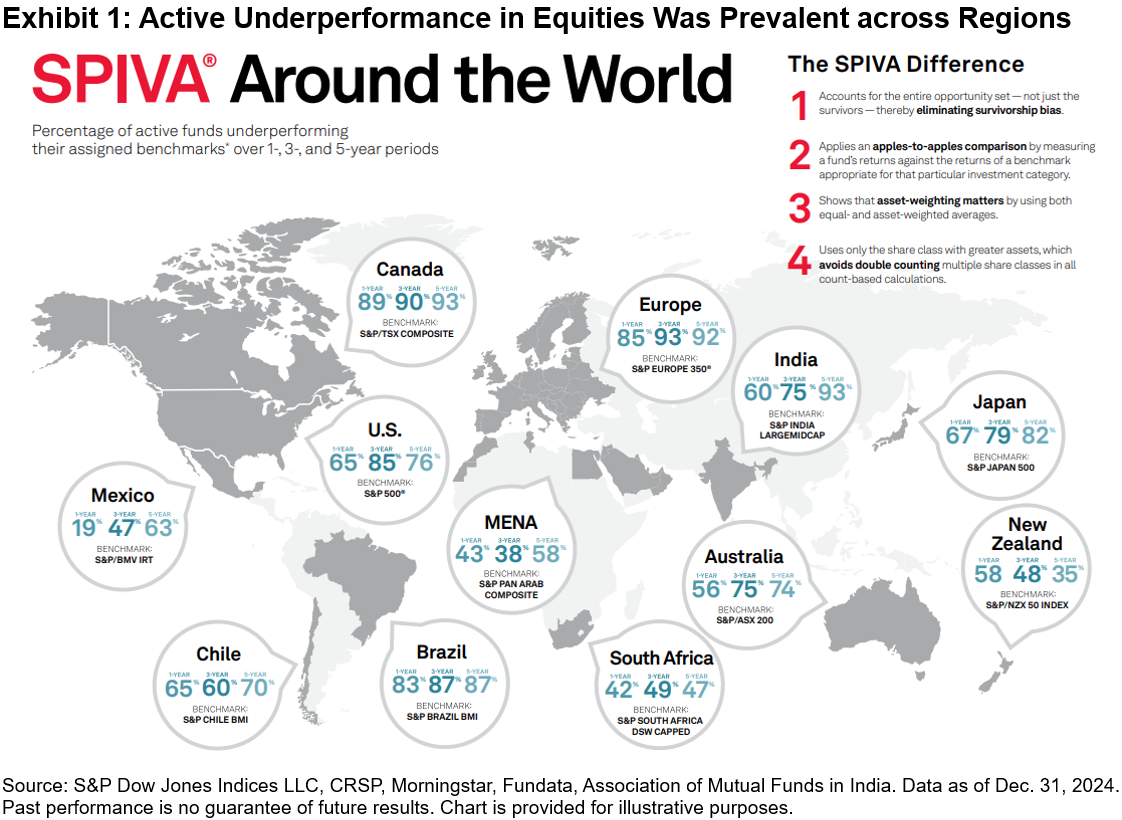
2024 was another challenging year for active managers, with a cross-category, fund-weighted average of 71% of equity funds listed across all regions in Exhibit 1 underperforming their respective benchmarks. Exhibit 1 shows the underperformance rates by region for selected equity fund categories across 1-, 3- and 5-year horizons. Note that majority outperformance in 2024 was only achieved by active managers in Mexico, South Africa and the MENA region.
U.S. dominance prevailed versus the rest of the world, with the S&P 500® up 25.0% in 2024, outperforming the S&P World Ex-U.S. Index by 19.2%. Large-cap dominance meant a higher hurdle for active managers to climb, with only 28% of constituents outperforming the S&P 500. Given the increasing concentration and outperformance of the largest stocks in 2024, it is unsurprising that 65% of large cap managers, who may often be underweight the largest stocks,1 underperformed The 500™.
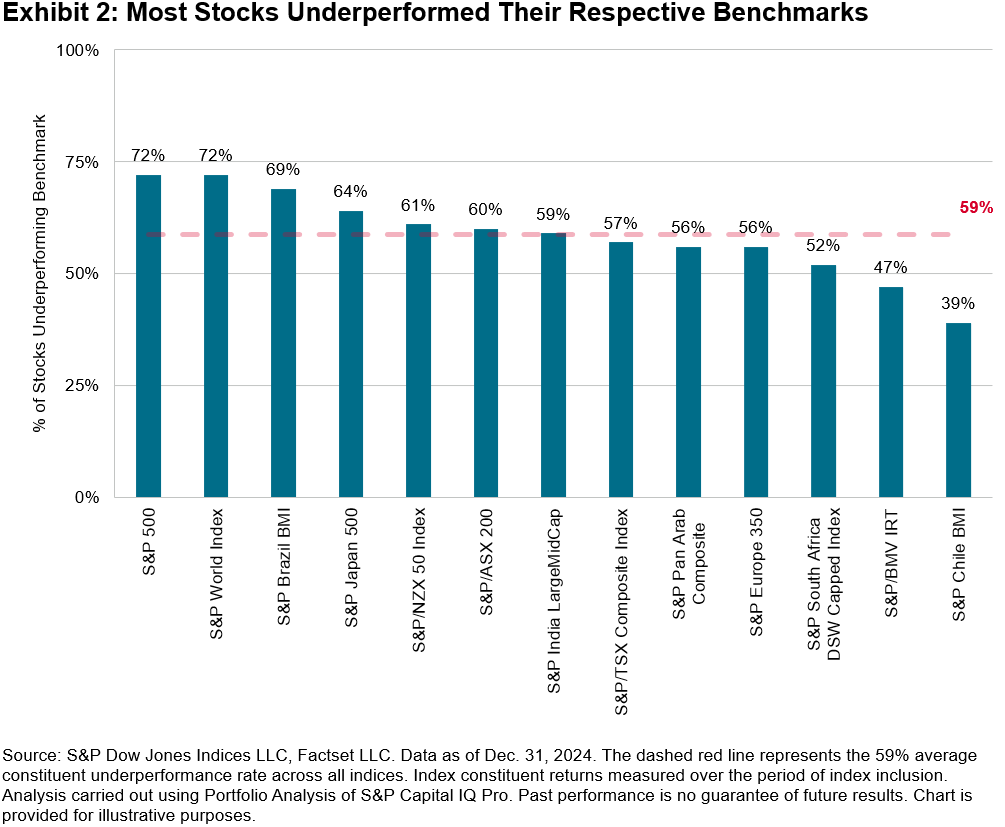
The challenge of stock selection was not a phenomenon unique to the U.S. in 2024—it was also observed globally, as 59% of stocks on average failed to beat their respective benchmarks globally (see Exhibit 2). Chile, Mexico and South Africa were bright spots, with only 39%, 47% and 52% of stocks underperforming their respective benchmarks, coinciding with majority outperformance rates in two of the three regions: Mexico and South Africa.
While generating outperformance was tough for stock pickers, fixed income managers performed relatively better than their equity peers, with only 48%2 of funds listed across all regions in Exhibit 3 underperforming their respective benchmarks. In the U.K., German and U.S. bond markets, the beginning of 2024 saw heightened interest rates and an inverted yield curve that disinverted throughout the year. Bond managers who shortened their duration exposures may have been the benefactors of such an environment. Exhibit 3 shows underperformance rates by region for selected fixed income fund categories across 1-, 3- and 5-year horizons.
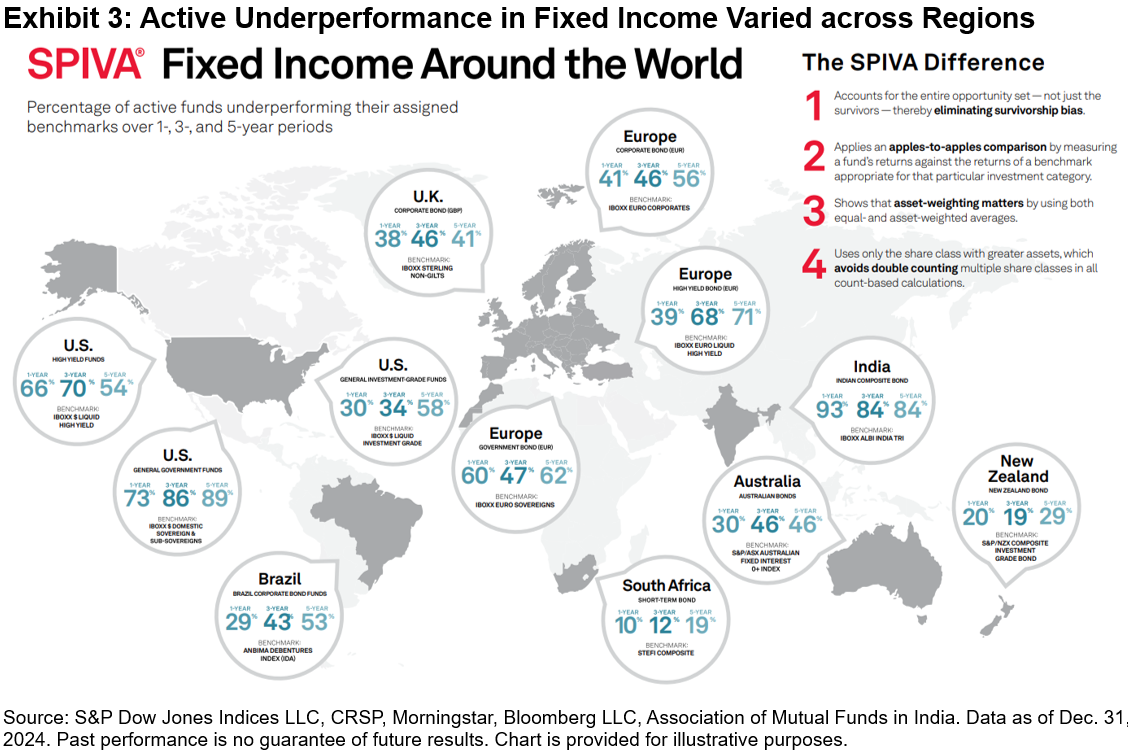
Tilting toward riskier credit segments was a potential tailwind for bond managers in regions like the U.S., with a 7% excess return between the iBoxx $ Liquid High Yield Index and iBoxx $ Liquid Investment Grade Index. Only 30% of Investment-Grade funds underperformed the iBoxx $ Liquid Investment Grade Index compared to 66% of High Yield funds versus the iBoxx $ Liquid High Yield Index. European credit managers also fared well, with majority outperformance rates for euro-denominated corporate and high yield funds.
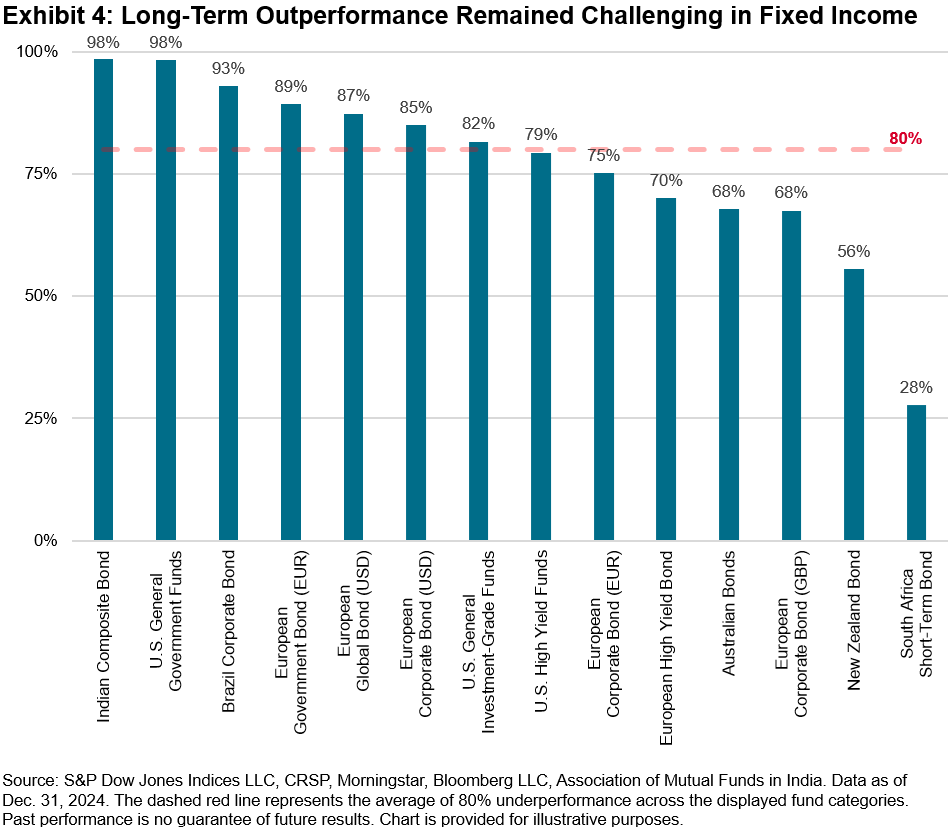
Despite strong relative performance in 2024 from most fixed income fund categories, the long-term trends of underperformance remained. Exhibit 4 shows that, on average, 80%3 of funds in categories included in Exhibit 3 underperformed their respective benchmarks over the 10-year horizon. Only one fixed income category, the South Africa Short-Term Bond benchmarked against the STeFi Composite, recorded majority outperformance over the past 10 years.
While active manager performance varies across regions and across asset classes, one trend remained true: outperforming the benchmark is difficult, especially over the long term. Find out more from our SPIVA Library.
1 Chan, Fei Mei and Lazzara, Craig, “Degrees of Difficulty”, S&P Dow Jones Indices, January 2022
2, 3 Cross-category, fund-weighted average
The posts on this blog are opinions, not advice. Please read our Disclaimers.The Market Measure: May 2025
Explore whether the S&P 500’s positive performance in 2025 may signal it’s time to look at equities elsewhere. We review recent U.S. and global market dynamics, highlight the long-term success of legends like Warren Buffett and the S&P 500 Dividend Aristocrats and examine the challenge of consistently outperforming the market. How many active funds do you think stayed above average over the past five years? Stay tuned to find out!
The posts on this blog are opinions, not advice. Please read our Disclaimers.