


How are financial advisors putting SPIVA data to work to help clients achieve their goals? S&P DJI’s Sue Lee joins Thriving Wealth’s John Cachia to dive into the most recent SPIVA Australia Scorecard and its practical applications for market participants.
The posts on this blog are opinions, not advice. Please read our Disclaimers.Leveraging SPIVA Insights: A Practitioner's Guide
Fundamental Weighting for Long-Term Outperformance and Enhanced Diversification: The S&P 500 Revenue-Weighted Index
A Diversified Strategy for the 21st Century
Customizing Bitcoin Exposure to Mitigate Risk Systematically
Introducing the S&P 500 Market Leaders Index
Leveraging SPIVA Insights: A Practitioner's Guide
Fundamental Weighting for Long-Term Outperformance and Enhanced Diversification: The S&P 500 Revenue-Weighted Index

Wenli Bill Hao
Director, Factors and Dividends Indices, Product Management and Development
S&P Dow Jones Indices
By weighting the constituents of the S&P 500® based on top-line revenue, the S&P 500 Revenue-Weighted Index offers an alternative to traditional benchmarks that are weighted by float market cap (FMC). This approach aims to better reflect the fundamental strength of each company, while offering better valuations and enhanced diversification. In this blog, we will analyze its methodology, examine short- and long-term performance, explore style tilts and assess diversification.
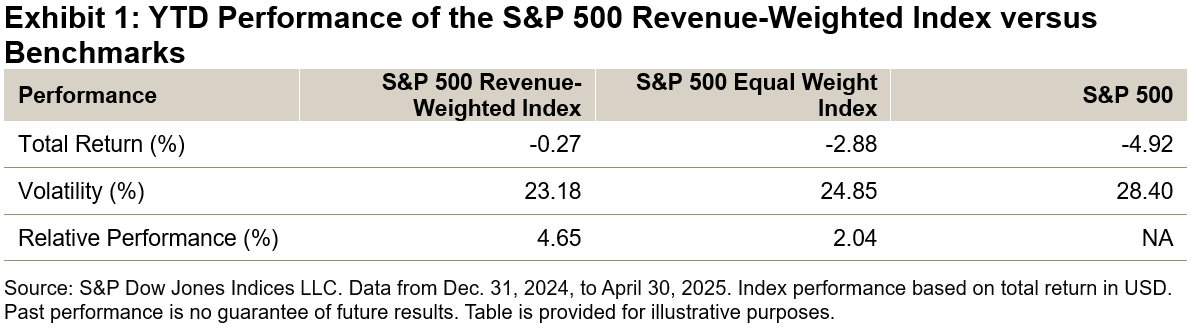
Year-to-Date Performance
So far this year, the S&P 500 Revenue-Weighted Index has outperformed The 500™ by more than 4.5% and surpassed the S&P 500 Equal Weight Index by more than 2.0% (see Exhibit 1).
Long-Term Performance
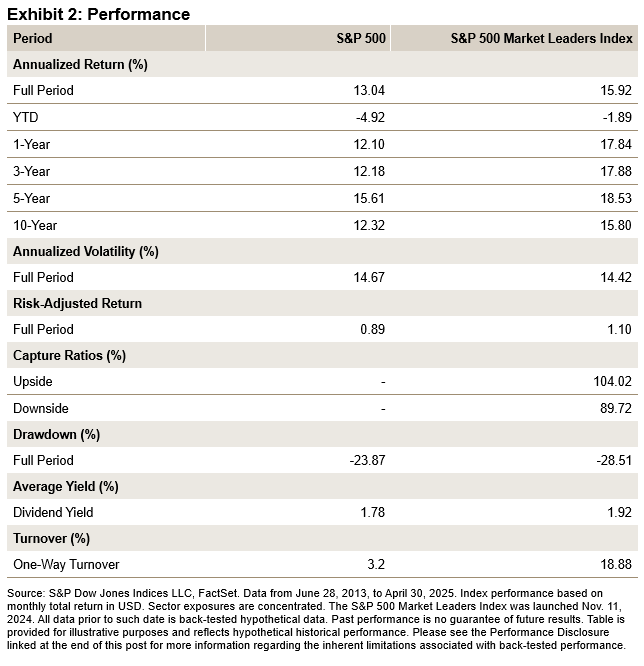
This recent outperformance is consistent with its historical track record. As shown in Exhibit 2, the S&P 500 Revenue-Weighted Index has outperformed both the S&P 500 and S&P 500 Equal Weight Index in terms of total return and risk-adjusted return over the long term, all while maintaining consistently lower volatility.
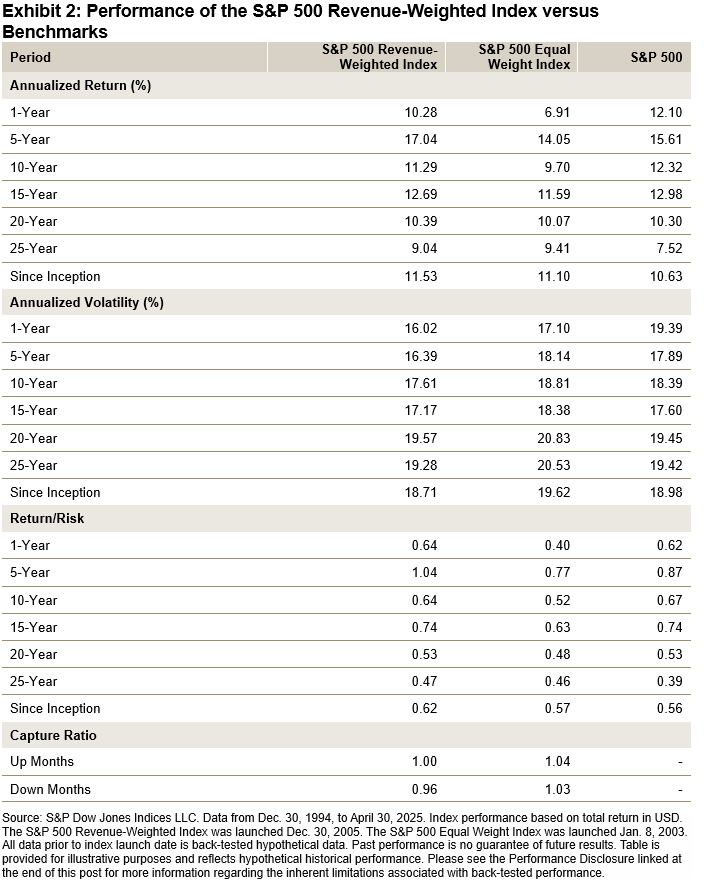
Upside Participation and Downside Protection
The historical capture ratios (Exhibit 2) show that the S&P 500 Revenue-Weighted Index has typically participated one-for-one in up markets,1 while delivering significant outperformance during down markets. This aligns with the design of revenue-weighted indices, which tend to provide a closer reflection of the broader economy and avoid overweighting overvalued stocks.
Methodology
The S&P 500 Revenue-Weighted Index assigns weights to its constituents proportional to their revenues from the past four quarters. To provide broader coverage and reduce concentration risk, individual constituent weights are capped at 5%, and the index rebalances quarterly in March, June, September and December.
Weighting by revenue may better reflect the broader economy, as revenue is directly tied to economic activity. Additionally, revenue serves as a direct indicator of a company’s ability to generate income and is less susceptible to accounting manipulations.
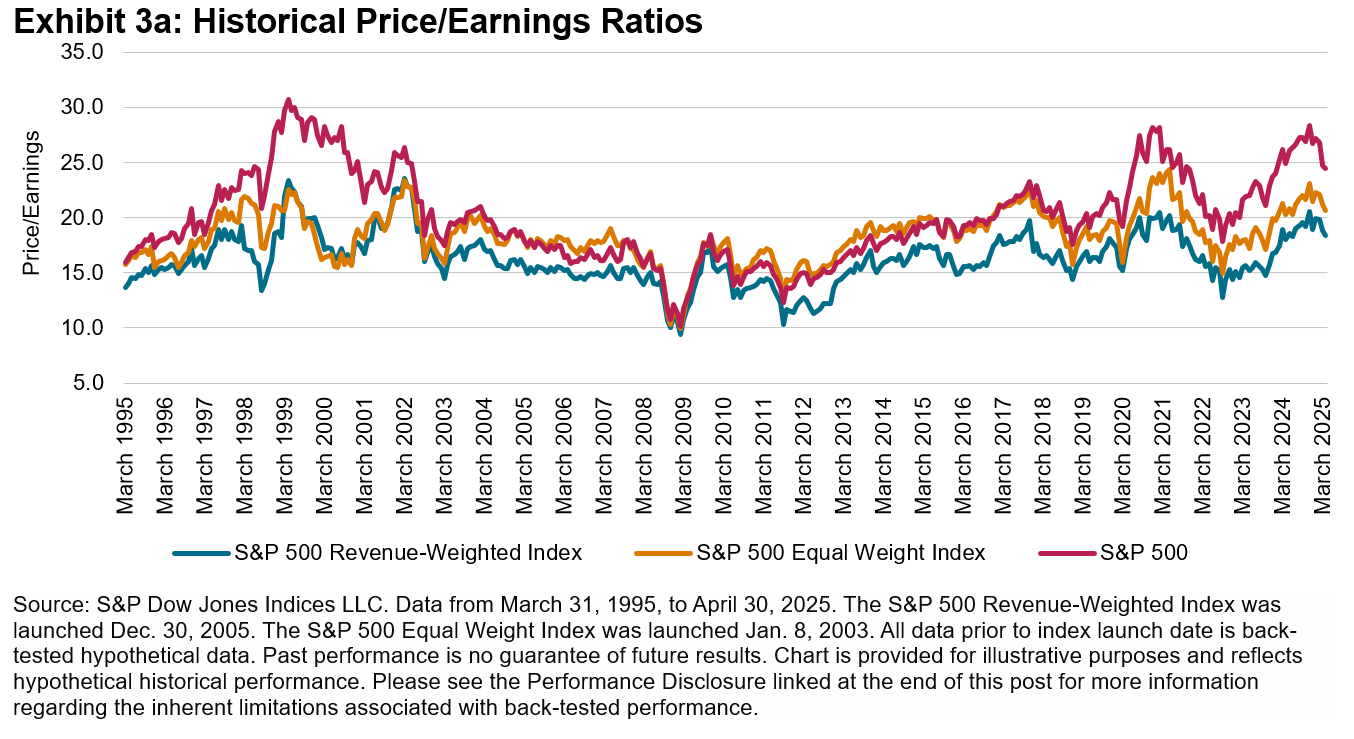
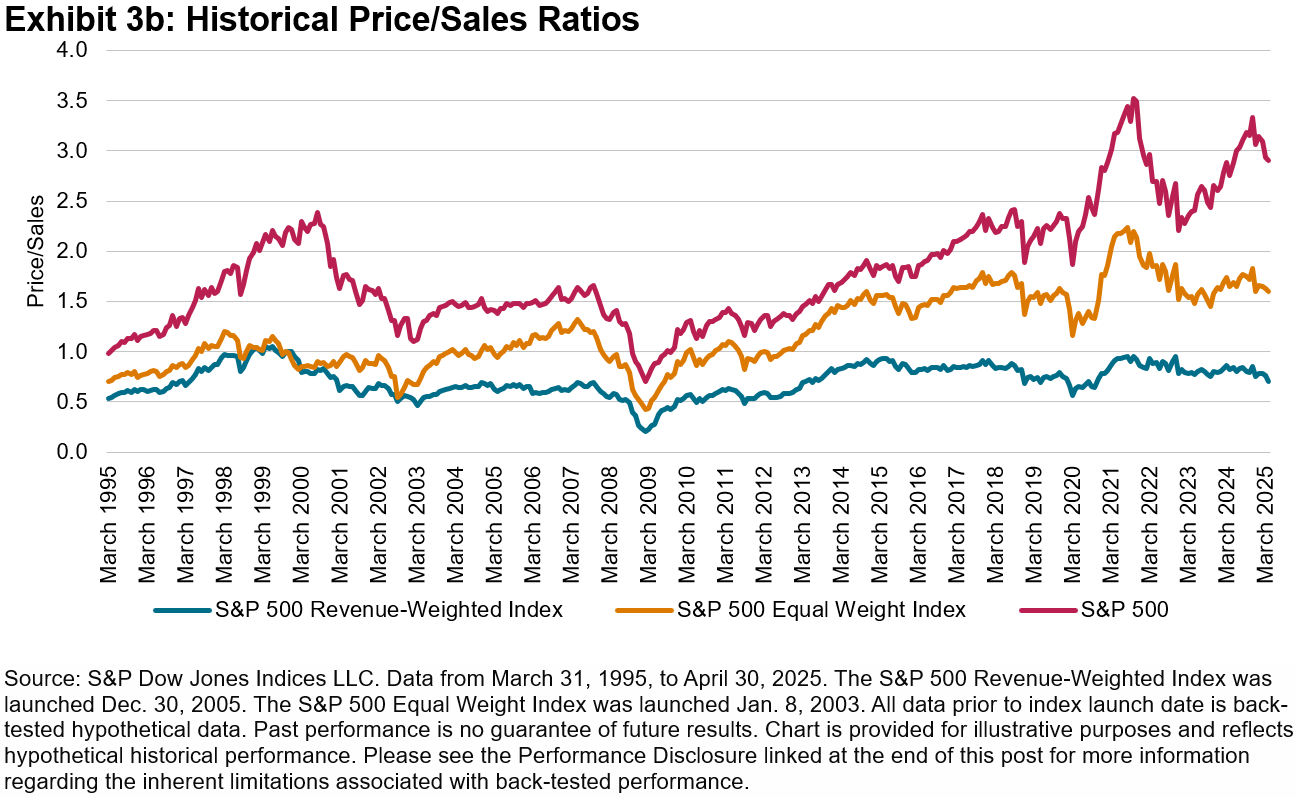
Valuations
As illustrated in Exhibits 3a and 3b, the S&P 500 Revenue-Weighted Index generally exhibited better valuations than the S&P 500 Equal Weighted Index and The 500.2
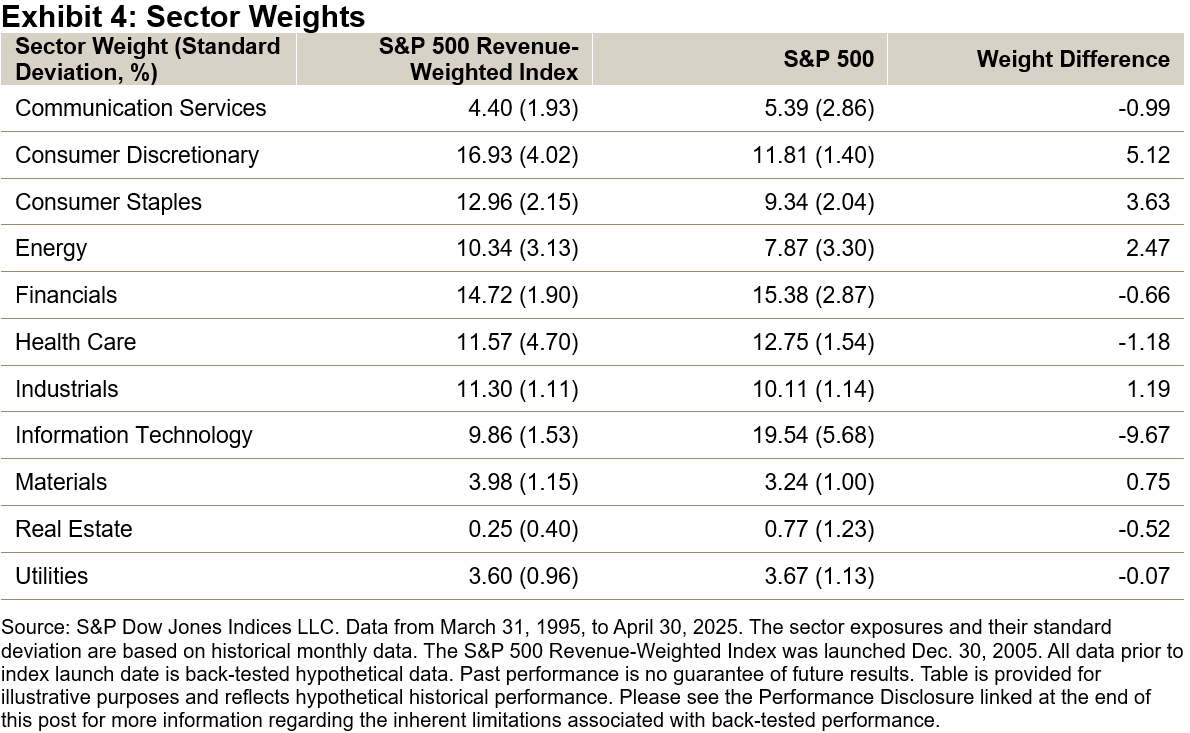
Sector Weights
As shown in Exhibit 4, revenue weighting has often resulted in more stable sector weights (as measured by lower standard deviation) compared to the weighting scheme driven by price, as revenues tend to be relatively stable. Moreover, the S&P 500 Revenue-Weighted Index held the largest weight in Consumer Discretionary, while Information Technology was the largest sector in The 500.
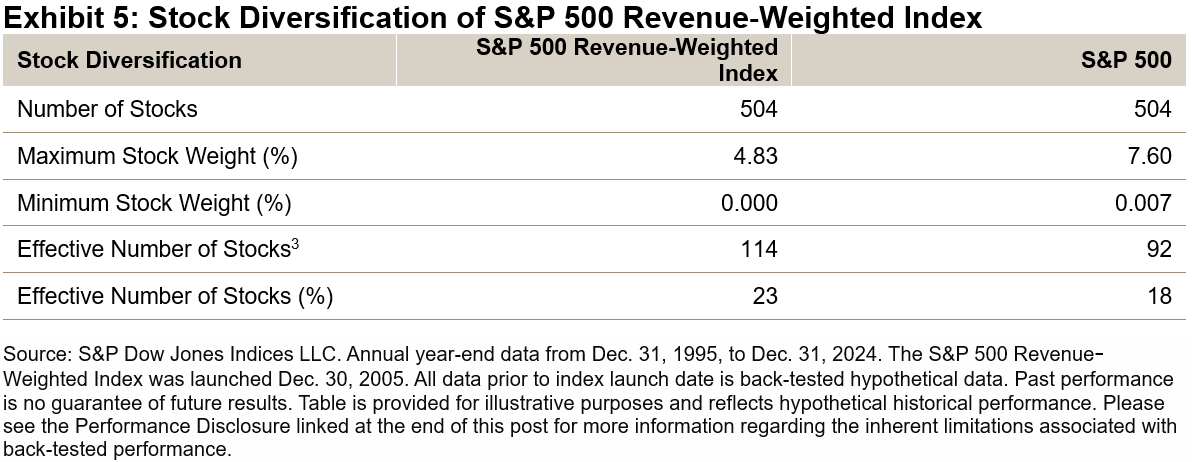
Diversification
When examining individual stocks, the S&P 500 Revenue-Weighted Index demonstrated greater diversification than The 500, featuring a lower max stock weight and a higher effective number of stocks (see Exhibit 5).
Conclusion
The S&P 500 Revenue-Weight Index presents an alternative to traditional market cap-weighted benchmarks, emphasizing fundamentally strong companies based on revenue. It has consistently delivered robust total returns and risk-adjusted outperformance over both the short and long term. In comparison to FMC-weighted benchmarks, it has historically offered greater value tilt, reduced concentration risk and more stable sector weights.
1 The market is defined as the monthly performance of the underlying benchmark (i.e., S&P 500) from Dec. 31, 1994, to March 31, 2025.
2 Historic price/book ratios show a similar trend to price/earnings and price/sales ratios.
3 Effective number of stocks is the inverse of the Herfindahl-Hirschman Index (HHI), which is the sum of squared stock weights for each index in each period.
The posts on this blog are opinions, not advice. Please read our Disclaimers.A Diversified Strategy for the 21st Century
How are multi-asset indices with built-in adaptability and risk mitigation helping market participants? Meet the S&P Global Diversified 7.5% Index, a multi-asset index designed for today’s markets, reflecting diversification across regions and asset classes and incorporating dynamic signals to help mitigate market uncertainty.
The posts on this blog are opinions, not advice. Please read our Disclaimers.Customizing Bitcoin Exposure to Mitigate Risk Systematically
Bitcoin and lower volatility may seem like opposites, but could it be time to rethink that perspective? S&P DJI’s Michael Mell and Cyber Hornet ETFs’ Mike Willis look inside a blended custom index with 75% weighted to the S&P 500 and 25% weighted to Bitcoin futures as a unique approach to risk management.
The posts on this blog are opinions, not advice. Please read our Disclaimers.
Introducing the S&P 500 Market Leaders Index

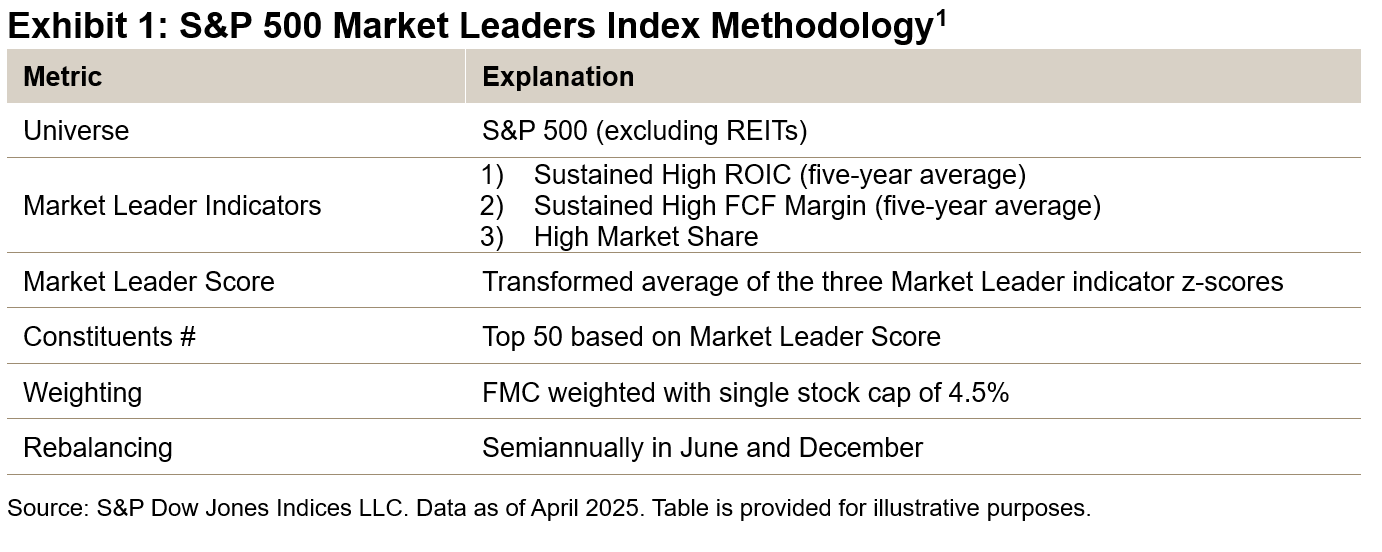
The S&P 500® Market Leaders Index is designed to track companies within the S&P 500 that hold significant market share and sustainable competitive advantages. Unlike the broader S&P 500, this index zeroes in on companies that consistently outperform their peers in terms of return on invested capital (ROIC), free cash flow (FCF) generation and substantial market presence. In this blog, we will delve into how this index is constructed, examine its back-tested performance and highlight its unique characteristics.
Methodology Overview
The S&P 500 Market Leaders Index selects companies using a Market Leader Score based on the average of three key metrics.
- High Market Share: This metric may indicate competitive advantages like economies of scale, network effects or strong brand power. Companies with high market share often have better pricing power and higher returns.
- Sustained High ROIC: Calculated as the five-year average of net income divided by total equity plus total debt, this metric assesses profitability and reflects a company’s efficiency in capital utilization. Market leaders often exhibit stronger ROIC due to their dominant market positions.
- Consistent High FCF Margin: Companies that maintain consistently high FCF margins over five years, combined with high ROIC, tend to be able to effectively redeploy cash flow, helping them maintain market share.
The top 50 companies ranked by Market Leader Score are included in the index and are weighted by float-adjusted market capitalization (FMC).
Historical Performance Characteristics
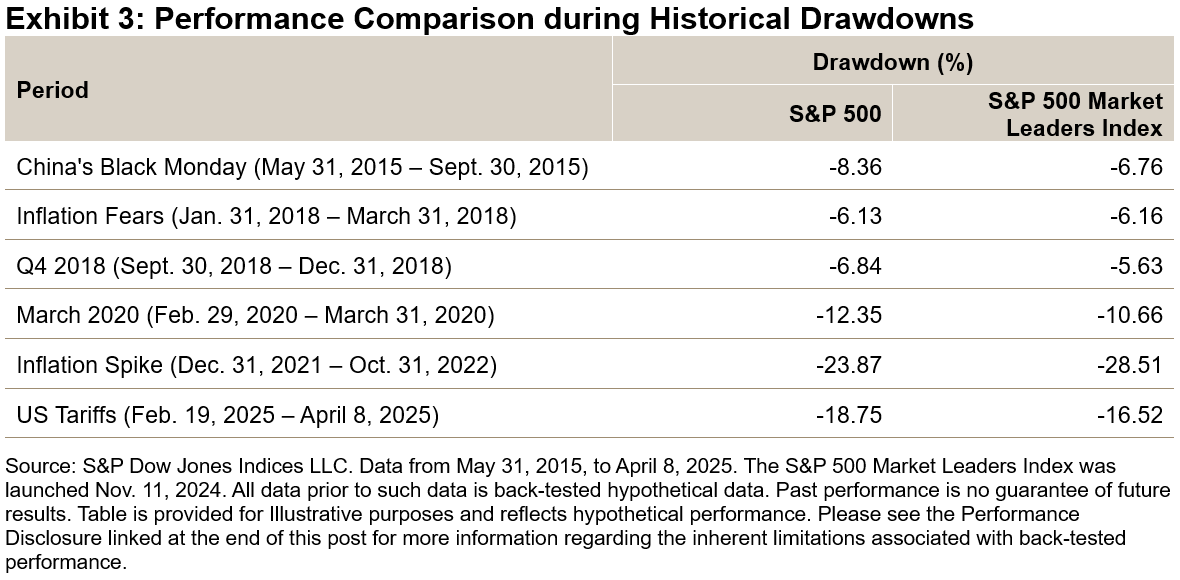
The S&P 500 Market Leaders Index has demonstrated impressive long-term performance compared to the benchmark. As shown in the back-tested period covered in Exhibit 2, it has outperformed with lower volatility, leading to better risk-adjusted returns. The index not only offered greater upside potential but also a defensive stance. Notably, during the recent tariff-related drawdowns, the S&P 500 Market Leaders Index outperformed the benchmark by 2.23%
Historical Drawdowns
The S&P 500 Market Leaders Index has often benefited from downside protection during past market sell-offs.
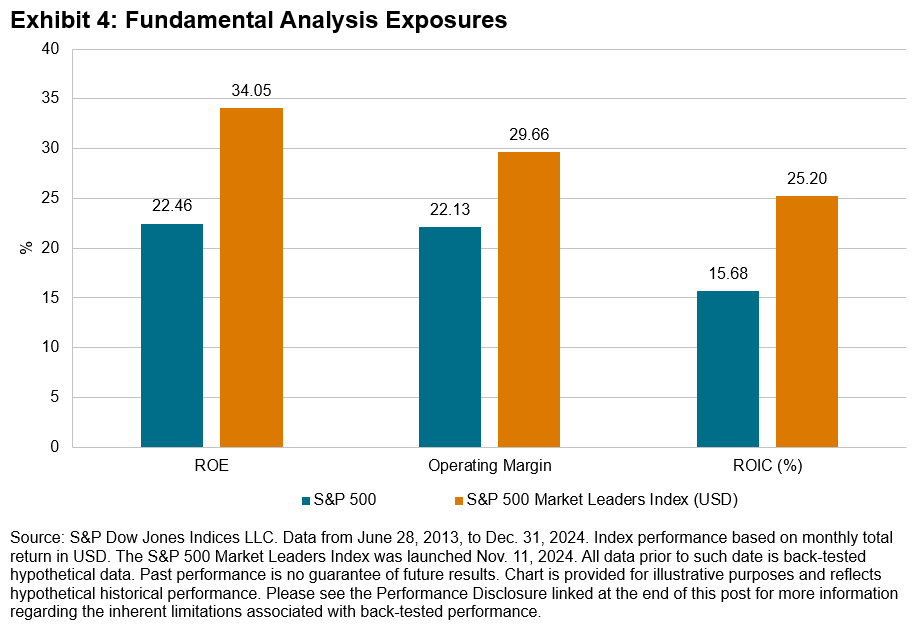
Higher Quality Constituents
Historical fundamental analysis of the index reveals a greater focus on profitability metrics that align closely with the quality factor.
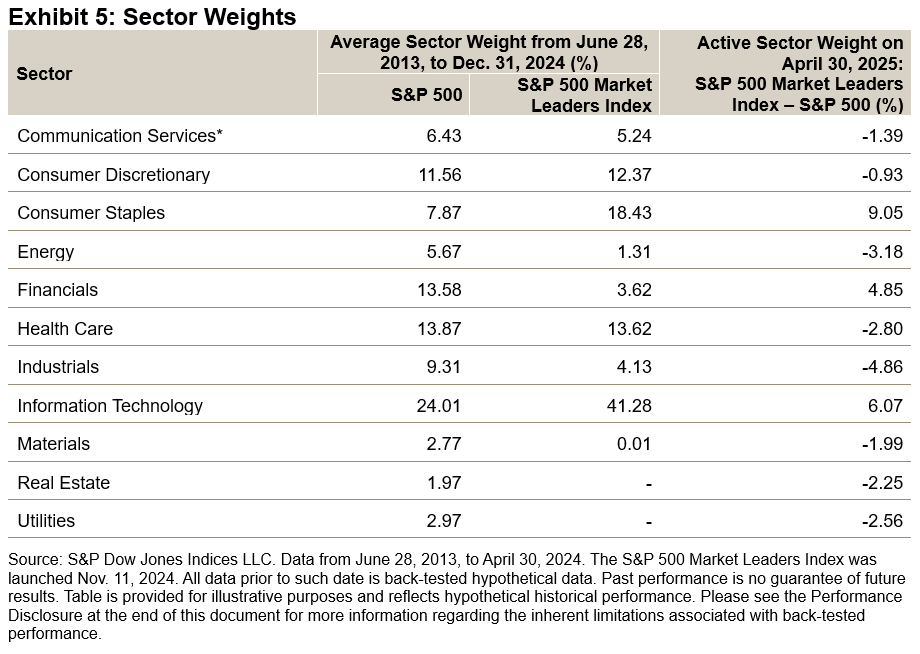
Sector weights have been diversified and historically skewed toward Consumer Staples, Health Care and Information Technology compared to the benchmark, with underweights in Energy and Industrials. As of Dec. 31, 2024, the index showed overweights in Consumer Staples, Financials and Information Technology, while Health Care was underweight.
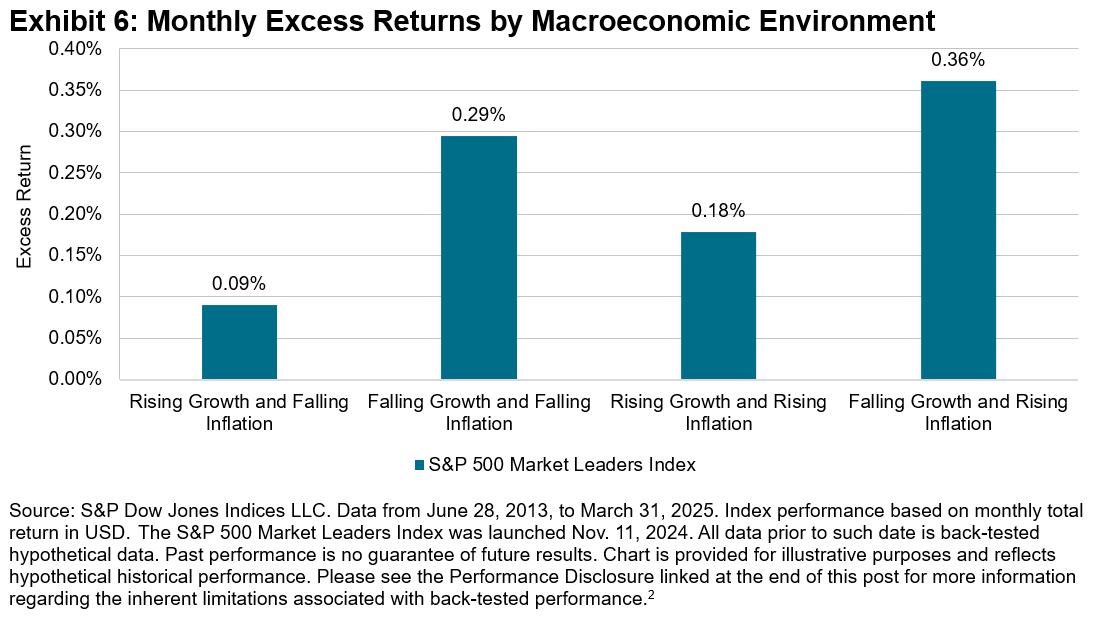
Historical Macroeconomic Performance
The S&P 500 Market Leaders Index tended to outperform the benchmark in most market environments but had the highest performance in periods of falling growth, regardless of inflation.
Conclusion
The S&P 500 Market Leaders Index tracks 50 of the most consistently high-performing companies in the U.S. equity market. By focusing on ROIC, FCF margin and market share, the index seeks to identify market leaders with sustainable competitive advantages. Historically, this approach has identified higher-quality companies that exhibited defensive qualities and strong risk-adjusted performance.
1 For more information please see the full methodology.
2 Further explanation of the macroeconomic analysis is available in the blog A Historical Perspective on Factor Index Performance across Macroeconomic Cycles.
The posts on this blog are opinions, not advice. Please read our Disclaimers.