Get Indexology® Blog updates via email.

In This List

The Factors Fueling the Rise of Indexing in Wealth Management

Two Decades of Dividends: A Macro Look at S&P High Yield Dividend Aristocrats

Harvesting Hope – Tax Optimization in a Down Market

Tracking Munis in Uncertain Markets

Volatility, Correlation and Dispersion in the S&P 500 Top 20 Select Index

The Factors Fueling the Rise of Indexing in Wealth Management

Contributor Image
Brandon Hass

Global Head of Client Solutions Group, Direct Indexing and Model Portfolios

S&P Dow Jones Indices

Recent activities indicate that indexing is on the rise in wealth management.

A previous blog introduced Cerulli Associates’ new whitepaper, which explores how index-based strategies are reshaping U.S. wealth management.1 Financial advisors with at least 10% of client assets invested in exchange-traded funds (ETFs) are allocating 46% of client assets to index-based strategies today, with expectations that this figure could hit 49% by 2026.2

But what’s driving this shift? In this blog, we examine the strategic factors behind indexing’s rise—including changes in advisors’ value propositions, the growth of asset allocation models and the rising use of direct indexing.

A New Advisor Playbook: From Performance to Planning

The wealth management landscape is evolving. Research from Cerulli Associates shows advisors are pivoting away from investment management as their core differentiator, with financial planning now taking center stage.

Why have advisors’ value propositions shifted? The research shows that clients have turned their focus to goals—such as funding retirement or college—rather than beating benchmarks. For example, 57% of affluent investors prioritized advisors who understand their needs, while 45% aimed to outperform the market.3

This shift aligns with a rise in index-based strategies, which have lower fees—an attractive feature for advisors focusing on holistic planning over outperforming benchmarks.

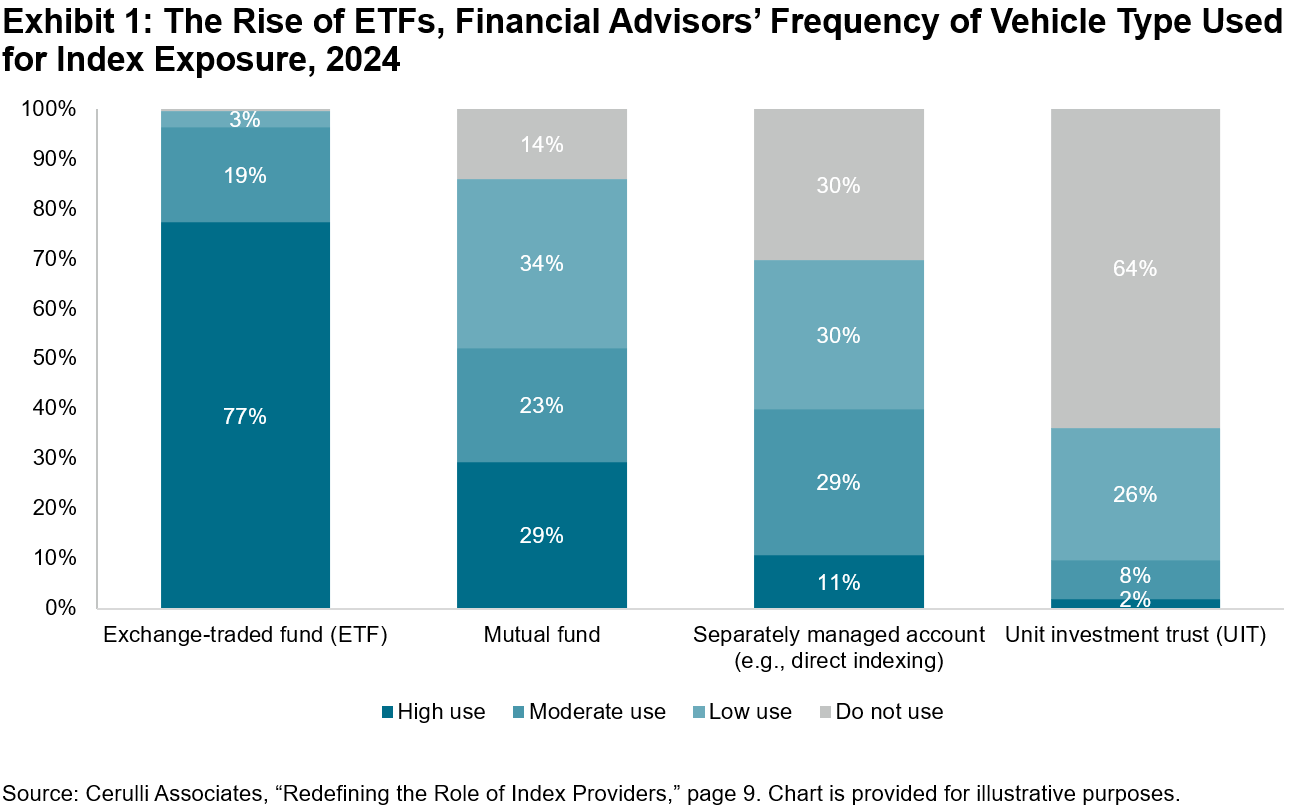
ETFs are the leading vehicles for index-based strategies, with over 75% of advisors reporting high usage, a factor contributing to indexing’s momentum (see Exhibit 1).

Asset Allocation Models: Outsourcing Meets Efficiency

Hand in hand with this trend is the rise of asset allocation model portfolios. These outsourced solutions, often built with index-based ETFs, are increasingly popular. Cerulli Associates pegged model assets at USD 2.1 trillion in 2023, projected to hit USD 2.9 trillion by year-end 2025.4

The growing use of asset allocation model portfolios is supported by a constant push/pull dynamic: wealth management home offices are actively promoting their adoption among advisors, while advisors themselves are increasingly attracted to the benefits these portfolios offer. For home offices, model portfolios can help create a more consistent client experience, reduce compliance risks and streamline decision-making, while advisors are drawn to the increased efficiency they offer, freeing up time for client-facing work.

Direct Indexing: Precision Meets Personalization

Direct indexing is becoming an important vehicle for how advisors build portfolios at the nexus of two trends in wealth management: high-net-worth clients’ demand for both increased efficiency and greater personalization.5

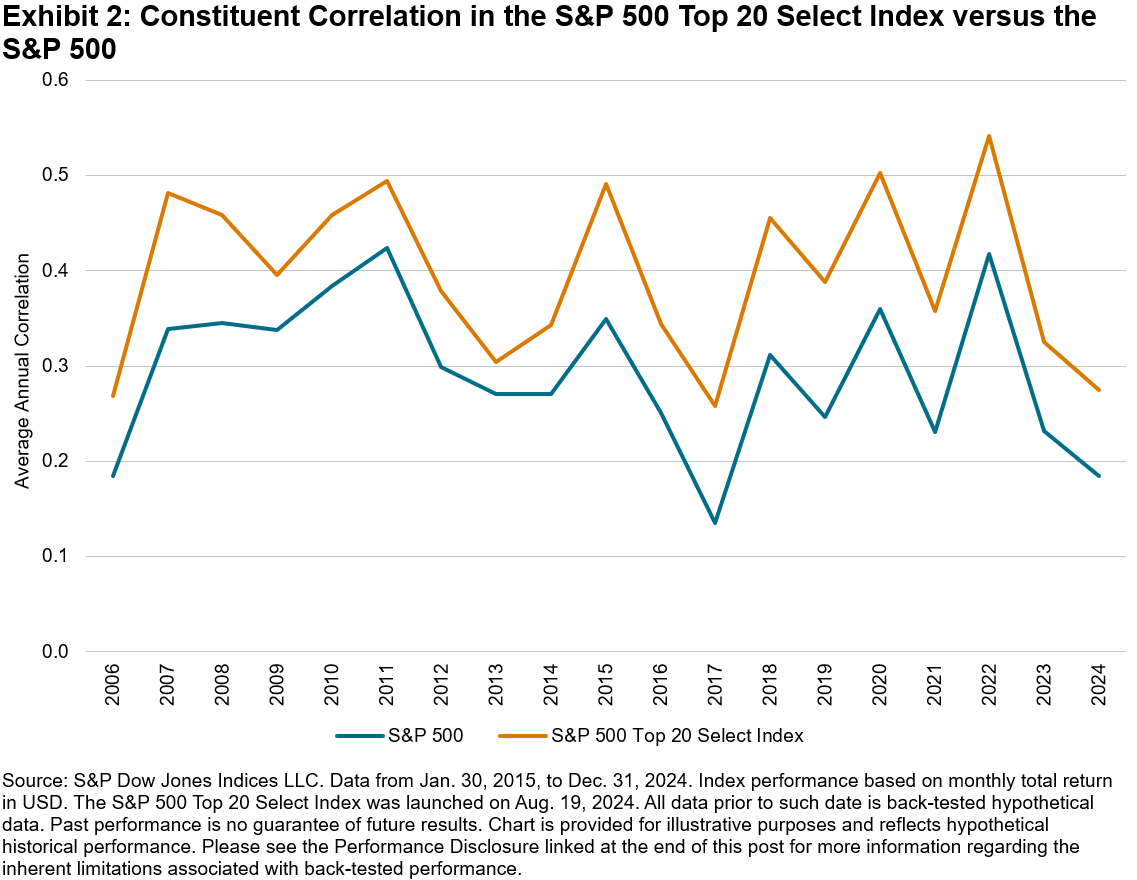
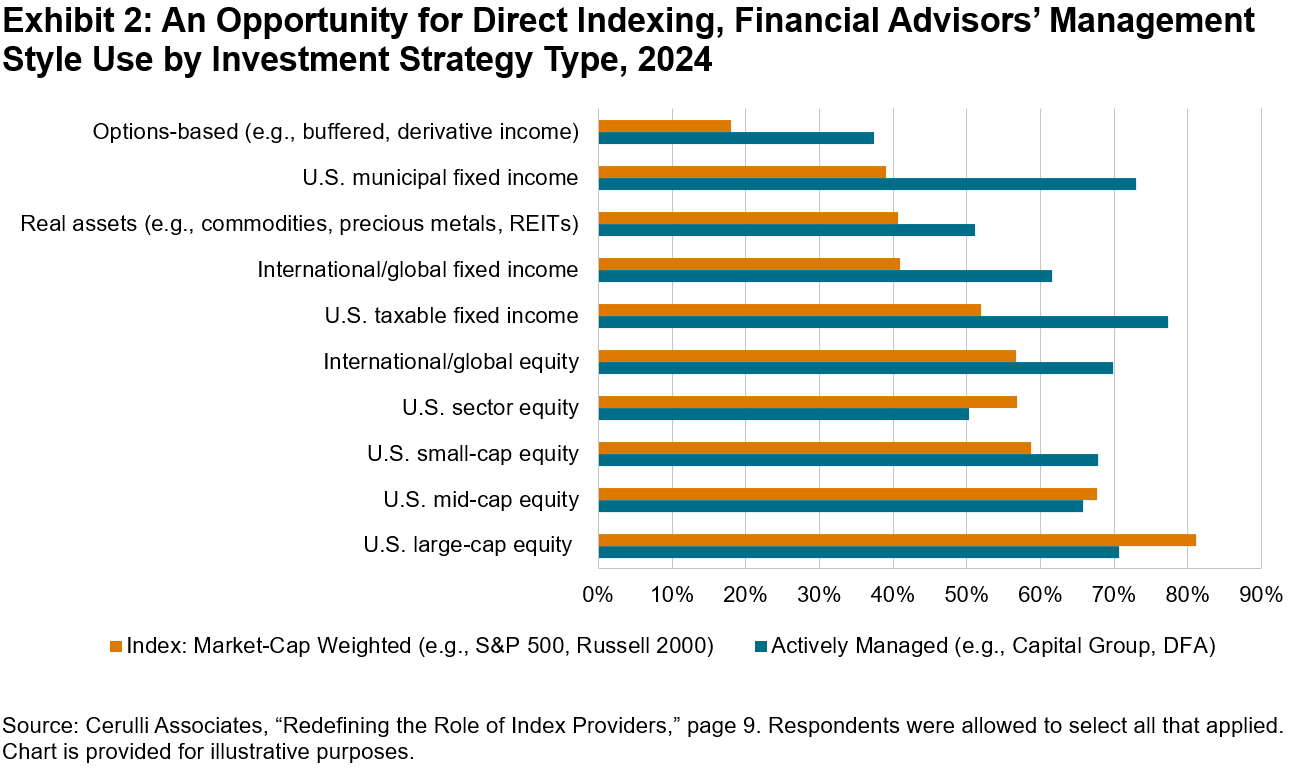
Advisors are increasingly using separately managed accounts (SMAs) to track indices while customizing for tax optimization or client preferences. Cerulli Associates has a positive outlook on the potential growth of direct indexing among the affluent and high-net-worth client segments, particularly in equity-based strategies. One reason is that 81% of advisors use index-based strategies for U.S. large-cap equity, where efficiency is prioritized, versus 52% for taxable fixed income, where active approaches are still implemented (see Exhibit 2).6

What’s Next?

These factors—planning over performance, model portfolios and direct indexing—aren’t just trends; they are fundamentally reshaping how advisors operate. Index providers have a role in these mega-trends, as they deliver the data, intellectual property and other tools designed to help asset managers and wealth managers track markets with precision and efficiency.

In upcoming blogs, we will explore how asset managers and wealth managers may further implement index providers’ solutions and services.

1 The Cerulli Associates whitepaper “Redefining the Role of Index Providers” was sponsored by S&P Dow Jones Indices.

2 Please see Executive Summary of Cerulli Associates’ “Redefining the Role of Index Providers.”

3 Please see page 4 of Cerulli Associates’ “Redefining the Role of Index Providers.”

4 Please see page 8 of Cerulli Associates’ “Redefining the Role of Index Providers.”

5 For more information on the growth of direct indexing, please read “Harnessing the Power of Direct Indexing.”

6 Please see page 10 of Cerulli Associates’ “Redefining the Role of Index Providers.”

The posts on this blog are opinions, not advice. Please read our Disclaimers.

Two Decades of Dividends: A Macro Look at S&P High Yield Dividend Aristocrats

What are the key takeaways from the first 20 years of the S&P High Yield Dividend Aristocrats? S&P DJI’s Rupert Watts and State Street Global Advisors’ Colin Ireland explore key lessons and potential applications for S&P HYDA in its 20th anniversary year.

The posts on this blog are opinions, not advice. Please read our Disclaimers.

Harvesting Hope – Tax Optimization in a Down Market

Contributor Image
Michael Brower

Former Associate Director, Index Investment Strategy

S&P Dow Jones Indices

As the dust settled from Tax Day, U.S. equities found themselves nearly approaching correction territory. Amid concerns over tariffs and other global trade frictions, the S&P 500® has fallen 5.6% YTD through April 28, 2025. In Exhibit 1, we see that The 500™ experienced its most significant drop in 2025 of nearly 6% on April 4, followed by a remarkable rebound on April 9 when it gained 9.5%. Although we’ve recently had multiple consecutive days of gains, these swings underscore the substantially challenging environment market participants are navigating, with the benchmark ending 35 out of 79 trading days in negative territory.

While this might seem like a cause for concern, there may be a silver lining: the opportunity for tax optimization. This approach allows market participants to potentially offset capital gains with losses, reducing their tax liability and diminishing the financial impact of a volatile market.

Such opportunities exist not only at the overall market level, but at the constituent level too. In fact, 66% of S&P 500 constituents have posted negative returns YTD through April 23, 2025 (see Exhibit 2), which represented about 75% of the total index market capitalization over the period.

When we zoom out, however, it becomes apparent that this is not unprecedented compared to historical down markets. Exhibit 3 captures this broader perspective and displays the percentage of stocks that experienced positive and negative annual returns from 2002 to 2024, including through YTD 2025. Over the last 23 years, there were four years that The 500 finished in negative territory—2002, 2008, 2018 and 2022. In those years, the average percentage of down stocks was 74%. Across all years, excluding 2025, the average percentage of down stocks was roughly half of that, about 36%.

As we move forward in 2025, a focus for some investors may be on navigating the complexities of the market while simultaneously maximizing the benefits of tax-efficient strategies. The current downturn, while daunting, could present opportunities for those who are prepared to take advantage of ETFs and direct indexing strategies for potentially different tax outcomes than traditional active mutual funds. By staying informed and proactive, investors may hope to turn the challenges of the market into opportunities for tax savings.


S&P Dow Jones Indices does not provide tax, legal, or accounting advice. This content is provided as of April 2025, and has been prepared for informational purposes only. An appropriate advisor should be consulted to evaluate the impact of any tax consequences of making any particular investment decision. All information provided by S&P Dow Jones Indices is impersonal and not tailored to the needs of any person, entity, or group of persons. It is not intended to be, and should not be relied upon as, tax, legal, or accounting advice and you should consult your own advisors before engaging in any transaction. Neither S&P Dow Jones Indices LLC nor any of its affiliates shall have any liability for any errors or omissions in the data included therein.

The posts on this blog are opinions, not advice. Please read our Disclaimers.

Tracking Munis in Uncertain Markets

As uncertainties around tariffs, inflation and interest rates continue to make headlines, how are yield seekers viewing munis? S&P DJI’s Jennifer Schnabl and Vanguard’s David Sharp discuss key performance drivers of munis in challenging markets.

The posts on this blog are opinions, not advice. Please read our Disclaimers.

Volatility, Correlation and Dispersion in the S&P 500 Top 20 Select Index

Contributor Image
Algreen Bakasa

Director, U.S. Equity Indices

S&P Dow Jones Indices

The S&P 500® Top 20 Select Index series launched in August 2024 and is designed to measure the capped market-capitalization-weighted performance of the largest 20 companies, by float market cap, in the S&P 500. Previous blogs introduced the S&P 500 Top 20 Select Indices, covering their construction, objectives and historical performance. This installment examines the index’s volatility, correlation and dispersion to provide insight into its historical behavior relative to The 500™.

Slightly Higher Volatility

Exhibit 1 provides a calendar year breakdown of the S&P 500 Top 20 Select Index’s volatility compared to The 500. In several years, the Top 20 recorded slightly lower volatility than The 500—particularly during certain notable market events (e.g., the global financial crisis in 2008 and 2009). Conversely, during periods of elevated volatility for the S&P 500 Top 20 Select Index (e.g., 2020 and 2022), volatility closely tracked broader market moves, suggesting that these differences may be driven more by external market forces than by the index’s composition.

More broadly, over the past 10 years (2015-2024), the average annual volatility for the S&P 500 Top 20 Select Index was 18.5%, slightly above the broader S&P 500’s 16.2%. Over the recent five-year period, volatility remained modestly higher (22.5% versus 19.5%).

How Closely Do Mega-Cap Stocks Move in Sync?

The S&P 500 Top 20 Select Index comprises a smaller number of constituents than The 500. Historically, the performance of these mega-cap constituents has tended to move more closely together over time. On average, the index exhibited higher correlation among its constituents compared to the broader S&P 500 (see Exhibit 2).

How Varied Are Returns within the Index?

Dispersion measures how differently individual components perform compared to the average. Lower dispersion indicates more uniform performance across constituents, while higher dispersion suggests greater variability. Exhibit 3 illustrates that the S&P 500 Top 20 Select Index consistently showed lower dispersion compared to the broader S&P 500 over both 10-year and 5-year periods. This lower dispersion suggests that the individual performance of the index constituents typically differs less from the index average, indicating less variability in how these mega-cap constituents perform relative to the index average.

Conclusion

A closer look at volatility, correlation and dispersion reveals that the S&P 500 Top 20 Select Index has exhibited modest differences compared to the broader S&P 500. These include slightly higher average volatility and correlation, along with somewhat lower average dispersion over the past 5- and 10-year periods. Taken together, these metrics provide a historical view of how the index has behaved across different market environments.

The posts on this blog are opinions, not advice. Please read our Disclaimers.