Get Indexology® Blog updates via email.

In This List

Waiting for a Bear

Potential Opportunities and Risks of Private Credit

Building the Next Generation of Thematic Indices

Stock Pickers and Style Bias

Picking a Path with S&P 500 Sectors

Waiting for a Bear

Contributor Image
Tim Edwards

Managing Director, Index Investment Strategy

S&P Dow Jones Indices

The S&P 500® recently entered a “correction,” a term used when the price index falls by more than 10% from its highs. It may yet decline further, the fact of which might tempt market participants to delay equity purchases until, say, the index has declined by 20%—which would define the start of a “bear market.” The potential relative merits of “waiting for a discount,” as examined historically via the nearly seven-decade-long record of the S&P 500, offer an intriguing perspective.

We began with every trading day in The 500™’s history on which the closing index level was not already 20% or more below the prior all-time high. For such days, we then measured how long it was before a 20% decline first occurred and what the overall change in the index level was over that period. Exhibit 1 shows the length of time in years of such waiting periods, historically.

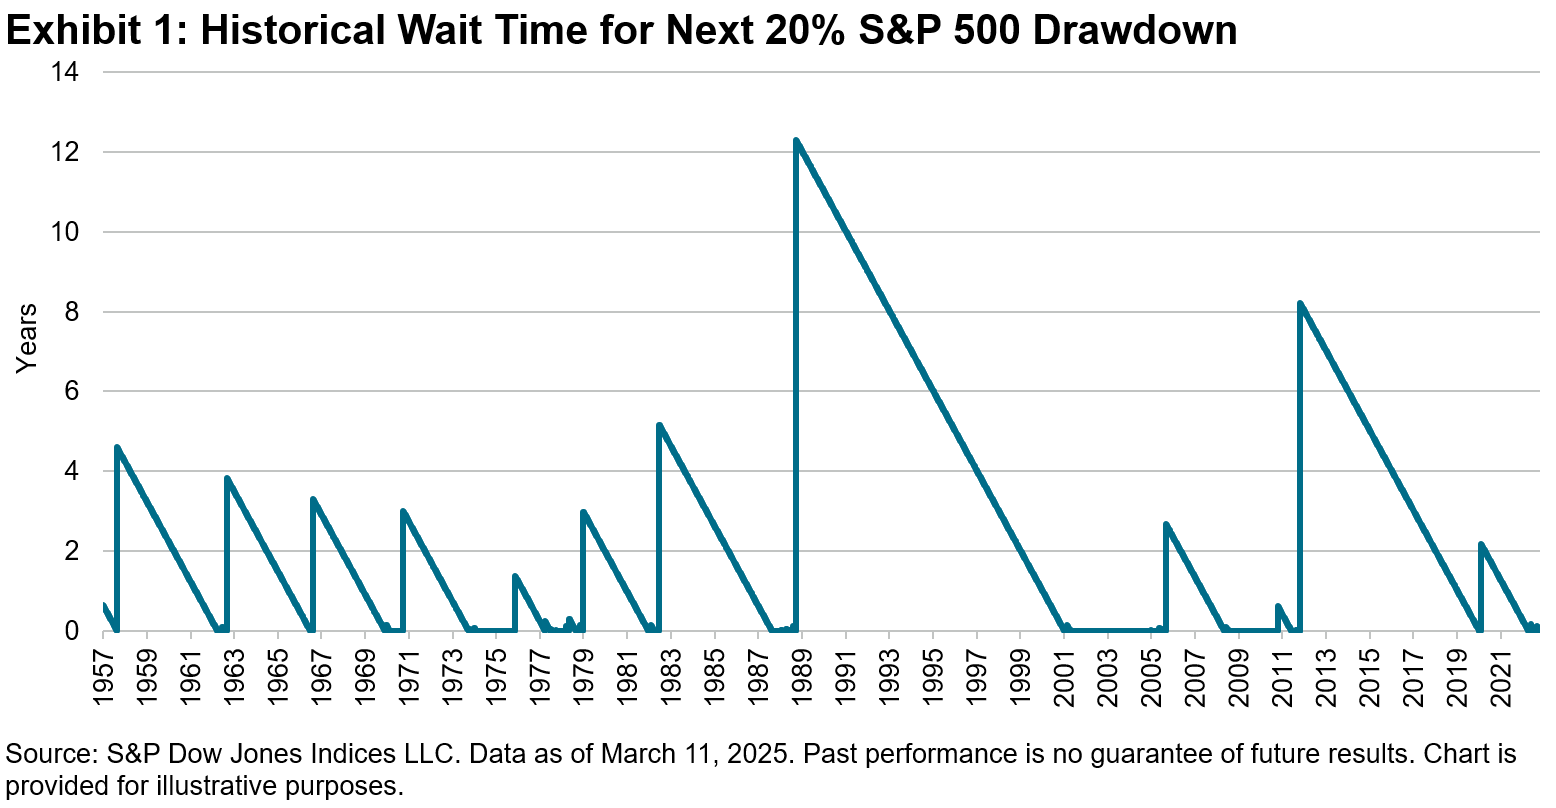
The average waiting time was 3.0 years, while among the smaller sample of days when the index was already 10% or more down from a high (but not yet 20% down), the wait for a bear market was almost as long—equal to 2.1 years.

Sometimes, the index rose more than enough to offset the subsequent decline. At the historical extreme: from Nov. 29, 1988, it was over 12 years until the next bear market began, by which time the index had risen a cumulative 336% (including the final decline). Exhibit 2 shows the change in the index level during the waiting period associated with each starting point in history, and Exhibit 3 shows the accompanying distribution of those index changes, ignoring zero values.

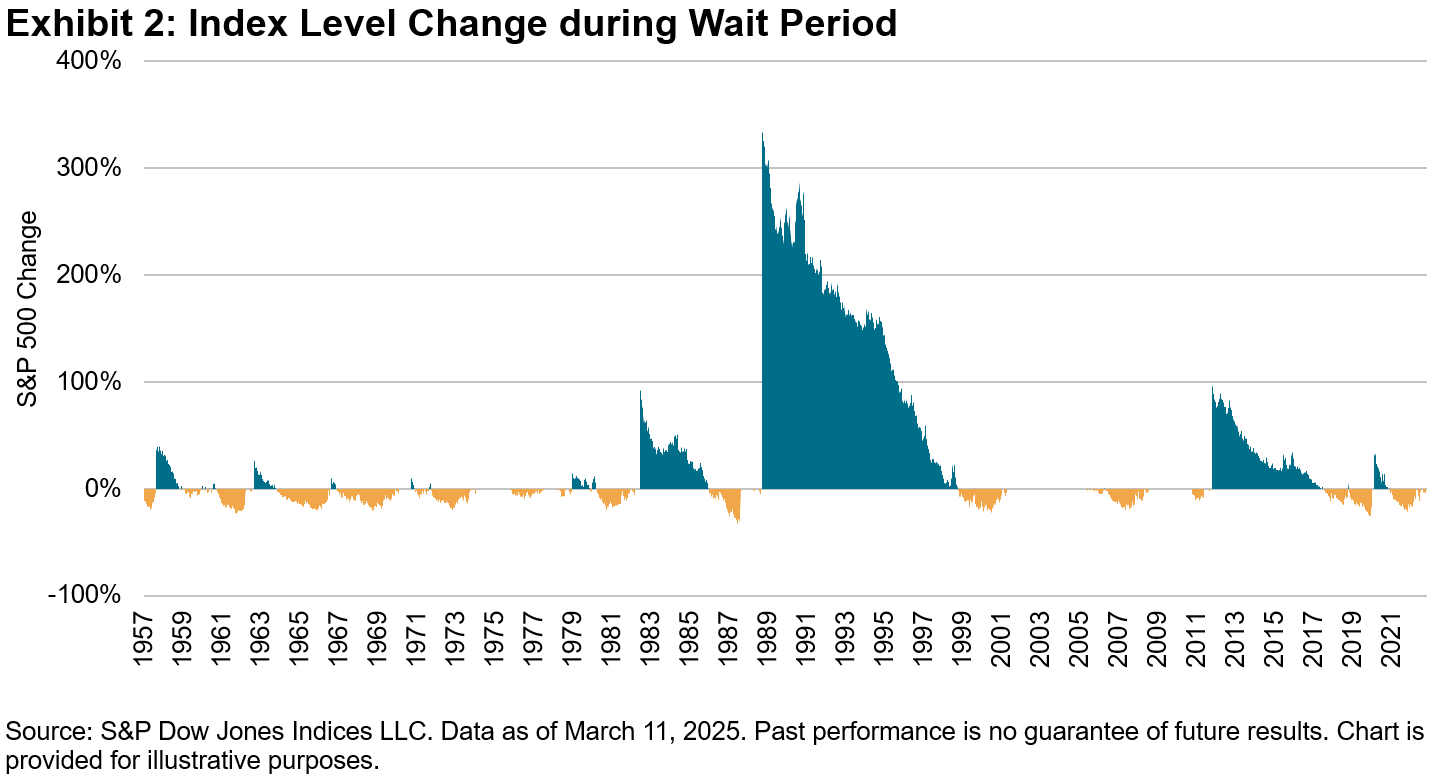
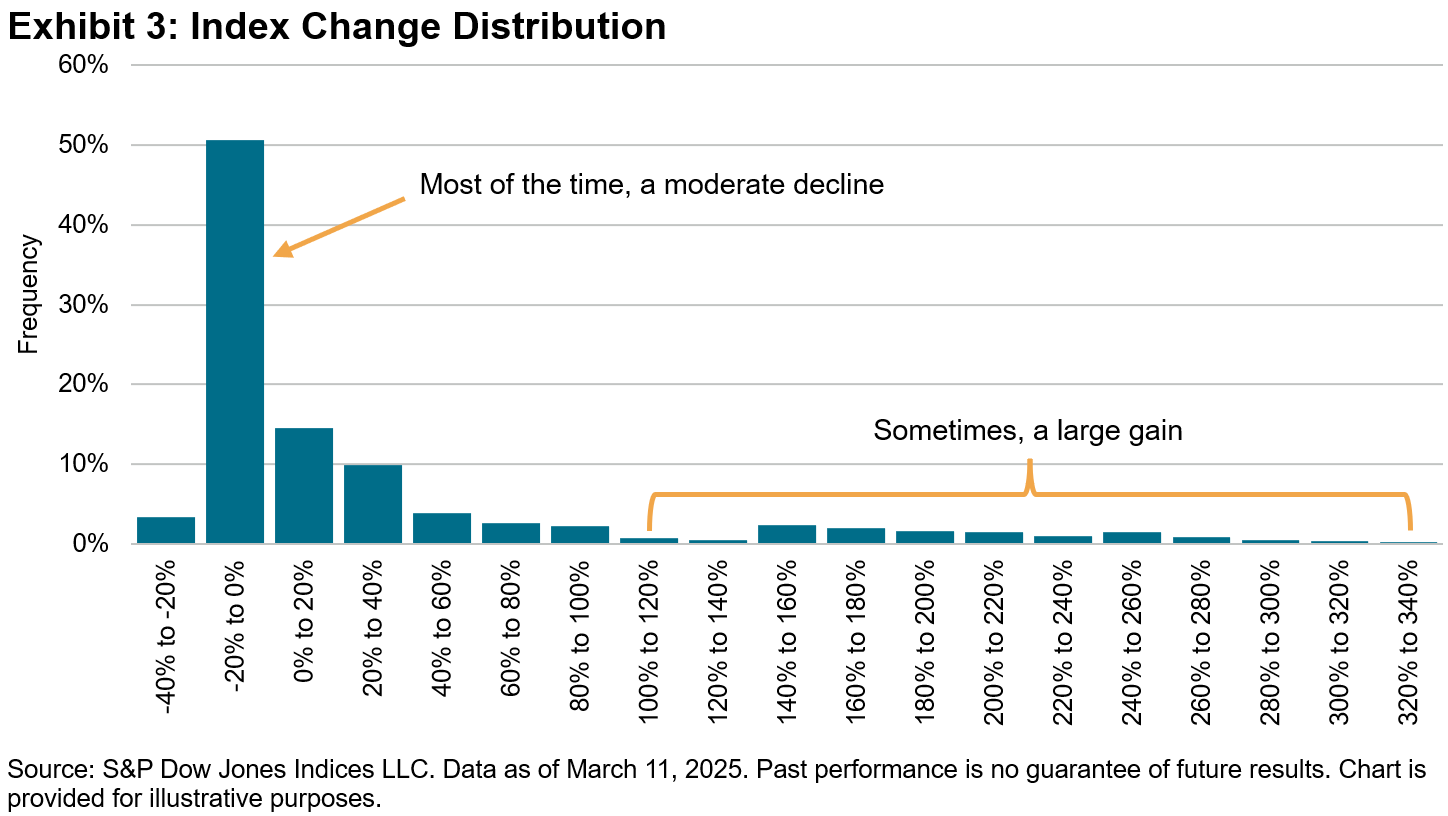
Most of the time, waiting meant a slightly lower index level—the median index change was a decline of 1.7%. However, some of the time, the index change was highly positive, which led to an average index change equal to a 30.0% increase. Restricting to the days when the index was down 10% or more, but not yet 20% down, the average index change during the wait was, again, almost as material, equal to a 22% increase.

Exhibit 4 shows equivalent statistics using declines of 1%, 2%, 5%, 10%, as well as the original 20%. The sample size of “start points” get smaller down the table, as the proportion of days when the index was already in such a decline increases.

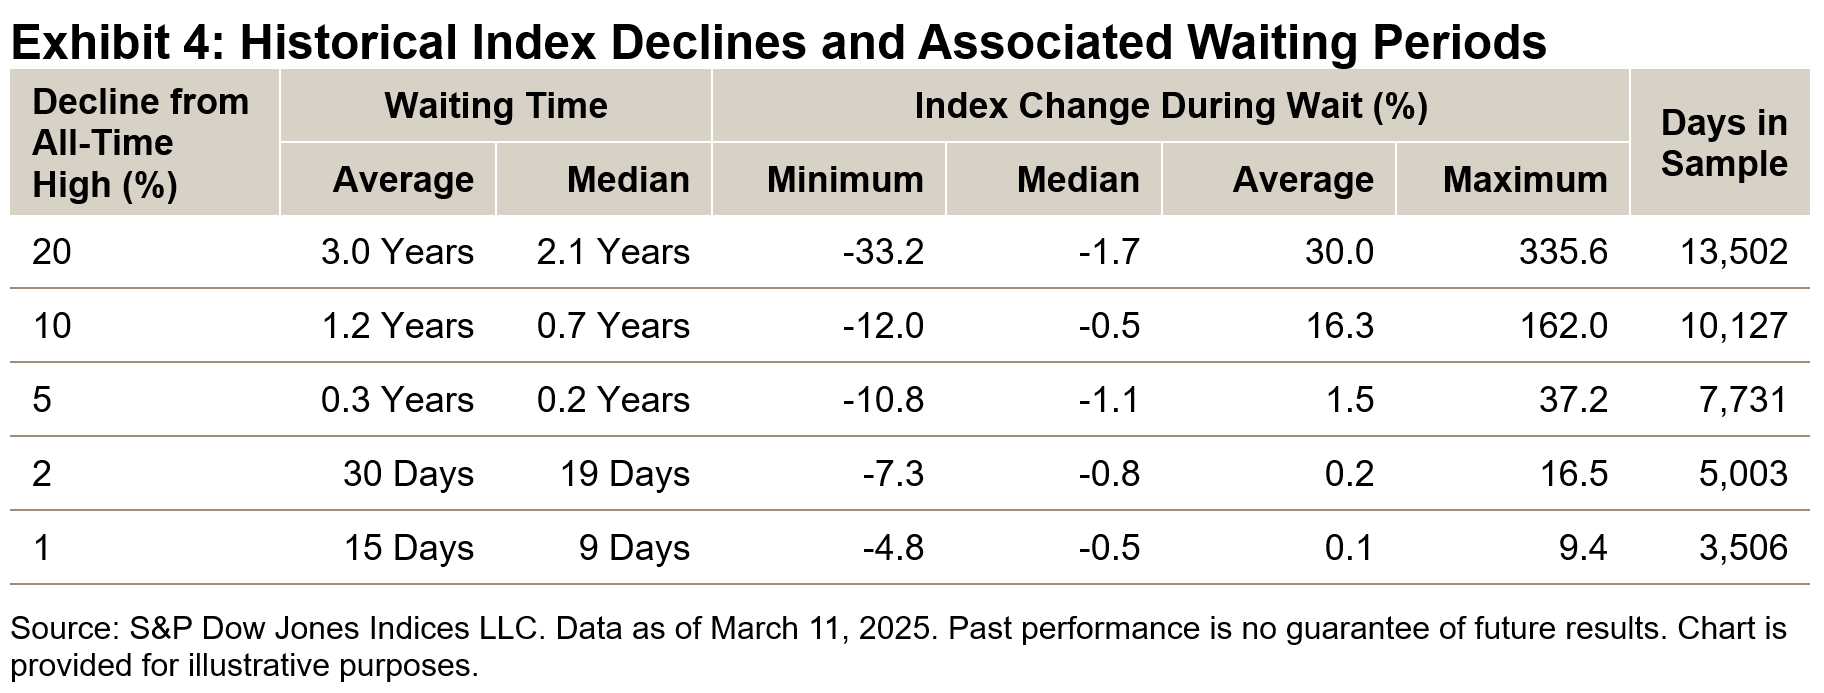
Overall, the pattern was similar for smaller declines: the median index change during the wait for a discount was a small decrease, but the average index change was positive, and the maximum index change was much higher. In other words, most of the time, waiting resulted in a small discount. But some of the time, waiting meant missing out on large gains.

The well-known money manager Peter Lynch once quipped that “Far more money has been lost by investors preparing for corrections, or trying to anticipate corrections, than has been lost in corrections themselves.” That may be true. As to whether the current S&P 500 downturn represents a buying opportunity, of course, only time will tell.

The posts on this blog are opinions, not advice. Please read our Disclaimers.

Potential Opportunities and Risks of Private Credit

Contributor Image
Richard LaBelle

Former Senior Associate, Private Market Indices

S&P Dow Jones Indices

The private credit market has seen significant growth in response to regulatory shifts, pursuit of yield and increased awareness of its unique characteristics. A previous blog explored its rise, and in this post, we will analyze private credit’s comparative performance, consistency and correlation to public markets—particularly broadly syndicated loans (BSL), which share private credit’s illiquidity and complexity.

The Allure of Private Credit

Interest in private markets is driven largely by the illiquidity premium that often accompanies lock-up periods. Over the one-year period ending Dec. 31, 2023, public and private credit performed similarly (see Exhibit 1).

However, over a 10-year horizon, private credit indices exhibited stronger performance (see Exhibit 2). Notably, all indices declined during March 2020’s COVID-19 shock, but private credit demonstrated a stronger recovery, illustrating the divergence between private and public markets.

In the first five years of the period studied, private credit typically delivered higher returns than public credit, though investment grade bonds occasionally outperformed. A study by PineBridge Investments found that private credit outpaced the BSL market by approximately 157 bps on average, largely due to its illiquidity premium.1

Understanding Correlation in Private Credit

To further analyze private credit’s behavior, we examined correlation between public and private credit indices (see Exhibit 3).

  • Investment grade bonds show little correlation to private credit strategies
  • High yield bonds have notable correlation with all private credit strategies
  • Leveraged loans exhibit strong correlation (80% or higher) with private credit, except for subordinated capital

This suggests leveraged loans may be a useful public market comparison for private credit, given shared characteristics such as floating-rate coupons. It also highlights how credit risk, rather than interest rate sensitivity, drives performance in these instruments.

Navigating Risks in Private Credit

Private credit involves lengthy lock-up periods (typically 7-10 years) and illiquidity, limiting investors’ ability to exit positions. While private lenders cater to borrowers who are unable to secure traditional bank loans, private and public credit markets differ in liquidity and syndication.

In the public BSL market, loans are syndicated and actively traded, leading to price fluctuations. Private credit loans, though, are primarily “buy and hold,” not subject to syndication and generally unavailable to the broader market. This means investors manage capital calls and distributions over time while maintaining committed capital obligations.

In addition, private credit’s rapid growth raises questions about sustainability and potential oversaturation. Deal-making has kept pace with demand, but long-term durability remains uncertain.

Private credit managers negotiate preferred terms in loan agreements, but these require time and extensive assessment. Many private credit loans feature floating-rate coupons priced above the secured overnight financing rate (SOFR). With potential interest rates decreases, it remains to be seen how private credit will compete with, or complement, public markets as investor demand continues.

Learn more in our recent analysis, “The Rapid Rise of Private Credit.”

Don’t miss our next blog where we explore the future of private credit.

Learn more about Private Investment Benchmarks

Ask an Expert

This blog was co-authored by Nicholas Godec and Greg Vadala.

1 Wolfson, Kevin and Joseph Taylor. “Private Credit vs. Broadly Syndicated Loans: Not a Zero-Sum Game.” PineBridge Investments. July 2024.

The posts on this blog are opinions, not advice. Please read our Disclaimers.

Building the Next Generation of Thematic Indices

What trends are the latest thematic indices tracking and what’s powering these innovative tools? S&P Dow Jones Indices’ Ari Rajendra and Vidushan Ragukaran discuss how S&P DJI is leveraging AI, machine learning and NLP to innovate and track dynamic industries and emerging trends.

The posts on this blog are opinions, not advice. Please read our Disclaimers.

Stock Pickers and Style Bias

Contributor Image
Anu Ganti

Head of U.S. Index Investment Strategy

S&P Dow Jones Indices

The results from our SPIVA U.S. Year-End 2024 Scorecard demonstrate another challenging year for active managers, with 65% of U.S. large-cap funds underperforming the S&P 500®, slightly above the report’s 24-year historical average of 64%. But small-cap managers fared significantly better, with only 30% of small-cap funds underperforming the S&P SmallCap 600®, the lowest underperformance rate on record. What might explain the widely contrasting fortunes between large-cap and small-cap managers?

2024 was characterized by positive skew in the S&P 500’s constituent returns, as shown in the top half of Exhibit 2, with the average return outpacing the median return by 1.6%, evidencing a longstanding challenge for more concentrated active managers, who may be less likely to own these top performers in their strategies. Because the largest stocks in the index were among the best performers, the index’s return of 25.0% was well above the simple average, an additional headwind for managers who were underweight in the largest stocks. These results are not surprising, as the average return has been greater than the median for The 500’s constituents in 20 out of the past 24 years.

Combining these elements of skewness and large-cap outperformance, a simple way to analyze the conditions for stock selection is to measure the percentage of constituents that beat the benchmark. Only 28% of member stocks beat the S&P 500 in 2024, which is the second-lowest percentage in 24 years and close to the 26% in 2023, which was another challenging year characterized by large-cap dominance.

Turning our attention to small-cap managers, the bottom half of Exhibit 2 shows that 44% of S&P SmallCap 600 constituents beat the benchmark in 2024, close to the long-term average of 45%. The S&P 600®’s return distribution was positively skewed as well, with an average return exceeding the median by 2.8%, consistent with the positive skew in 22 of the past 24 years. Just as we observed with large caps, the S&P 600 return of 9% was above the average, indicating that larger stocks within the small-cap benchmark outperformed.

Both large- and small-cap managers shared relatively slim prospects for stock picking, characterized by a positively skewed distribution of benchmark returns and the outperformance of larger stocks. But small-cap managers may have benefited from ample opportunities to tilt up toward outperforming large caps, with a 16% return differential separating the S&P 500 and the S&P 600, the widest differential in the SPIVA Scorecard’s history. Exhibit 3 illustrates that small-cap fund underperformance rates historically tended to improve with large-cap outperformance.

While conditions for stock picking were generally tough in 2024, small-cap managers had a banner year. The SPIVA U.S. Year-End 2024 results provide evidence that style bias may play a major role in explaining active manager outperformance across the capitalization spectrum and is importantly an indication that true stock selection skill may be more rare.

The author would like to thank Nick Didio for his contributions to this blog.

The posts on this blog are opinions, not advice. Please read our Disclaimers.

Picking a Path with S&P 500 Sectors

Contributor Image
Joseph Nelesen

Head of Specialists, Index Investment Strategy

S&P Dow Jones Indices

In February 2025, U.S. equity markets reflected general unease over an unpredictable future. Worries about the probability of tariffs and their impact on growth and inflation weighed on the minds of investors who also had to contend with weaker economic data and questions about the sustainability of mega-cap tech earnings. Against this backdrop, the S&P 500® exhibited striking bouts of intraday volatility yet finished the month in negative territory. In Exhibit 1, we show February performance of The 500™ along with each of its 11 component GICS sectors. February was the fourth month in a row that the sector spread (the difference between highest- and lowest-performing sectors) reached double digits, at 12.0%. Consumer Discretionary, Information Technology and Industrials finished the month trailing The 500, which itself dropped 1.3%. But beyond those three sectors, the other eight outperformed, exhibiting strength among traditionally defensive segments.

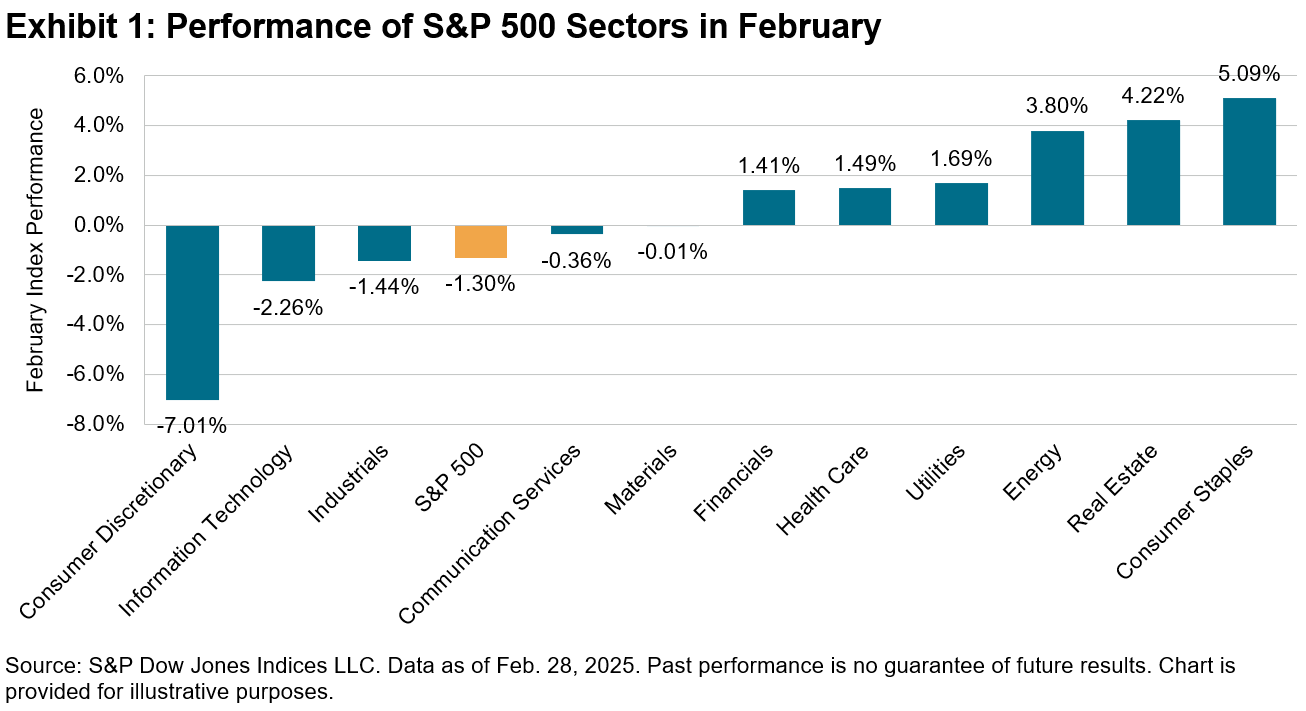
Headwinds and tailwinds affecting each sector in January generally persisted in February, as Consumer Discretionary and Information Technology extended their previous month’s underperformance, while eight other sectors outperformed The 500 in February, and nine sectors surpassed the broad benchmark YTD (see Exhibit 2). Industrials was the only sector that trailed slightly in February yet maintained excess performance YTD.
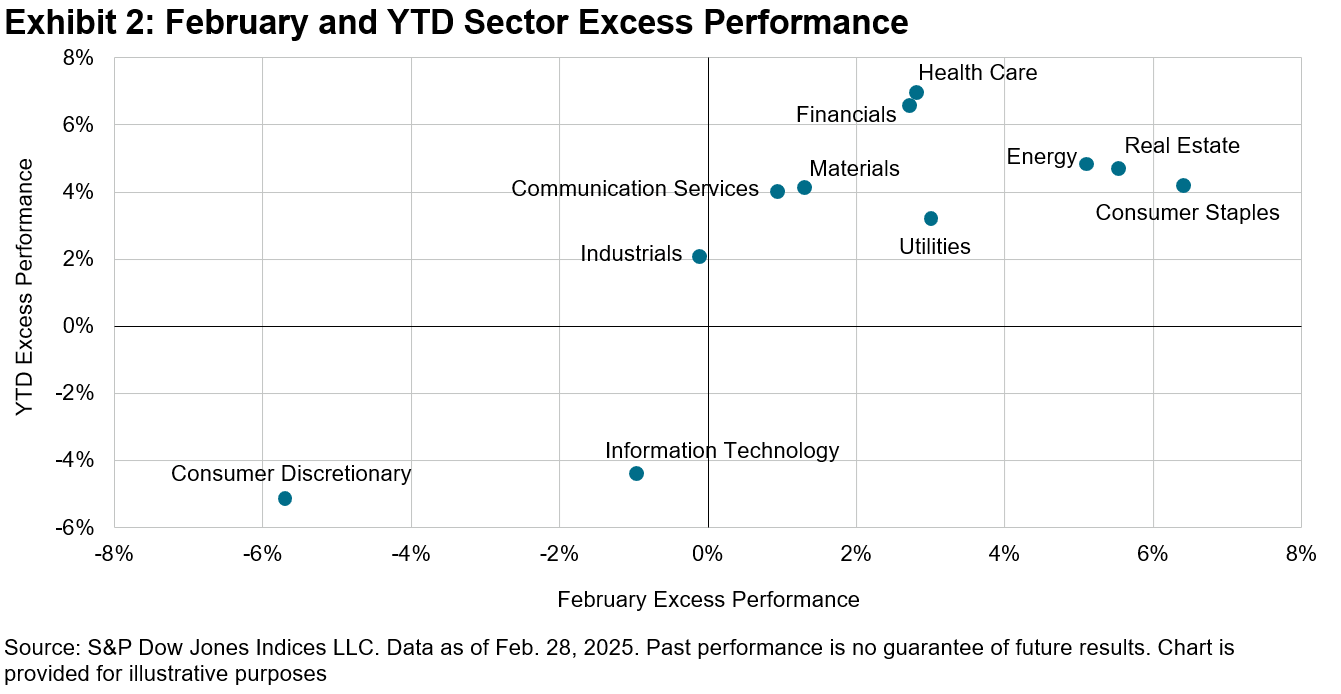
In a previous blog, we kicked off sector analysis in 2025 with a review of recent research detailing the performance of two blends of indices, each comprising traditionally cyclical and defensive sectors. Bucketing sectors into defensive and cyclical blends based on their risk characteristics and tendencies to outperform during rising or falling markets can allow for rational tilts based on owning sectors that offer relatively better performance in each environment.

As a reminder, we use the same two approaches below to understand sector performance YTD.1

  • Cyclical Blend: An equal-weighted combination of five cap-weighted cyclical sectors (Information Technology, Financials, Materials, Consumer Discretionary and Industrials), rebalanced monthly.
  • Defensive Blend: An equal-weighted combination of five cap-weighted defensive sectors (Utilities, Energy, Consumer Staples, Health Care and Communication Services), rebalanced monthly.

Exhibit 3 illustrates the hypothetical performance of each approach YTD through February 2025, showing both the widening outperformance margin of defensive sectors along with the resilience of equally weighting cyclical sectors, as both the defensive and cyclical blends outperformed The 500.

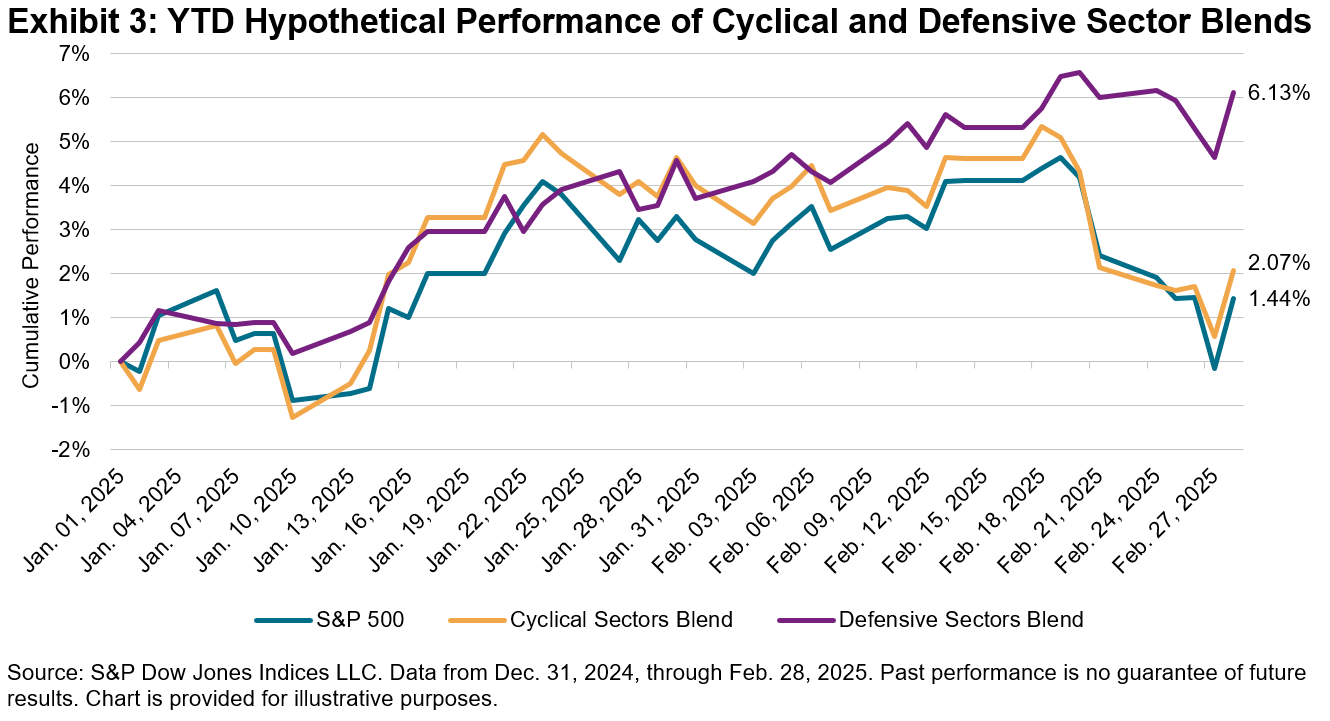
Although two months of 2025 are in the rearview mirror and, in many ways, the road ahead remains unclear, the performance of S&P 500 sectors sheds some light on how investors view prospects for different segments of the economy and provides a useful framework for making thoughtful tilts in preparation for whatever comes next.

1 Cyclical and defensive blends are comprised of the top five and bottom five sectors as ranked by historical beta and volatility. Real Estate, ranked in the middle of the 11 S&P 500 sectors, is excluded from this analysis.

The posts on this blog are opinions, not advice. Please read our Disclaimers.