Get Indexology® Blog updates via email.

In This List

Cerulli Associates Publishes Whitepaper on Redefining the Role of Index Providers

Private Credit vs. Public Debt and Traditional Financing

The Market Measure: March 2025

How AI Tools Are Helping Track Thematics

The S&P 500 GARP Index: Strong Fundamental Performance Amid a Steep Valuation Discount

Cerulli Associates Publishes Whitepaper on Redefining the Role of Index Providers

Contributor Image
Michael Brower

Former Associate Director, Index Investment Strategy

S&P Dow Jones Indices

The financial services consulting firm, Cerulli Associates, recently published a research study on the use of index-based products within the U.S. retail wealth management market. Their whitepaper aims to shed light on how asset managers, asset allocation model portfolio providers, wealth manager home offices and financial advisors can better utilize index provider solutions.1

The study is the culmination of 293 financial advisor survey results, which are diversified across channel, practice assets under management (AUM), core market client size and advisor age. It excludes advisors with less than USD 50 million in AUM and those with more than 25% in institutional assets or defined contribution plans. The paper also aggregates the findings of 25 executive interviews with asset managers, technology providers, wealth manager home offices and individual financial advisors.

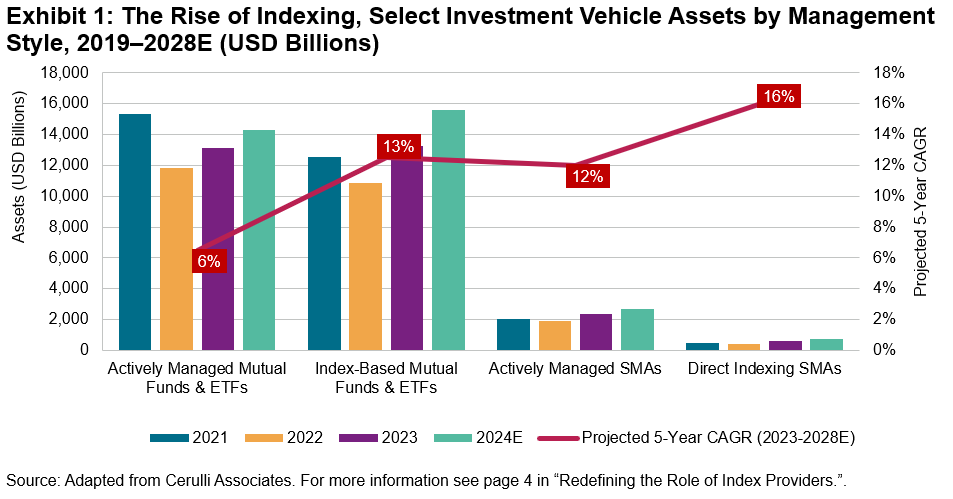
According to the research, the U.S. wealth management industry is experiencing a shift in value proposition where end-investors are increasingly relying on their financial advisor for their financial planning expertise rather than their investment management acumen. When asked to identify which factors are most important when selecting an advisor, 57% of affluent (i.e., USD 100,000 or more in investable assets) clients indicated that an advisor who takes the time to understand their needs and goals is extremely important, while only 45% said the same about the performance of their investments relative to the overall market.2 Fund flow data supports this shift as the positive growth of index-based exchange-traded funds (ETFs) and mutual funds, as well as direct indexing separately managed accounts (SMAs), have outpaced their actively managed counterparts, a trend that is projected to continue through 2028 (see Exhibit 1).

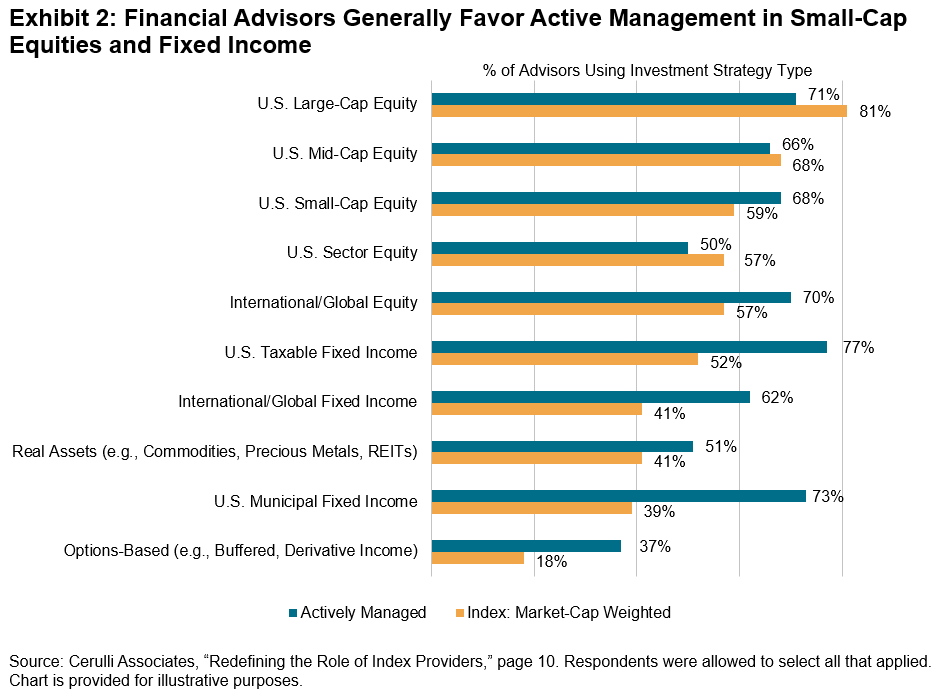
Although Cerulli Associates forecasts increased usage of index-based strategies, Exhibit 2 indicates that advisors currently pursue an active approach in sub-asset classes they perceive as being less informationally efficient, such as small-cap equities, international fixed income, U.S. taxable and municipal fixed income, options-based assets and real assets. However, a future shift could be in the cards. Cerulli Associates’ research suggests that financial advisors could expand their usage of index-based products beyond equities to fixed income as well,3 paralleling the growth of indexing in fixed income.4

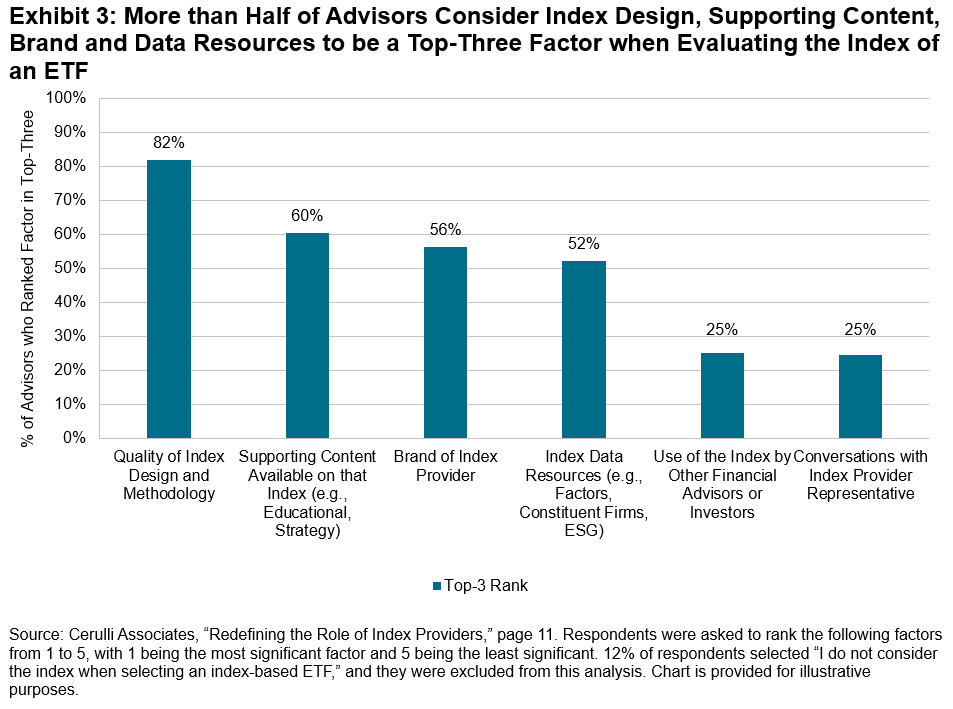
In addition to surveying advisors on how they utilize index-based products, they also extracted insights on how they evaluate them. For example, Exhibit 3 shows that 82% of advisors indicated that the quality of the index design and methodology was a top-three factor when considering the index that underlies an ETF, and 60% of advisors said the same of index provider content and education. To learn more about how financial advisors think about index providers, Cerulli Associates created a series of advisor profiles located in the appendix of the whitepaper.

As the landscape of index-based products becomes increasingly crowded, the recent findings from Cerulli Associates highlight that asset and wealth managers should thoughtfully consider how to leverage index providers’ solutions to stand out from the crowd.5 Strategies include going beyond traditional index data to drive product development and leveraging brand and content for product marketing and distribution. Embracing these strategies can not only differentiate firms but may also position them for success in the evolving retail wealth management market.


1 The Cerulli Associates whitepaper “Redefining the Role of Index Providers” was sponsored by S&P Dow Jones Indices.

2 Please see page 4 of Cerulli Associates’ “Redefining the Role of Index Providers”.

3 Please see page 10 and 11 of Cerulli Associates’ “Redefining the Role of Index Providers” for more information on ETF product growth.

4 For more information on the growth of indexing in fixed income, please read “The Hare and The Tortoise – Assessing Passive’s Potential in Bonds”.

5 Please see section 4, pages 12-17 of Cerulli Associates’ “Redefining the Role of Index Providers” for more information.

The posts on this blog are opinions, not advice. Please read our Disclaimers.

Private Credit vs. Public Debt and Traditional Financing

Contributor Image
Nicholas Godec

Senior Director,​ Head of Fixed Income Tradables & Commodities

S&P Dow Jones Indices

The private credit market has grown significantly, becoming a key component of the global financial landscape. Traditional banks have tightened lending practices due to increased regulatory scrutiny and risk aversion following the 2008 Global Financial Crisis. In response, private credit has emerged as an alternative for businesses facing challenges in securing financing from traditional sources.

This blog explores the factors driving private credit’s rise and how it compares to public debt and traditional financing.

A Multi-Layered and Growing Market

Several factors have fueled private credit’s expansion, including institutional investors’ pursuit of yield, increased market sophistication and greater awareness of the segment’s unique characteristics.

Private credit includes diverse debt strategies, such as senior debt, subordinated capital and credit opportunities. Senior debt funds offer secured loans for acquisitions and restructurings, benefiting from priority claims on assets. Subordinated capital (mezzanine funds) sits between equity and secured debt, often financing buyouts while generating interest payments. Credit opportunity funds invest in various credit instruments across global markets, including distressed debt and structured finance, providing potential for diversification.

Private Credit vs. Public Debt: Liquidity and Accessibility

Private credit and public debt differ in liquidity and market accessibility. Private credit refers to debt investments that are not publicly traded and typically issued by non-bank lenders. These instruments are often illiquid, with lock-up periods restricting sales. However, this illiquidity may result in higher yields compared to public debt.

Public debt, including corporate bonds and government securities, trades in the public bond market, offering greater liquidity with expanded access for prospective buyers or sellers. This accessibility allows individual and institutional investors to easily participate. However, increased competition often results in lower yields.

For investors, the liquidity tradeoff is crucial. Private credit’s illiquidity requires a longer investment horizon, whereas public debt’s liquidity provides flexibility but potentially lower yields than can be found in private debt markets.

Transparency and Reporting Standards in Private vs. Public

A key distinction between private credit and public debt is transparency. Public debt is subject to strict regulatory requirements, including standardized disclosures and regular reporting. This enables investors to make informed decisions based on widely available financial data.

Private credit, however, lacks uniform reporting standards. Borrowers are not always required to disclose financial information publicly, and reporting practices vary across issuers. This opacity makes due diligence and fund manager expertise critical in assessing credit risk.

To mitigate transparency challenges, private credit lenders rely on strong borrower relationships, detailed covenants and negotiated reporting requirements. Even so, investors must be comfortable with less readily available information, making trust in their fund managers essential.

Private Credit: Filling the Gaps Left by Banks

The lending landscape has evolved since the 2008 financial crisis. Traditional banks—once primary credit providers—face stricter regulations, limiting their ability to lend, particularly to middle-market businesses and specialized sectors. Higher capital requirements and risk management constraints have reduced their exposure to certain loan types.

Private credit lenders have stepped in, offering capital alternatives to businesses that may not meet traditional lending criteria. These non-bank lenders provide financing solutions with greater flexibility, including tailored repayment schedules, customized covenants, and the ability to underwrite complex transactions.

By serving businesses overlooked by traditional banks, private credit supports economic growth, particularly among small- and medium-sized enterprises (SMEs), which are widely viewed as key contributors to innovation and employment.

Synergies Between Private Credit and Traditional Lending

While private credit and bank lending are often seen as competitors, they also complement each other. Banks may originate loans and syndicate portions to private credit funds, managing risk while continuing to serve clients.

Additionally, banks and private credit firms may co-lend on larger transactions, combining resources and expertise. Such partnerships allow banks to remain engaged in lending while meeting regulatory requirements, while private credit firms gain access to larger, more complex deals.

Learn more in our recent analysis, “The Rapid Rise of Private Credit.”

Don’t miss our next blog where we explore the opportunities and risks associated with private credit.

This blog was co-authored by Ricky LaBelle and Greg Vadala.

The posts on this blog are opinions, not advice. Please read our Disclaimers.

The Market Measure: March 2025

Which factors weathered the mega-cap slump that dragged The 500™ down in February? Explore highlights from the latest SPIVA U.S. Scorecard and the defensive factors standing up to challenging markets.

The posts on this blog are opinions, not advice. Please read our Disclaimers.

How AI Tools Are Helping Track Thematics

What’s powering the latest innovations in thematics? S&P DJI’s Head of Thematic Indices, Ari Rajendra, and Invesco’s Head of EMEA ETF Equity Product Management, Chris Mellor, discuss the rise of thematic investing and how AI and NLP technologies are sharpening the tools tracking transformative trends.

The posts on this blog are opinions, not advice. Please read our Disclaimers.

The S&P 500 GARP Index: Strong Fundamental Performance Amid a Steep Valuation Discount

Contributor Image
George Valantasis

Director, Factors and Dividends

S&P Dow Jones Indices

GARP (growth at a reasonable price) has long been a staple investment strategy, but it was popularized by investing legend Peter Lynch after the Magellan Fund posted a remarkable average annual return of 29.2% from 1977 to 1990.1 As the name implies, it’s a strategy that seeks to strike a balance of tracking stocks with both growth and value characteristics. While the S&P 500® GARP Index has historically outperformed over the long term, its recent underperformance relative to the S&P 500 in 2024 has led to a situation where it is no longer trading at a “reasonable” price, but rather at a “historically cheap” price relative to The 500™. Interestingly, this blog will reveal that the current valuation disconnect occurs during a period of particularly strong fundamental performance factors for the S&P 500 GARP Index.

Valuation Comparison

Exhibit 1 illustrates the historical trailing 12-month price-to-earnings (P/E) ratio discount of the S&P 500 GARP Index relative to The 500 since June 1995. As of Jan. 31, 2025, the current discount is 51.0%, attributed to The 500’s P/E ratio of 28.3 compared to the S&P 500 GARP Index’s P/E ratio of 13.9.

As Exhibit 1 shows, the discount has historically tended to mean revert when reaching extended levels, with another notable divergence occurring in June 2000 when the discount peaked at 59% near the Tech Bubble. In the one-, three- and five-year periods following June 2000, the S&P 500 GARP Index outperformed The 500 by 25%, 45% and 78%, respectively.

Growth Comparison

Exhibit 2 shows that the S&P 500 GARP Index’s 2024 operating earnings per share (EPS) growth rate is in line with its five-year median of 12.3%. Both figures indicate a significant premium compared to the operating EPS growth rates of The 500 and the S&P 500 Equal Weight Index in 2024. The five-year median is presented instead of the average due to the volatility of operating EPS, particularly during the 2020-2022 COVID-19 period, which can distort the average calculation.

Quality Comparison

The same trend observed in the operating EPS growth comparison is evident in the quality comparison as well. As shown in Exhibit 3, the S&P 500 GARP Index’s 2024 return on assets (ROA) of 4.9% is 24% higher than its five-year average of 3.9%. In comparison to The 500 and the S&P 500 Equal Weight Index, this 4.9% ROA reflects a 31% and 100% increase, respectively.

The S&P 500 GARP Index’s 2024 return on equity (ROE) of 17.0% is 10% above its five-year average and is closely aligned with The 500’s 2024 ROE of 17.3% (see Exhibit 4). Compared to the S&P 500 Equal Weight Index’s ROE of 11.0%, the S&P 500 GARP Index’s ROE reflects a 54% premium.

Conclusion

Despite its notable valuation discount, the S&P 500 GARP Index’s 2024 fundamental performance—assessed through growth and quality metrics—was strong compared to both its benchmarks and its historical performance. The S&P 500 GARP Index demonstrated strong fundamental performance in 2024 while simultaneously trading at one of its widest valuation discounts since the Tech Bubble peak in 2000.


  1. Betting on the Market Pros: Peter Lynch.” PBS.

The posts on this blog are opinions, not advice. Please read our Disclaimers.