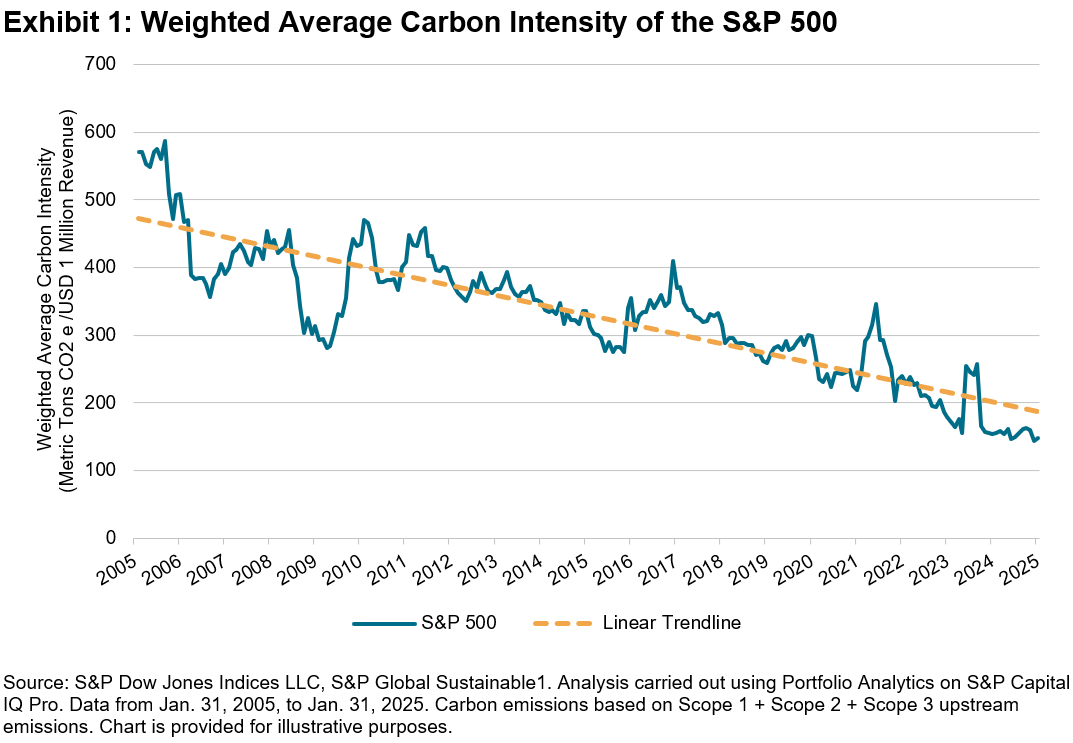
The energy transition represents a crucial market force with the potential to revolutionize our world. Over the two decades from Jan. 31, 2005, to Jan. 31, 2025, the S&P 500® demonstrated a significant decarbonization, evidenced by a 73.9% decrease in its weighted average carbon intensity, as illustrated in Exhibit 1.1 This material decrease highlights a shift in dynamics among The 500™’s constituents.
Central to this decarbonization is the growing adoption of renewable energy sources alongside a reduction in the use of fossil fuels. By utilizing S&P Global Trucost’s Environmental data suite, we analyzed the energy consumption of S&P 500 constituents based on energy source, tracking changes in this energy mix over the past decade.1 The findings of this analysis are summarized in Exhibit 2, which outlines the significant shifts in energy consumption patterns observed in recent years. Over the past decade, the role of renewables—consisting of hydroelectric, biomass and other renewables components—in the S&P 500’s energy mix has more than doubled, jumping from 95.7k GWh to 200.6k GWh.
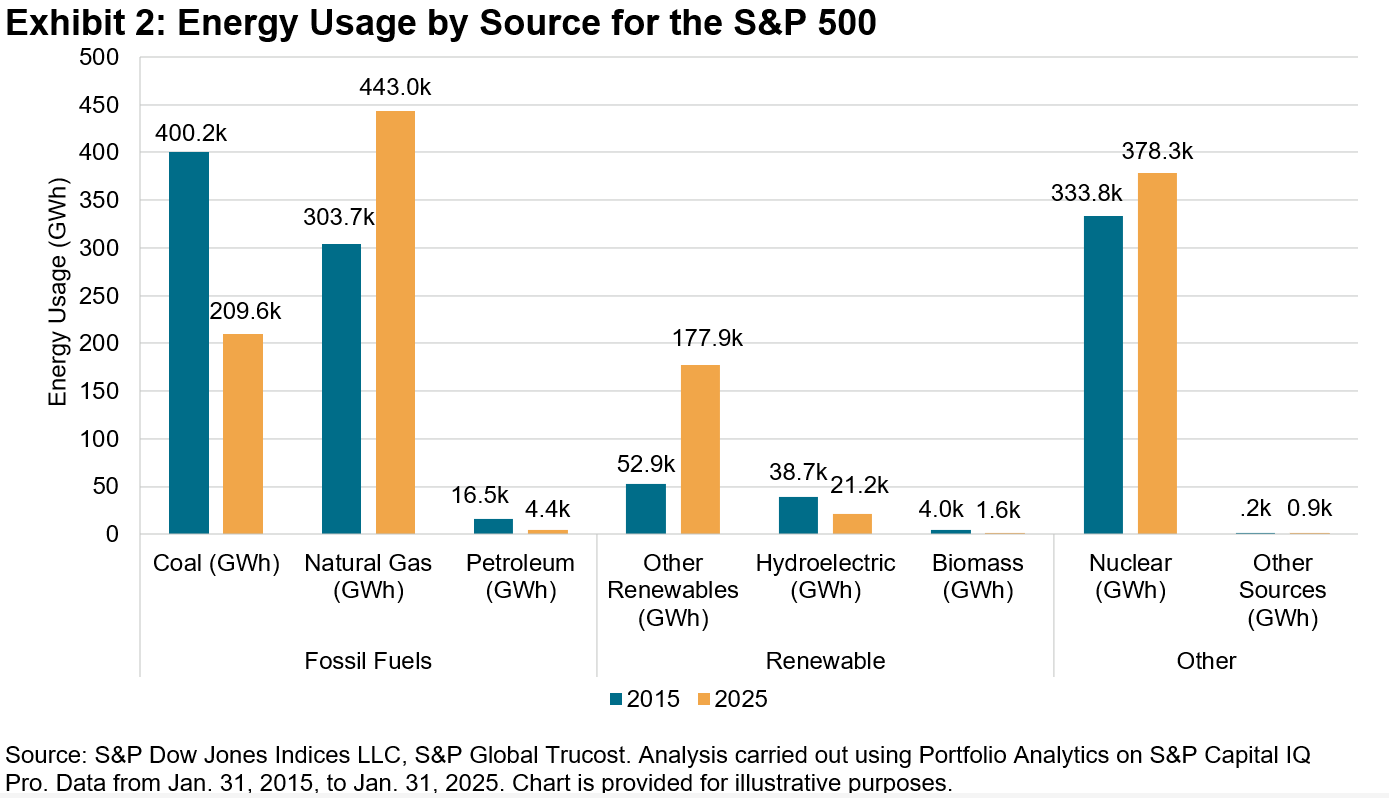
In contrast to the growth in renewables, the consumption of fossil fuel-based energy—consisting of coal, petroleum and natural gas—has declined by 8.8% within The 500, with petroleum usage nearly reduced to a quarter of its previous level, dropping from 16.5k GWh to 4.4k GWh (see Exhibit 2). This transition toward cleaner energy may be indicative of a market that is adapting to new economic conditions and embracing innovation.
In summary, the energy transition appears to be affecting S&P 500 constituents, and this serves as an indicator of how decarbonization is reshaping market dynamics. The insights derived from observing the The 500 during this transformative phase underscore the path the world is on as the energy landscape continues to evolve. For those interested in further examining the carbon metrics and fossil fuel reserves associated with S&P DJI’s indices, additional details can be found in the Sustainability Index Dashboard.
1 Analysis carried out using Portfolio Analytics on S&P Capital IQ Pro.
The posts on this blog are opinions, not advice. Please read our Disclaimers.