


Explore the dynamics that drove performance trends around the world in 2024 as well as the potential implications of all-time highs for market participants.
The posts on this blog are opinions, not advice. Please read our Disclaimers.The Market Measure
Tracking the Companies Feeding the World with Indices
2024 S&P U.S. Style Indices Rebalancing: Key Sector Shifts and Impacts
The King of the 21st Century Wears a Golden Crown
Duration Distress
The Market Measure
Tracking the Companies Feeding the World with Indices
How can an index-based approach help market participants to measure the evolution of global food production? Learn more about the S&P Commodity Producers Agribusiness Index and how it tracks the companies that help feed the world’s growing population.
The posts on this blog are opinions, not advice. Please read our Disclaimers.2024 S&P U.S. Style Indices Rebalancing: Key Sector Shifts and Impacts

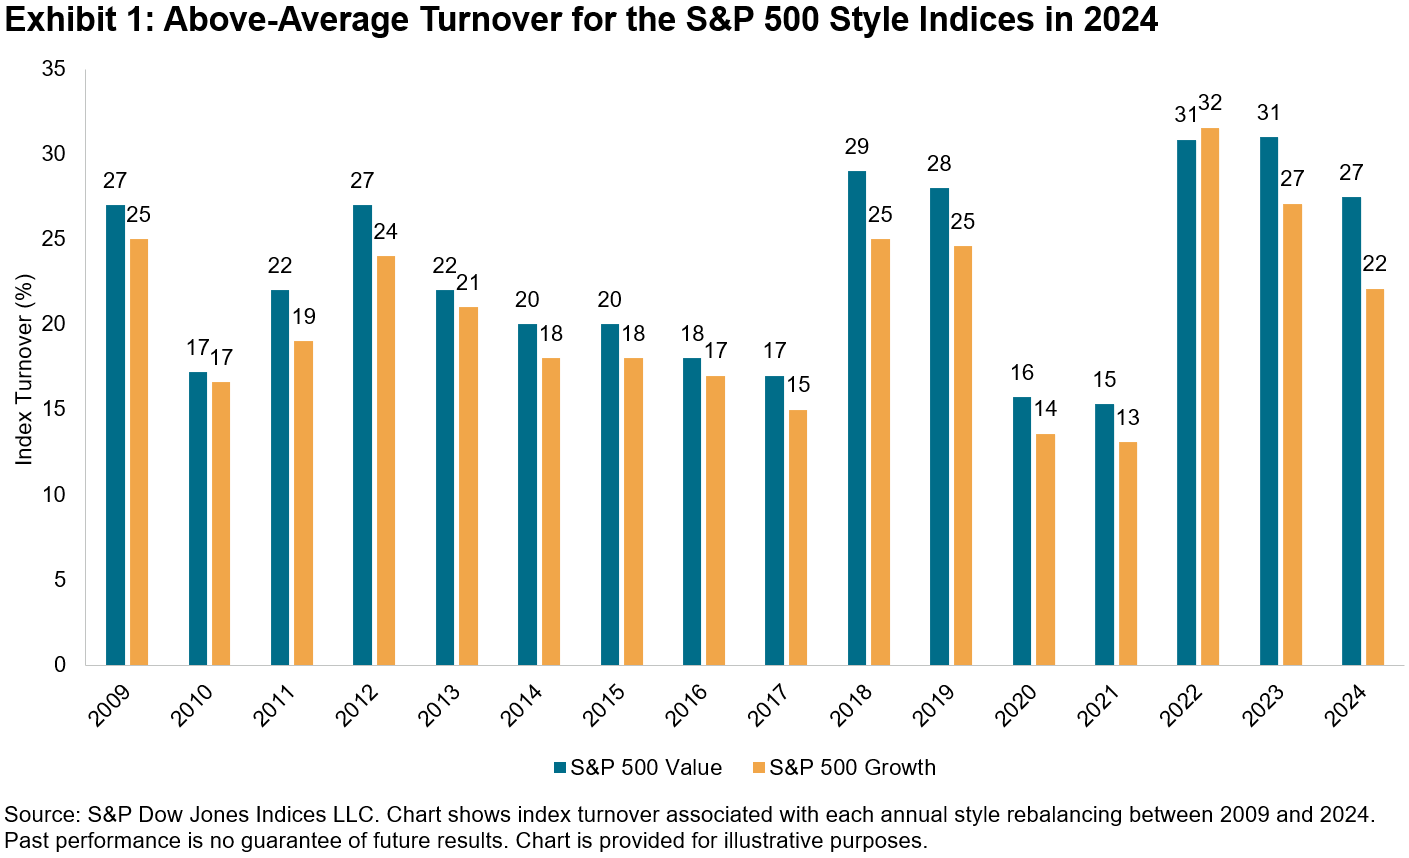
The S&P U.S. Style Indices underwent their annual rebalancing in December 2024, leading to significant changes in sector exposures. Particularly, the S&P 500 style reclassification led to above-average turnover, as shown in Exhibit 1. While the S&P 500 Growth’s turnover was not unusual, the S&P 500 Value’s turnover was relatively high compared to the historical average of 23%.
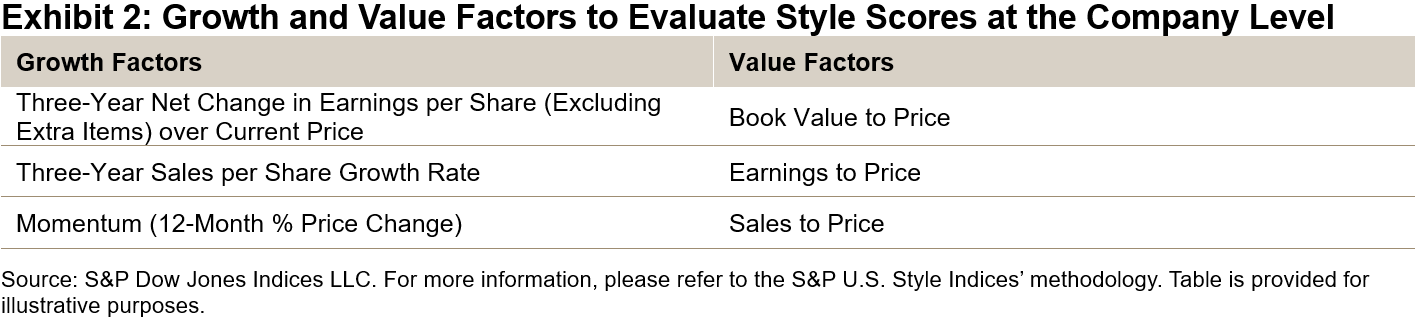
The S&P U.S. Style Indices’ methodology aims to divide the market capitalization of the underlying index roughly equally into growth and value indices. Style scores are calculated for each company based on three factors to measure growth and value, as listed in Exhibit 2. The most growth-oriented companies are placed in the growth basket until it represents 33% of the underlying index’s market cap. The same applies to the value basket. The remaining 34% form the blended basket, which has similar growth and value traits.
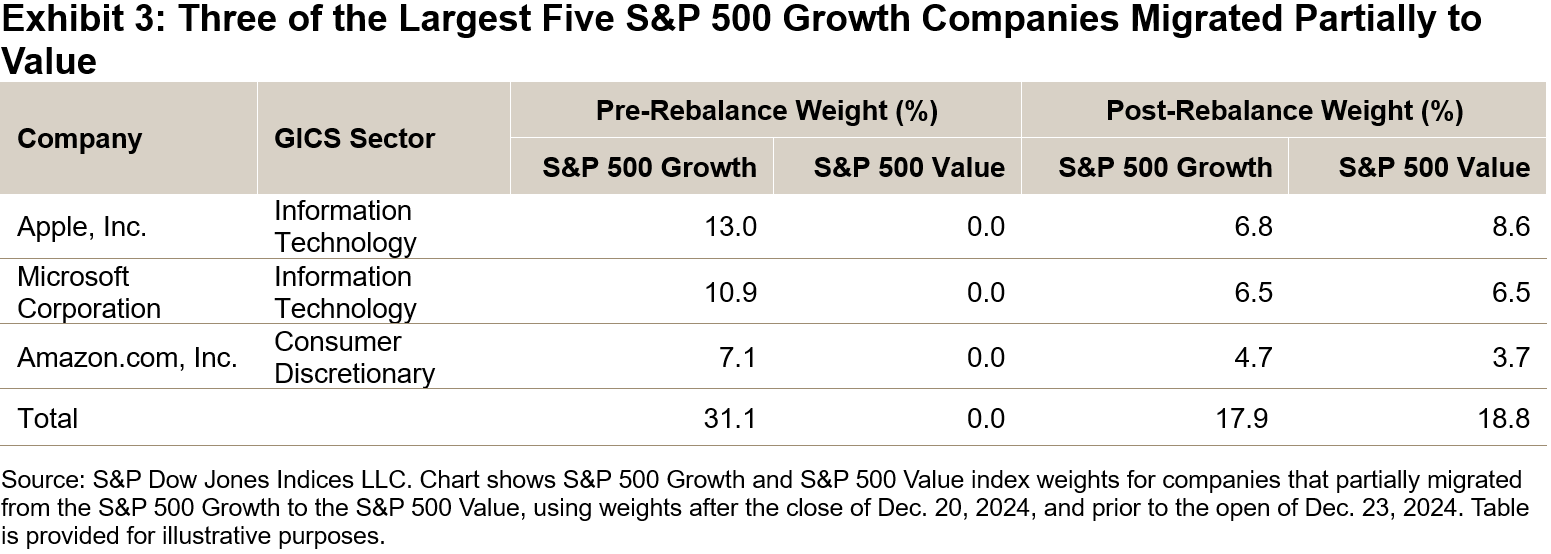
 Notably, three of the five largest S&P 500 Growth companies pre-rebalancing—Apple, Microsoft and Amazon (representing 31.3% of the S&P 500 Growth’s weight)—moved to the blended basket. These companies migrated due to a decline in their Growth Score: Apple ranked lower in sales growth and earnings growth relative to the underlying index (the broader basket), while Amazon and Microsoft experienced declines in earnings growth and sales growth relative to the growth basket. Only Microsoft ranked lower in momentum relative to the broader basket.
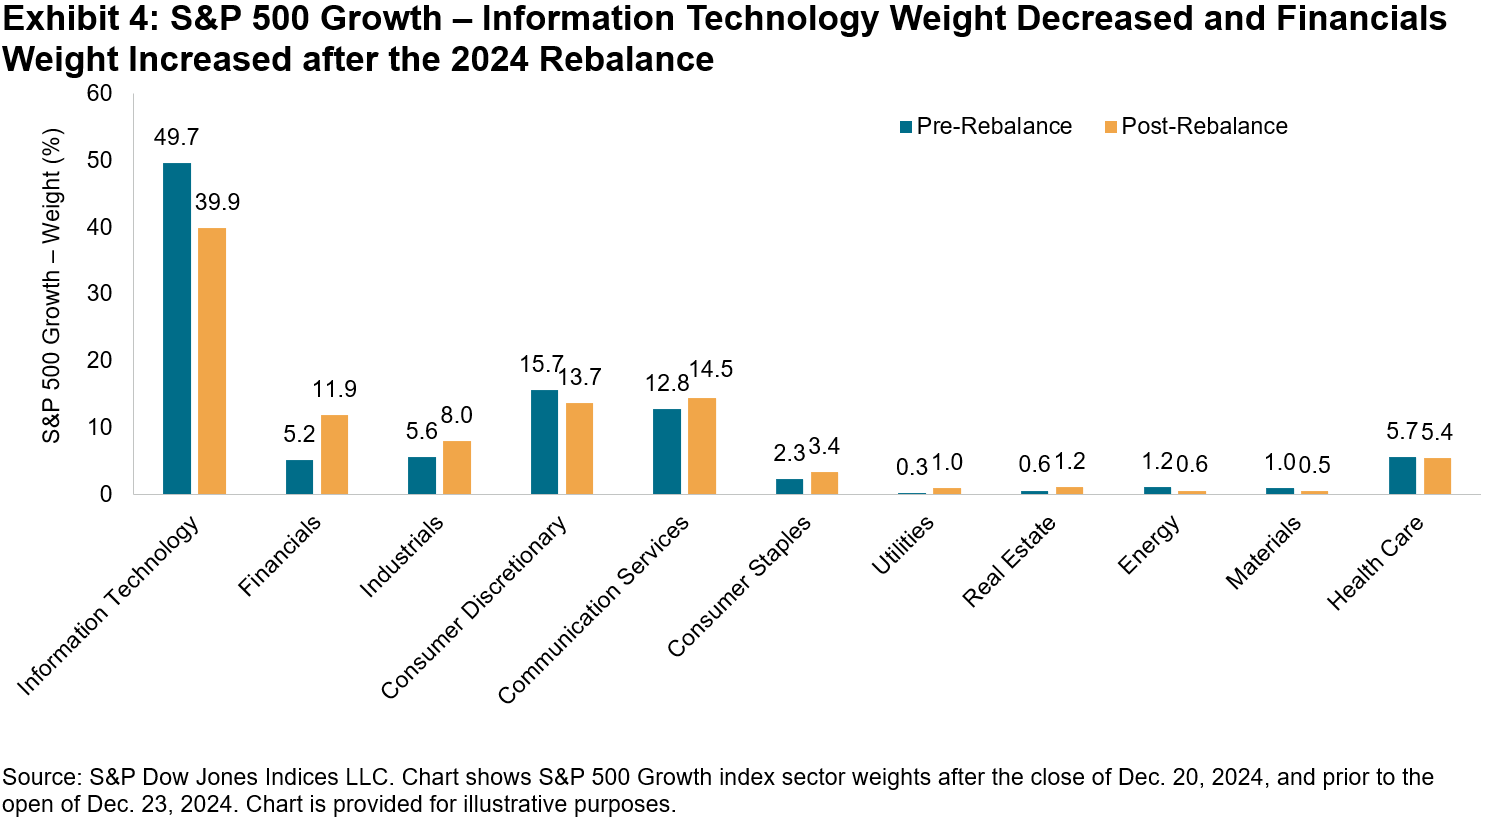
At the sector level, Exhibits 4 and 5 show that the Information Technology and Financials sectors experienced the most significant changes, followed to a lesser extent by Industrials and Consumer Discretionary. For the S&P 500 Growth, Information Technology decreased from 49.7% to 39.9%, while Financials increased from 5.2% to 11.9%. Historically, this index has been Information Technology-heavy, but its Information Technology weight prior to the latest rebalance reached levels not seen in the past 15 years. The Financials weight almost doubled compared to the historical average of 6%.
In contrast, the S&P 500 Value saw its Information Technology weight roughly triple from 7.9% to 24.8%, while its Financials weight decreased from 25.2% to 15.3%. The index currently has its highest Information Technology weight following the rebalance, while its Financials weight dropped to relatively low levels compared to the historical average of 22% over the past 15 years.
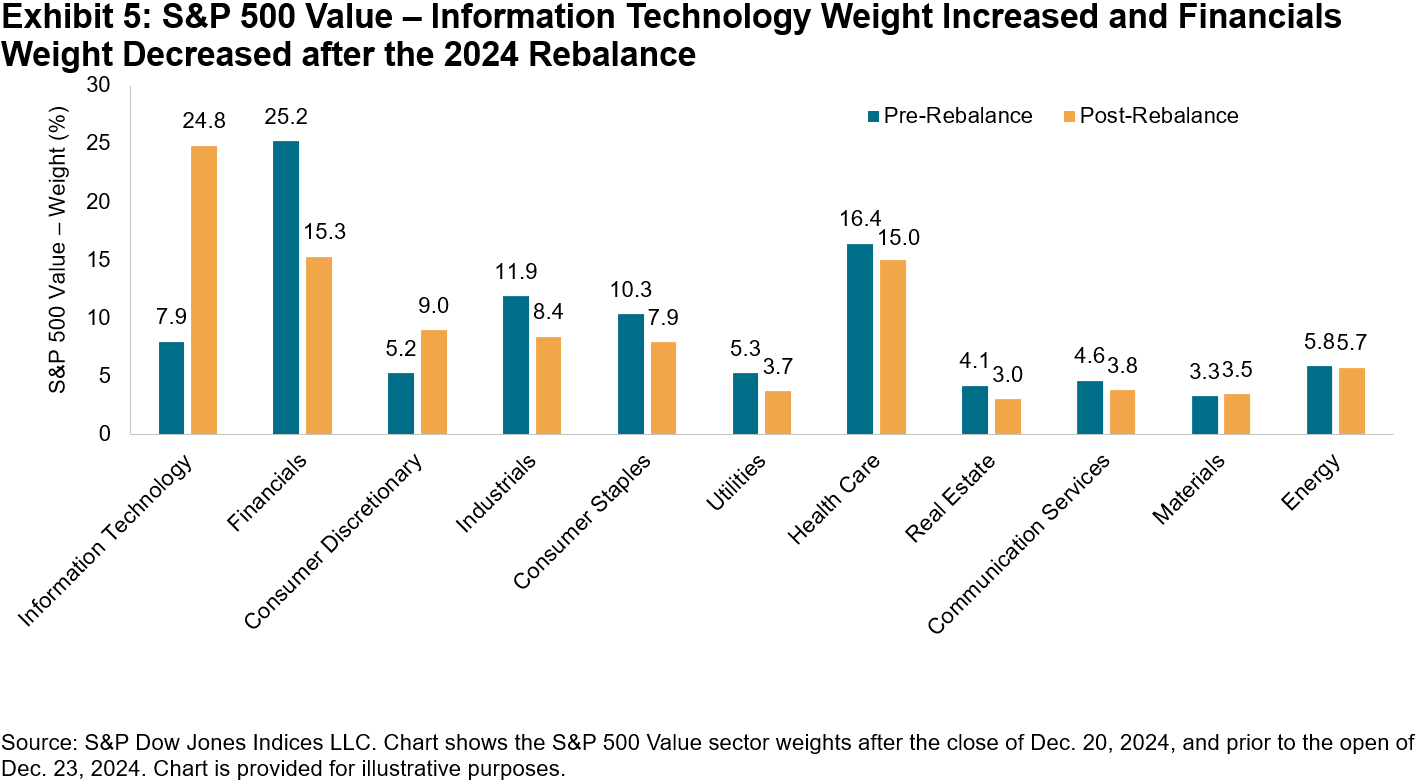
Financials companies ranked high in book value to price and earnings to price, but 30% also ranked high in sales growth and momentum. This caused some companies to move from the value index to the blended basket, increasing their weight in the S&P 500 Growth by 4.1% and decreasing their weight in the S&P 500 Value by 6.0%. Additionally, companies that moved from the blended basket to the value basket resulted in a 2.6% weight increase in the S&P 500 Growth and a corresponding decrease in the S&P 500 Value.
The 2024 S&P U.S. Style Indices’ annual rebalancing led to significant sector shifts, particularly in the Information Technology and Financials sectors of the S&P 500 Growth and S&P 500 Value. These adjustments highlight the dynamic nature of the style indices and how market conditions can affect their composition, ensuring the indices accurately reflect the evolving market landscape.
The posts on this blog are opinions, not advice. Please read our Disclaimers.The King of the 21st Century Wears a Golden Crown

- Categories Commodities
- Tags 2025, commodities, gold, S&P GSCI Gold, S&P GSCI Gold Covered Call
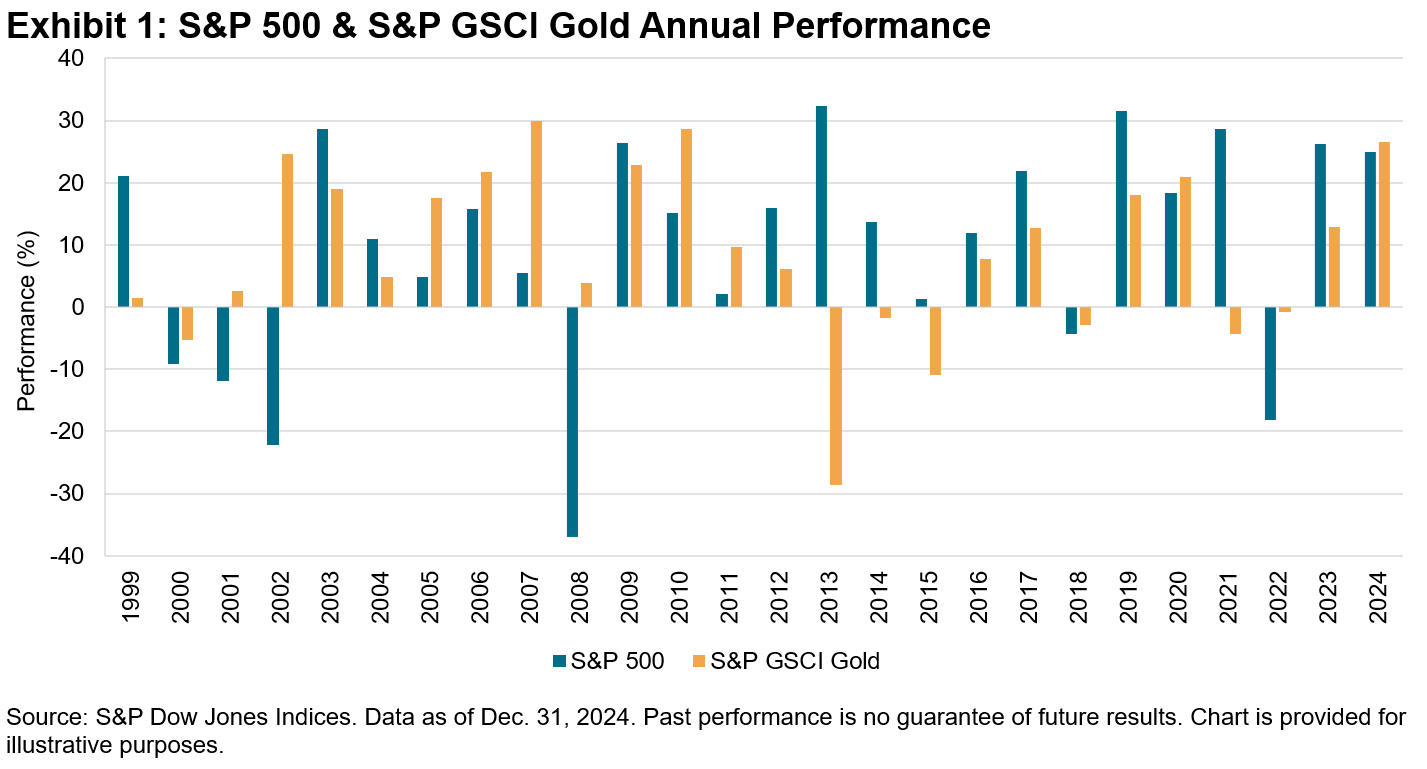
Once again, gold has taken the crown as the best-performing asset in the 21st century. From the turn of the century to year-end 2024, the S&P 500® recorded an annualized return of 7.7%, while the S&P GSCI Gold recorded 8.5% annually. While besting stocks for a quarter century, gold is still considered a safe-haven asset, especially during periods of economic uncertainty. However, 2024 highlighted how gold can also perform well during bull markets. The S&P GSCI Gold and S&P 500 posted supersized returns for the year, topping 26.6% and 25%, respectively.
In this post, we look at how the S&P GSCI Gold performed during up and down markets to better understand how it sustained long-term outperformance this century, while also maintaining its safe-haven reputation. Lastly, we expose how gold’s lack of income generation could be the chink in its (golden) armor. However, deploying popular index-based strategies, we discuss the possibility of generating income through the gold derivatives market.
Gold in an Up Market
In a thriving economy, gold may serve as a hedge against inflation and currency devaluation. For instance, during the 2000s, as the S&P 500 experienced substantial gains, gold prices also steadily increased, driven by rising demand from emerging markets and geopolitical tensions. Following the dot-com crash, equity markets rebounded, with the S&P 500 increasing 82% from 2002, trending upward until the next downturn in 2007. During that same time, the S&P GSCI Gold outperformed stocks, increasing 132%. Gold rose 30% between 2010 and 2020 but did not keep pace with the equity market after the Global Financial Crisis, but there have been more recent examples of gold outperformance since. Like the dot-com era, technology stocks have recently helped push the S&P 500 to all-time highs. Gold not only kept pace in 2024, it outperformed the market by 160 bps.
Gold in a Down Market
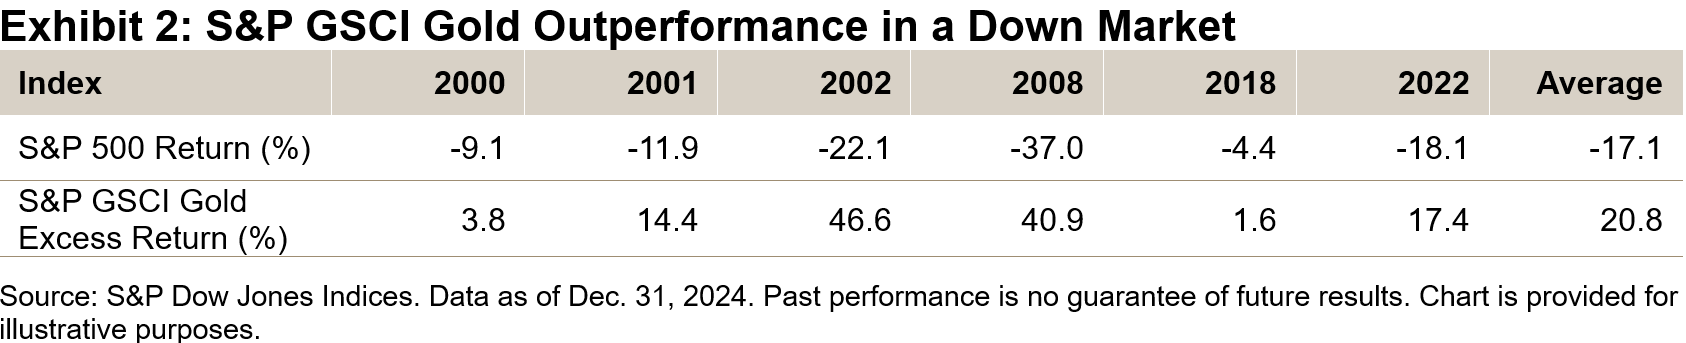
Conversely, in a downturn, such as the dot-com bubble burst in the early 2000s, gold has often shone as a refuge. During this period, the S&P 500 plummeted, while the S&P GSCI Gold surged as investors flocked to its perceived safety. From 1999-2002, the S&P 500 fell by 38%, but the S&P GSCI Gold rose 21%, demonstrating gold’s effectiveness as a protective asset. During the Global Financial Crisis, the S&P 500 fell 34% during 2007-2008, while the S&P GSCI Gold rose 34%, outperforming stocks by 6,800 bps of excess return during that period. In the past six calendar years when the S&P 500 produced a negative return, S&P GSCI Gold outperformed by an average of 20.8%.
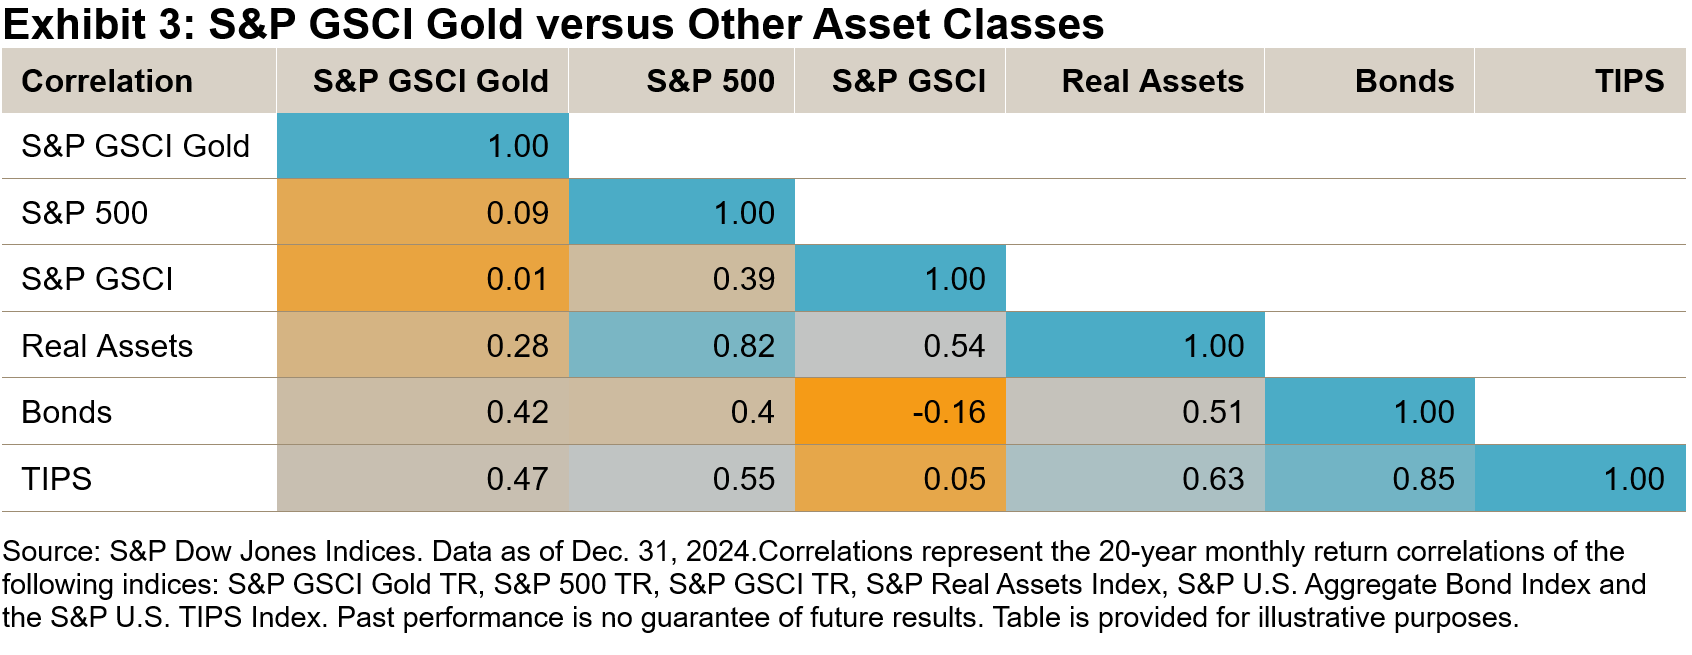
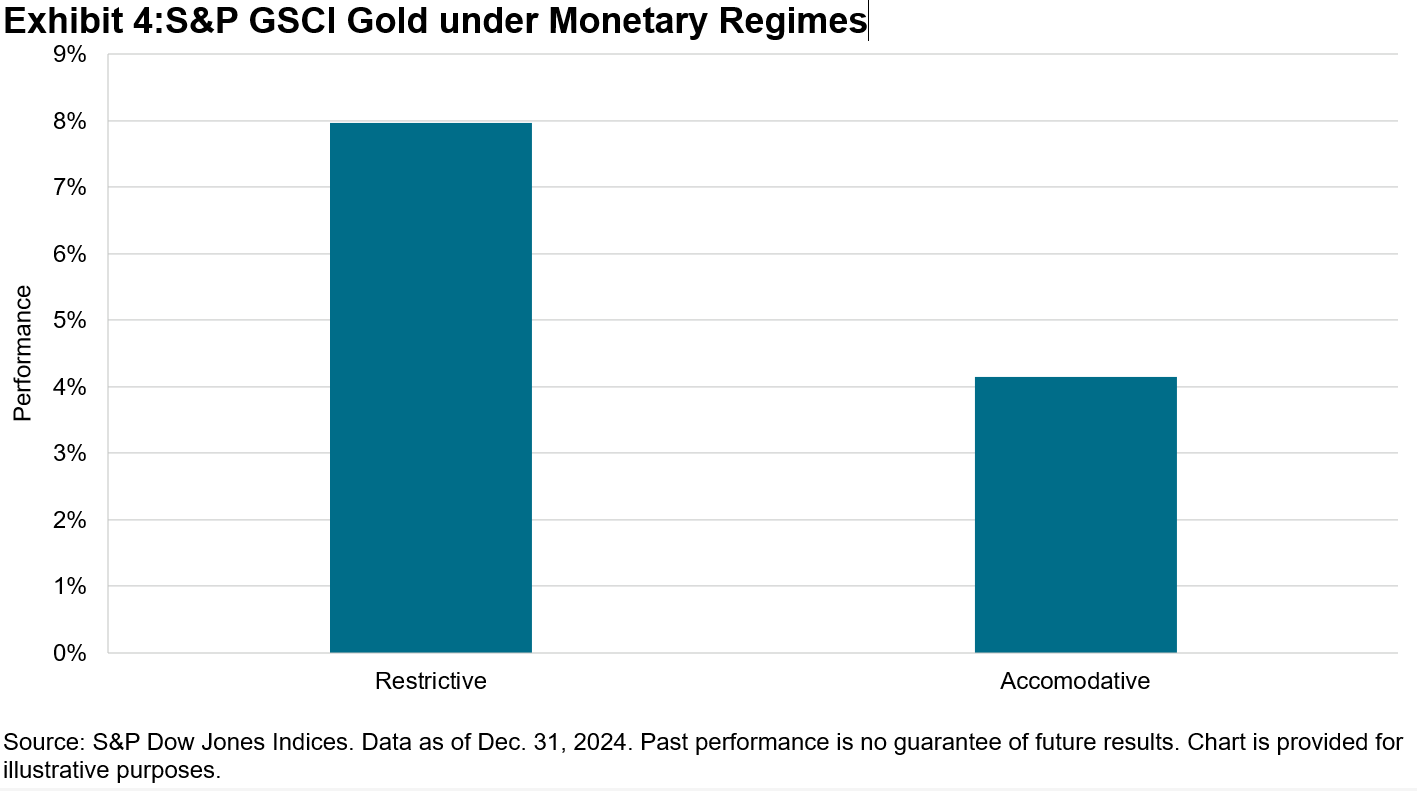
Historically, gold has tended to retain value during economic downturns, providing a cushion against stock market volatility; however, it has also performed well during inflationary periods, preserving purchasing power. Adding gold to a multi-asset strategy may reduce overall risk and volatility, owing to its low correlation with other asset classes (see Exhibit 3). It has also demonstrated relative out-performance when the Fed maintains a restrictive monetary stance (see Exhibit 4).
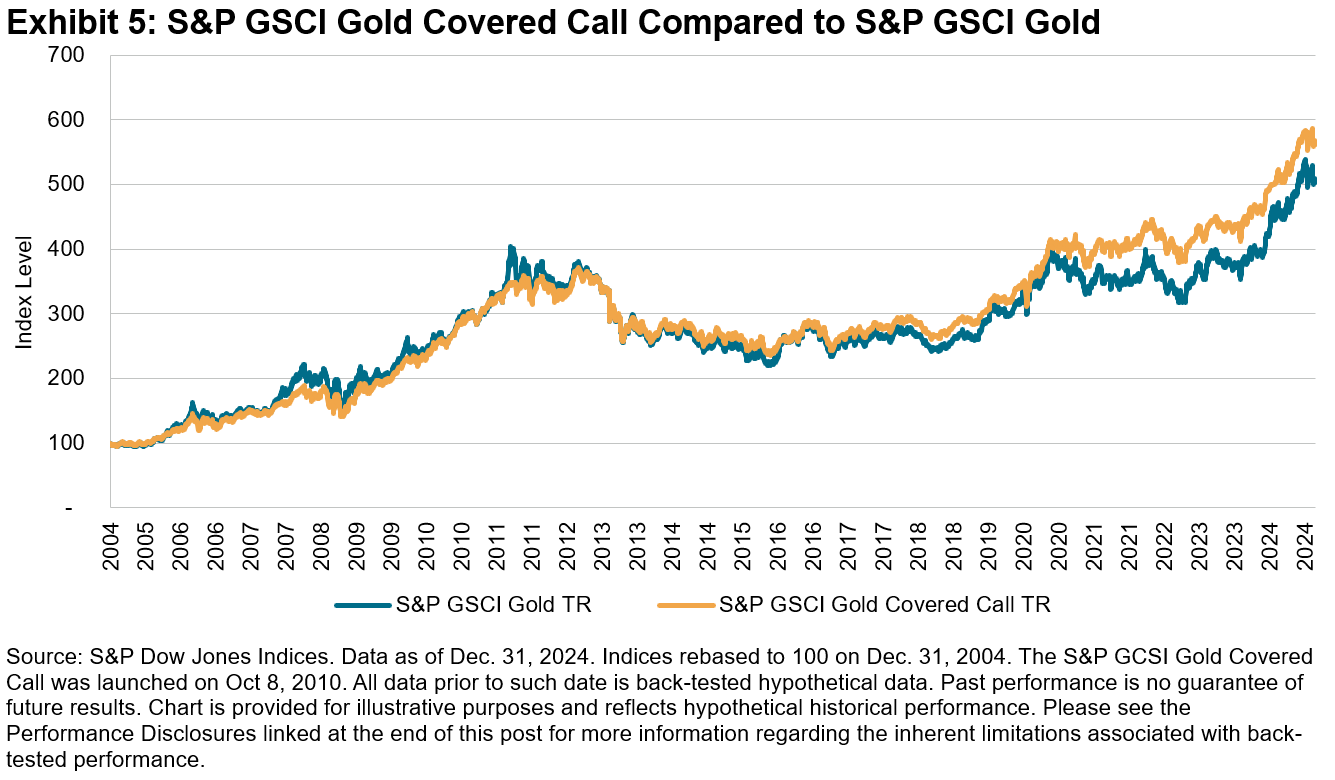
One of the drawbacks to the S&P GSCI Gold is the lack of income generation. After all, gold is an “unproductive” asset that produces no income and creates zero shareholder value. However, employing a covered call strategy like the S&P GSCI Gold Covered Call has the potential to create a synthetic income stream, and the index has shown positive excess return over time. The S&P GSCI Gold Covered Call had excess return compared to the S&P GSCI Gold over the period from 2004 to 2024.
Looking ahead, factors such as global economic uncertainty, inflationary pressures and geopolitical tensions may drive demand for gold. Central banks around the world have pursued policies to “de-dollarize” and have increased gold holdings as part of their reserves, supporting its price. Gold’s role as a potential diversifier and hedge against economic instability could make it an important component of a well-rounded strategy.
The posts on this blog are opinions, not advice. Please read our Disclaimers.Duration Distress

We’ve written previously about the traditional sources of excess return for fixed income active managers, one of which is taking on higher term or interest rate risk. 2024 witnessed a sharp reversal in the excess returns from term risk, as long duration tilts that would have rewarded managers in 2023 hurt them in 2024. A key reason for this reversal was the dramatic rise in long-term yields, one of the consequences of which has been a steepening of the U.S. Treasury yield curve.
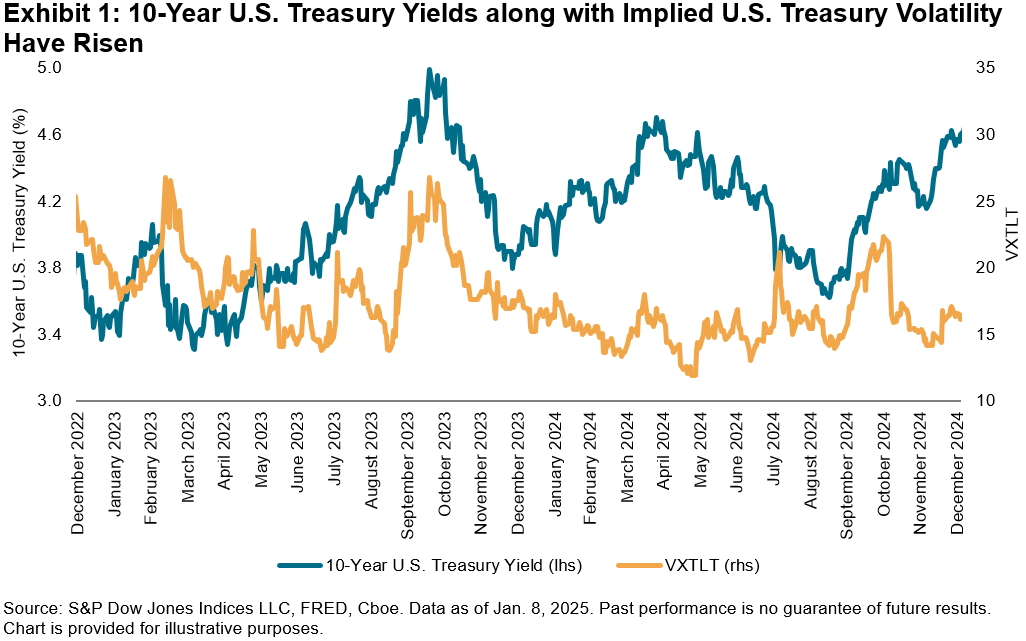
As a result, all eyes have been on the 10-year U.S. Treasury yield, which has whipsawed over the past year, rising above 4.7% as of Jan. 8, 2025, reaching levels last seen in April 2024 and close to the peak from October 2023. The surge in yields leading into and following the U.S. presidential election has been driven by a myriad of factors including robust economic growth and inflation concerns, as well as the U.S. Federal Reserve’s hawkish signaling on Dec. 18, 2024, of fewer-than-expected rate cuts in 2025.
Related to duration or interest rate risk, one way we can assess bond market nervousness is through market expectations for long-dated U.S. Treasury volatility, as reflected by the options market with the Cboe 20+ Year Treasury Bond ETF Volatility Index (VXTLT). VXTLT movements have generally paralleled the rise in U.S. Treasury yields over the past couple of years, reaching a high above 22 on Oct. 31, 2024, ahead of the election. Exceptions included turbulent days, such as the unwind of the global carry trade on Aug. 5, 2024, when yields plunged as investors sought the safety of U.S. Treasuries and VXTLT spiked to over 20. The index has risen since early December 2024 to 17.51 as of Jan. 8, 2025, perhaps driven by market unease over the election results and associated tariff policies, the Fed’s future rate trajectory, as well as inflation.
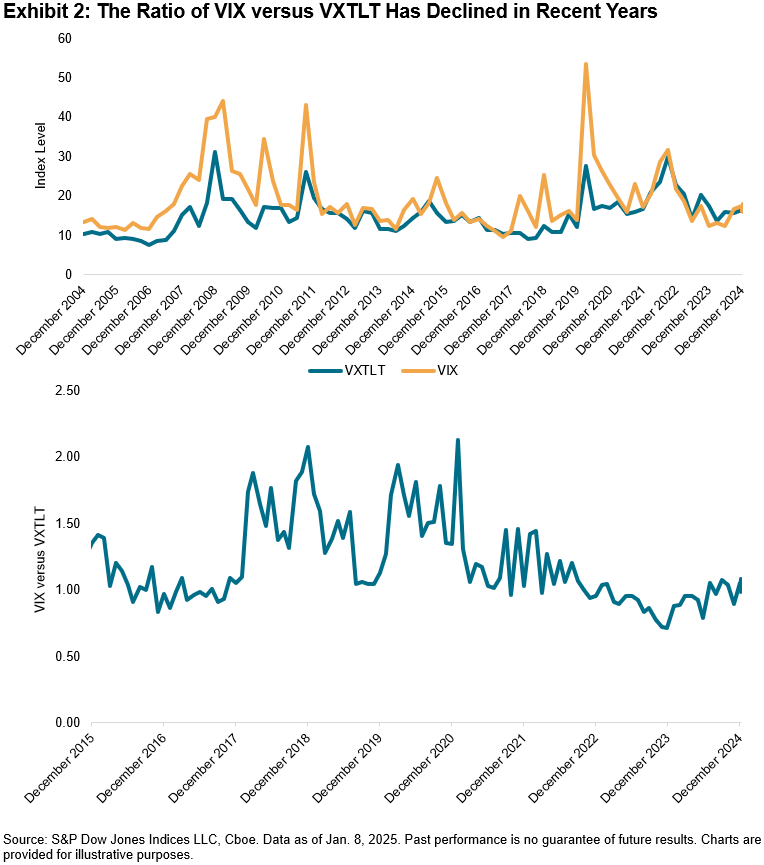
But how does the volatility of the bond market compare to that of the equity market? The first chart in Exhibit 2 shows that VXTLT levels typically have sat below those of the Cboe Volatility Index® (VIX®), a widely known measure of expected equity market volatility. However, while there was a small tick upward in 2024, the differential between the two has generally declined since 2020, as portrayed by the second chart in Exhibit 2, which calculates the ratio in VIX compared to VXTLT. Notable catalysts include uncertainty stemming from the pandemic and Fed rate hikes beginning in 2022 driving up bond implied volatility, coupled with relatively low equity implied volatility.
Coming off a rollercoaster 2024, as we look ahead to the Fed’s January 2025 meeting and a new presidential regime, the future path of U.S. Treasury yields may have important implications for multi-asset and fixed income asset managers and asset owners when thinking about their risk profiles.
The posts on this blog are opinions, not advice. Please read our Disclaimers.