Get Indexology® Blog updates via email.

In This List

Shifting Equity Sensitivities with S&P 500 Sectors

The Global Equity Landscape: Struggles and Surprises in 2024

Diversifying Exceptionalism

Rebalance Review of the S&P Global Clean Energy Index – H2 2024

A Balanced Approach: Inside the S&P 500 Equal Weight Index

Shifting Equity Sensitivities with S&P 500 Sectors

Contributor Image
Sherifa Issifu

Associate Director, Global Exchanges

S&P Dow Jones Indices

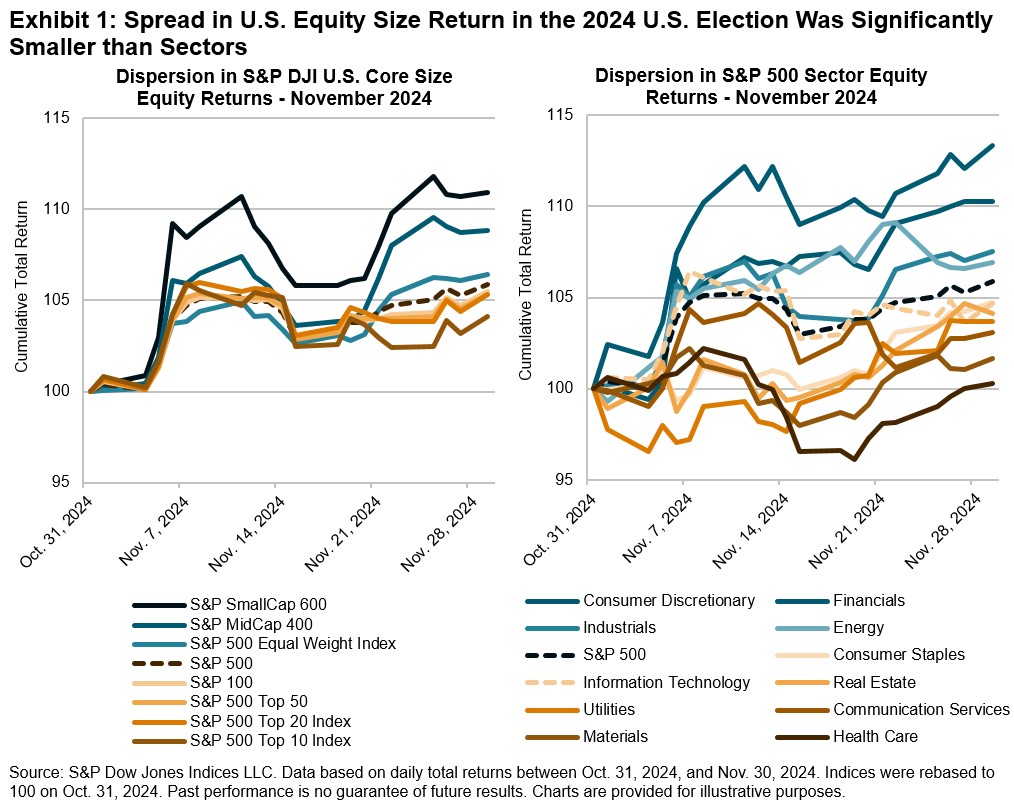
Broad-based benchmarks such as the S&P 500® and S&P SmallCap 600® demonstrated an upbeat response to the U.S. presidential election, rising 6% and 11%, respectively, in November 2024. The spread in U.S. size segments was more muted relative to S&P 500 sectors.  Exhibit 1 presents the November 2024 cumulative total return of the S&P 500 versus different U.S. equity size indices on the left-hand side and, on the right, compared to its 11 GICS® sector subindices.

Following the U.S. election, sector returns showed considerable divergence. While all 11 sectors ended November in positive territory, they had very different paths, with Health Care among the laggards, ending the month with a gain of only 0.3%. In contrast, more domestically focused sectors such as Financials, Industrials and Energy were among the outperformers, just behind Consumer Discretionary. This higher dispersion created opportunities for both outperformance and underperformance for those willing to examine U.S. equity performance closely.

The S&P 500’s GICS sectors can deviate significantly from both the performance and characteristics of the S&P 500. When examining which sectors derive most of their revenue domestically, Utilities and Information Technology (IT) are on opposite ends of the spectrum. Exhibit 2 shows that, in aggregate, companies in the S&P 500 Utilities derive nearly all of their revenues domestically at 98%, while IT is the only sector that derives over 50% of its revenue from outside the U.S.

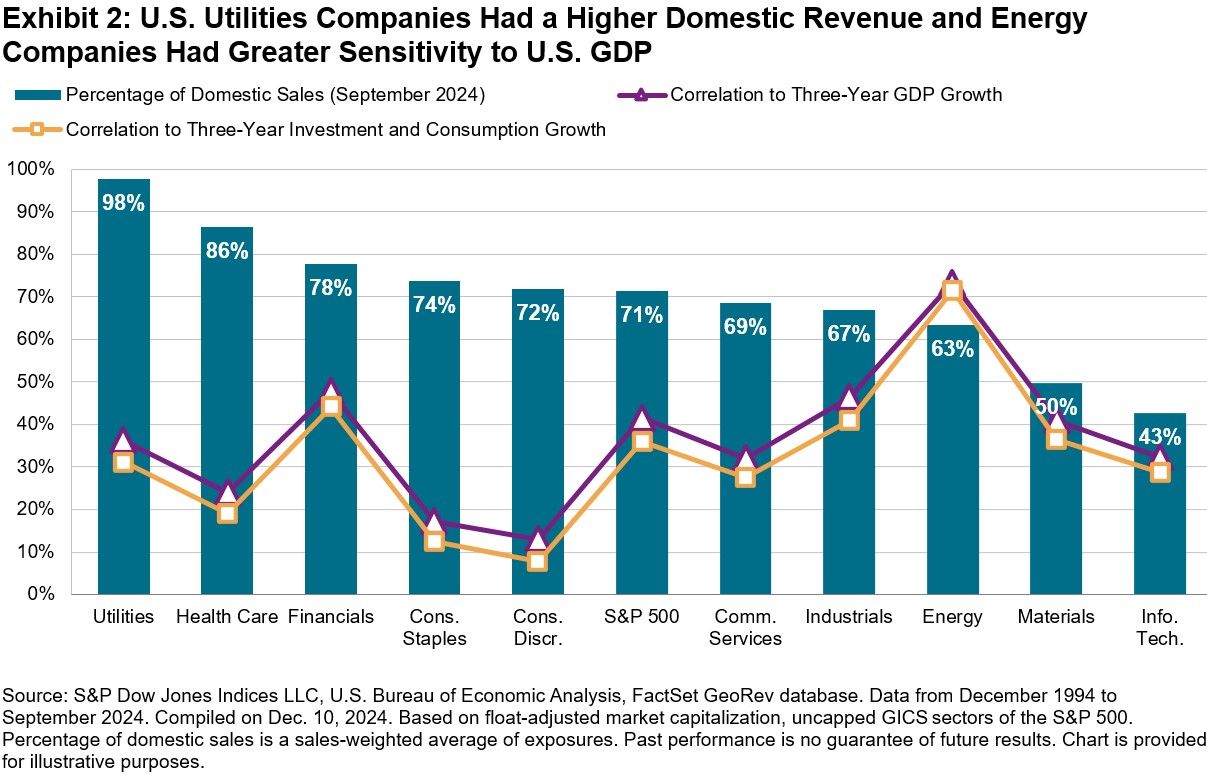
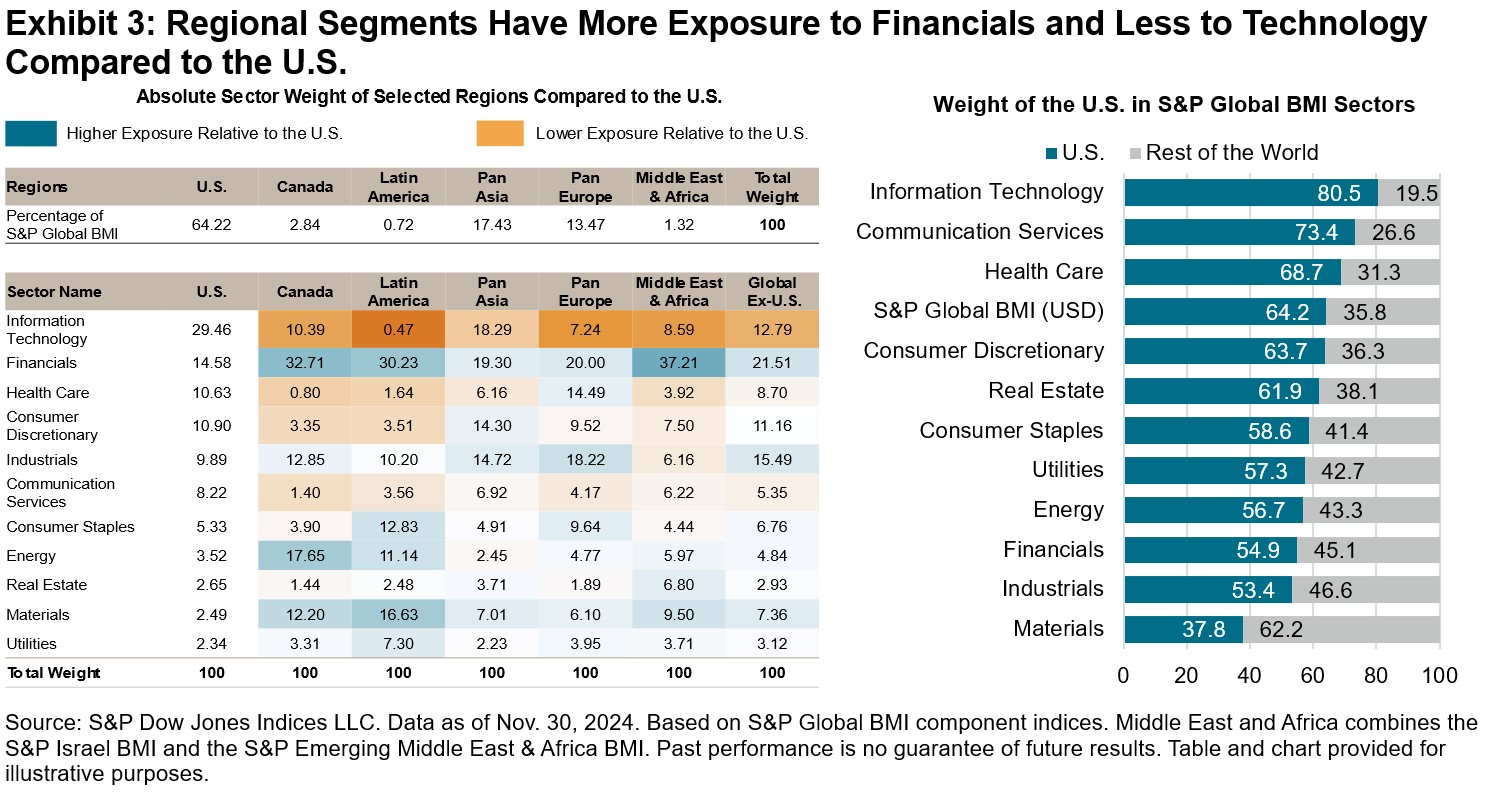
Traditionally, market participants have tended to have higher exposure to domestic biases and thereby sectors that align with their regional bias. Exhibit 3 highlights that the largest sector weights in various regions are to “traditional” economy sectors: in Europe, it is Industrials; in the Middle East and Africa, it is Financials; and in Latin America, it is Materials. Some of those “traditional” economy sectors (such as Financials and Industrials) tend to derive more of their revenues domestically. In contrast, the U.S. Information Technology sector derives more of its revenues internationally, with the inclusion of mega-cap tech companies like Apple and Microsoft (see Exhibit 2).

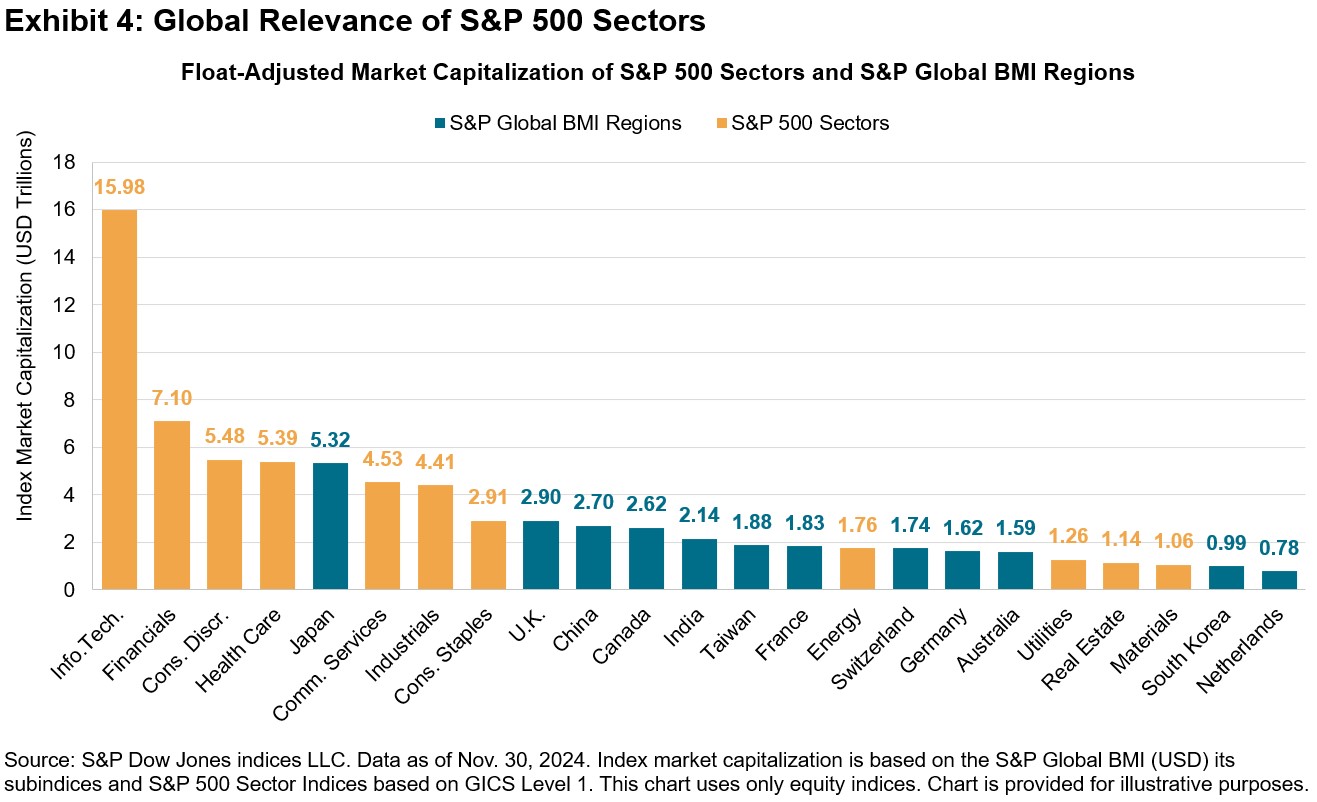
The market capitalization of many individual U.S. sectors is also equal to the entire opportunity set of individual regional stock markets. Exhibit 4 demonstrates that the S&P 500 Information Technology sector is larger than China, while U.S. Financials is similar in size to Japan’s entire equity market.

The size of U.S. sectors in any equity allocation decision could be as important as country exposures when looking at the sheer size of the segments. As a result, S&P 500 sectors may be a useful tool for market participants interested in exposure to sectors of varying sensitivity to the U.S. economy while also adding different geographical revenue exposures to their strategies. With the U.S. making up such a significant portion of global sectors, S&P 500 sectors could arguably help to reduce “home bias.”1

1 “Home bias” here is defined as market participants having a larger exposure to domestic equities than their weight in a global equity opportunity set.


The posts on this blog are opinions, not advice. Please read our Disclaimers.

The Global Equity Landscape: Struggles and Surprises in 2024

Contributor Image
Benedek Vörös

Director, Index Investment Strategy

S&P Dow Jones Indices

U.S. equity markets enjoyed a great year in 2024, but the returns in many developed equity markets were found wanting in relative terms and, in many cases, absolute terms as well.

With just a few trading days left in 2024, the S&P Developed BMI has gained 22% YTD as of Dec. 13, 2024, with all but 3 of its 25 members lagging the benchmark. Five regions produced outright losses YTD, with Korea at the bottom of the list, down 18%. Of the remaining 20 markets, 10 produced returns in the single-digit percentages, and only 3 (the U.S., Singapore and Israel) were up over 20%.

Among developed markets, Japan not only kept up with the U.S. until the beginning of August, but it was even ahead until early May. On the back of this year’s gains, the local currency version of the S&P Japan BMI finally surpassed its prior all-time high recorded on Dec. 18, 1989. However, investors in the local market didn’t have long to celebrate.

In the beginning of August, the Bank of Japan surprised market participants with an unexpected monetary tightening at a time when the world’s other major central banks were already in easing mode. The Bank of Japan’s action triggered turmoil in capital markets around the world, with Japan at the epicenter. The Japanese yen had aggressive moves in both directions, and so did the S&P Japan BMI, which had its worst one-day loss ever on Aug. 6, 2024, falling over 12%, followed by its third-best day ever the next day as the Bank of Japan made a policy U-turn. Markets have calmed since the early August volatility, and the Japanese benchmark rebounded 24% from its Aug. 5 lows to show a YTD gain of 18%.

Investors in emerging markets had to contend with generally lower returns than those in developed markets, with the S&P Emerging BMI lagging the S&P World Index by 8% YTD. Emerging market investor attention this year has been focused on Asia’s two giants and their diverging economic and stock market fortunes. On the one hand, Chinese equities had been grinding steadily lower until mid-September, with the S&P China BMI PR down for the year as recently as Sept. 23, as the country’s economic growth sputtered.

The S&P India BMI, on the other hand, soared 26% over the same horizon, and, consequently, came within a whisker of overtaking China as the region with the largest weight within the S&P Emerging BMI. Since then, China’s weight in the emerging market benchmark rebounded together with local equities, which rose over 20% on the back of the government’s latest round of stimulus measures. However, doubts still remain about whether the latest policy actions will produce a lasting recovery in 2025 and beyond.

As we approach the end of 2024 and head into 2025, the contrasting performance patterns of various developed and emerging markets around the world underscore the complexities that investors may face, highlighting the need for careful analysis and strategic positioning in an ever-evolving global landscape of equity markets.

The posts on this blog are opinions, not advice. Please read our Disclaimers.

Diversifying Exceptionalism

Contributor Image
Anu Ganti

Head of U.S. Index Investment Strategy

S&P Dow Jones Indices

Despite recent sharp U.S. market declines after the Federal Reserve signaled fewer than expected rate cuts, much of recent year-end market commentary has been focused on U.S. exceptionalism and the divergence of U.S. equities compared to the rest of the world. The S&P 500® was up 24.8% YTD through Dec. 18, 2024, reaching 57 all-time closing highs so far this year, propelled by robust economic growth, AI-related enthusiasm and optimism surrounding President-elect Trump’s return.

Exhibit 1 shows that U.S. outperformance is not a new phenomenon. The S&P 500 has significantly outperformed the rest of the world over the past fifteen years, with a cumulative return of 887% since Dec. 31, 2008, compared to an equivalent return of 320% for the S&P World Ex-U.S. Index.

We’ve noted previously that concentration trends can manifest at a country level. As a result of its outperformance, the weight of the U.S. component of our S&P World Index has risen accordingly from roughly 50% in 2009 to over 70% currently. Meanwhile, the U.S. dollar has strengthened in tandem, as illustrated by Exhibit 2, which may create potential headwinds for large-cap multinational companies that tend to have more overseas revenue exposures and tailwinds for smaller, more domestically sensitive stocks.

Turning our attention across the capitalization spectrum, the outperformance of U.S. equities broadened beyond large caps during the second half of the year, thanks to additional catalysts beyond dollar strength, including Fed rate cuts and post-election enthusiasm for potential impending tariff policies that may benefit smaller caps. Although mega caps have returned to favor so far in December, the S&P MidCap 400® and the S&P SmallCap 600® have outperformed the S&P 500 by 2.6% and 5.2%, respectively, since July 9, a key turning point for U.S. markets, as investors began to shift away from the Magnificent 7 and other mega caps toward smaller companies.

In addition to their stellar outperformance, U.S. equities are interesting to analyze for their diversification potential. In Exhibit 4, we calculate the spread in trailing 12-month volatility between the S&P World Index and S&P World Ex-U.S. Index. When this spread is positive, the inclusion of the U.S. increases volatility in the benchmark; when negative, the country acts as a diversifier. The negative spread that has occurred so far this year is an indication that the U.S. has become a volatility diversifier,1 consistent with the divergent performance observed earlier.

As we look ahead to 2025, while we do not know whether the U.S. market rally will be sustained or if smaller caps will maintain their momentum, we can acknowledge that if the outperformance of the U.S. compared to the rest of the world continues, the associated diversification properties may have important consequences for asset owners globally.


1We do acknowledge that the U.S. makes up more than 70% of the weight in the S&P World Index, but caveat that the U.S. component includes exposure to large multinational companies that have a diverse revenue base across geographies.

The posts on this blog are opinions, not advice. Please read our Disclaimers.

Rebalance Review of the S&P Global Clean Energy Index – H2 2024

Contributor Image
Abbie Zhang

Senior Analyst, Thematic Indices

S&P Dow Jones Indices

Launched in 2007, the S&P Global Clean Energy Index has been a headline benchmark for measuring clean energy-related companies’ performance over the past 16 years. In April 2021, we launched the S&P Global Clean Energy Select Index to measure the 30 largest companies in global clean energy businesses listed on developed market exchanges.

Both indices had their semiannual rebalances on Oct. 18, 2024. The index methodology categorizes companies into four exposure score buckets ranging from 0 to 1, with a 0.25 increment, to measure their clean energy business purity. Exhibits 1 and 2 show the change in exposure before and after the October rebalance for both indices. For the S&P Global Clean Energy Index, the weighted average exposure score of the index increased slightly from 0.92 to 0.93. The S&P Global Clean Energy Select Index consists of 30 companies with an exposure score of 1 listed in the developed market exchanges (see Exhibit 2).

In the market allocation breakdown, significant changes in the S&P Global Clean Energy Index following the rebalance include a 6.41% increase in the weight of the U.K. and a 2.13% increase for Brazil, alongside an 8.80% decrease for the U.S. Meanwhile, for the S&P Global Clean Energy Select Index, Portugal’s weight rose by 4.04%, while the weights of South Korea and Brazil experienced declines of 3.11% and 2.92%, respectively.

The S&P Global Clean Energy Index and the S&P Global Clean Energy Select Index track both the performance of clean energy technology firms and clean power generation companies (see Exhibit 3). During the recent rebalance, the index weight of clean technology in the S&P Global Clean Energy Index increased, primarily driven by a 1.12% rise in the index weight for the FactSet Revere Business Industry Classifications System (RBICS) subindustry of Wind Energy Equipment Manufacturing. Conversely, the index weight for clean power generation decreased, largely due to a 7.4% weight decrease in the RBICS subindustry of United States Northeast Electric Utilities.

The composition change of the S&P Global Clean Energy Select Index was different, featuring a decrease in clean technology weight alongside an increase in clean power generation weight. Within clean technology, there was a 3.39% drop in the RBICS subindustry of Photovoltaic and Solar Cells and Systems Providers. Meanwhile, clean power generation saw a 3.3% increase in the RBICS subindustry of Europe Mixed Alternative Wholesale Power and a 1.6% rise in the RBICS subindustry of Europe Solar Wholesale Power.

The inclusion or exclusion of constituents within the S&P Global Clean Energy Select Index could be a result of the change on exposure score, or it could be due to the market movements that changed the relative float market capitalization ranking of companies within the S&P Global Clean Energy Index. For exposure score information, please refer to S&P DJI’s Client Resource Center.

S&P Global Clean Energy Index Performance YTD in 2024

Underperforming the S&P Global BMI YTD, the S&P Global Clean Energy Select Index was down 25.78% and the S&P Global Clean Energy Index was down 19.93% in USD total return terms. Dispersion was high among constituents of the S&P Global Clean Energy Index. SolarEdge Technologies (-83.12%), Shoals Technologies (-66.41%) and Hanwha Solutions Corporation (-61.58%) were among the lagging performers, while Suzlon Energy (up 61.24%) and NHPC (up 23.55%) made positive contributions, partially offsetting some of the losses.

We recently published the paper “Navigating the Clean Energy Transition: Market Dynamics and Performance Insights,” which delves into the market dynamics around the clean energy transition. The paper outlines the energy transition process, provides an overview and performance review of the S&P Global Clean Energy Indices, discusses ongoing policy support for the energy transition and presents a quantitative analysis of performance. For those seeking a deeper understanding of these topics, the paper offers valuable perspectives on the current state and future potential of the clean energy transition.

The posts on this blog are opinions, not advice. Please read our Disclaimers.

A Balanced Approach: Inside the S&P 500 Equal Weight Index

How can an equal weight approach to U.S. equities help to address concerns around mega-cap concentration? S&P DJI’s Anu Ganti and CME Group’s Joe Hickey explore the S&P 500 Equal Weight Index’s historical performance trends and its potential applications for market participants seeking enhanced diversification.

The posts on this blog are opinions, not advice. Please read our Disclaimers.