


How can the trading ecosystems surrounding indices help to foster transparency and market efficiency? S&P DJI’s Joe Nelesen and Tim Edwards explore why index liquidity matters and how the ecosystems of products tracking S&P DJI indices have evolved across equities and fixed income.
The posts on this blog are opinions, not advice. Please read our Disclaimers.Exploring the Index Liquidity Landscape
Sector Neutrality – An Essential Mechanism within the S&P 500 ESG Leaders Index
The Taxing Effect of Taxes
S&P/ASX 200 High Dividend Index: Q3 2024 Performance Attribution
Introducing the Dow Jones Developed Green Real Estate Index
Exploring the Index Liquidity Landscape
Sector Neutrality – An Essential Mechanism within the S&P 500 ESG Leaders Index

The S&P 500® ESG Leaders Index seeks to provide a measurement of U.S. equities while incorporating ESG (Environment, Social, and Governance) factors.1 The index maintains similar industry weights to the S&P 500 while implementing stricter ESG eligibility criteria.
A common misconception is that all ESG indices remove or underweight sectors deemed environmentally damaging, such as Energy or Utilities. However, removing entire sectors may result in a shift in weight toward other sectors, potentially creating sector bias and concentration risk. Rather than excluding sectors, the S&P 500 ESG Leaders Index selects companies that perform highest when considering specific ESG metrics.
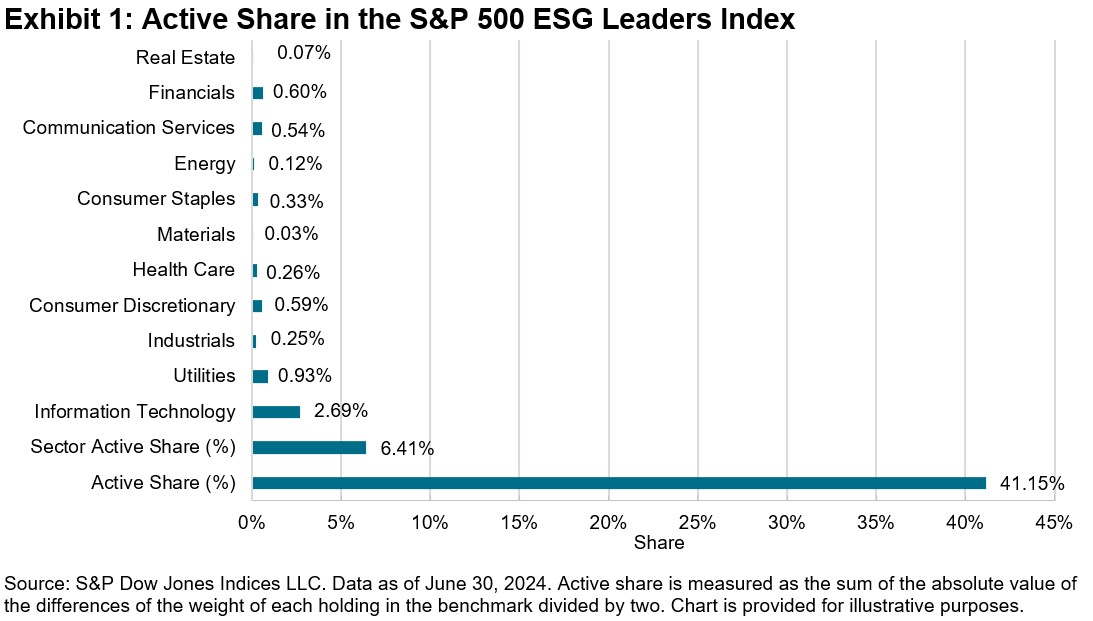
Exhibit 1 illustrates how the S&P 500 ESG Leaders Index maintains low active share in relation to the benchmark index, in each sector, with the sector active share at 6.41%, highlighting broad sector neutrality. However, using ESG metrics as the criteria to determine index inclusion will naturally result in deviations from the underlying index. This is particularly evident when a sector has several constituents deemed ineligible or a company with a high float market cap (FMC) is excluded. Typically, the more a methodology integrates stricter sustainability criteria, the greater the active share.
The S&P 500 ESG Leaders Index methodology selects constituents on a relative basis1 within each GICS® industry group, resulting in low active share within sectors. However, in certain instances, sectors may be over- or underweighted relative to the underlying index, causing deviation. This is illustrated by the active share at the index level reaching 41.15%, which is driven by both disparity in index constituents with the S&P 500, as mentioned previously, as well as weights (see Exhibit 1).
The index selection process targets 50% of uncapped FMC from each GICS industry group in the S&P 500, selecting companies in decreasing order using S&P Global ESG Scores (see Exhibit 2). However, specific exclusions (such as exclusions based on specified business activities) may prevent an industry group from meeting the 50% target. This could be a result of the industry lacking enough eligible constituents or the FMC weight of eligible constituent weights not reaching the target.
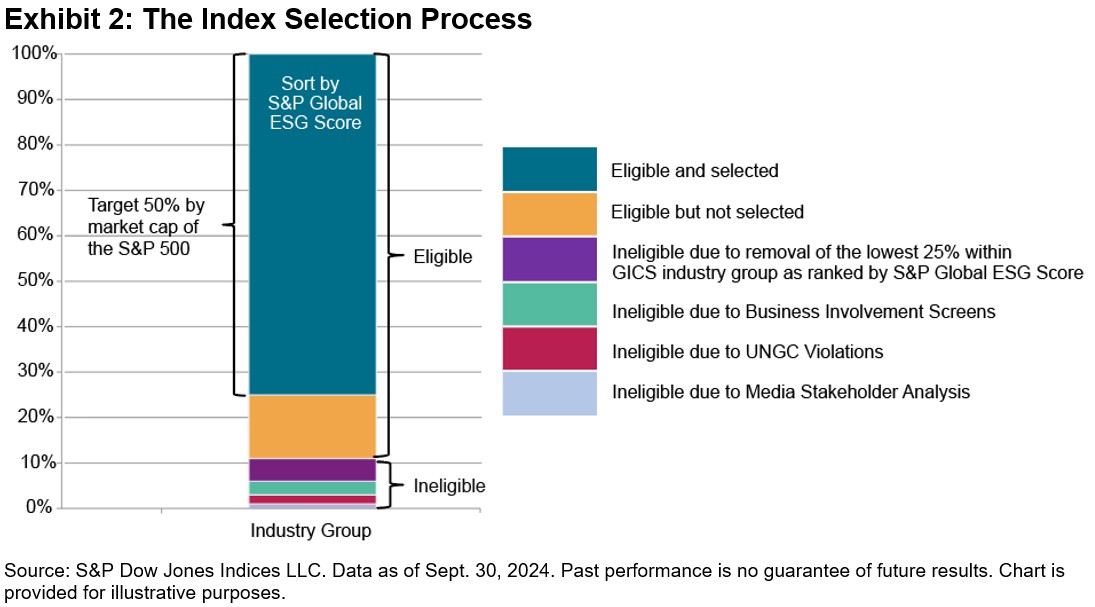
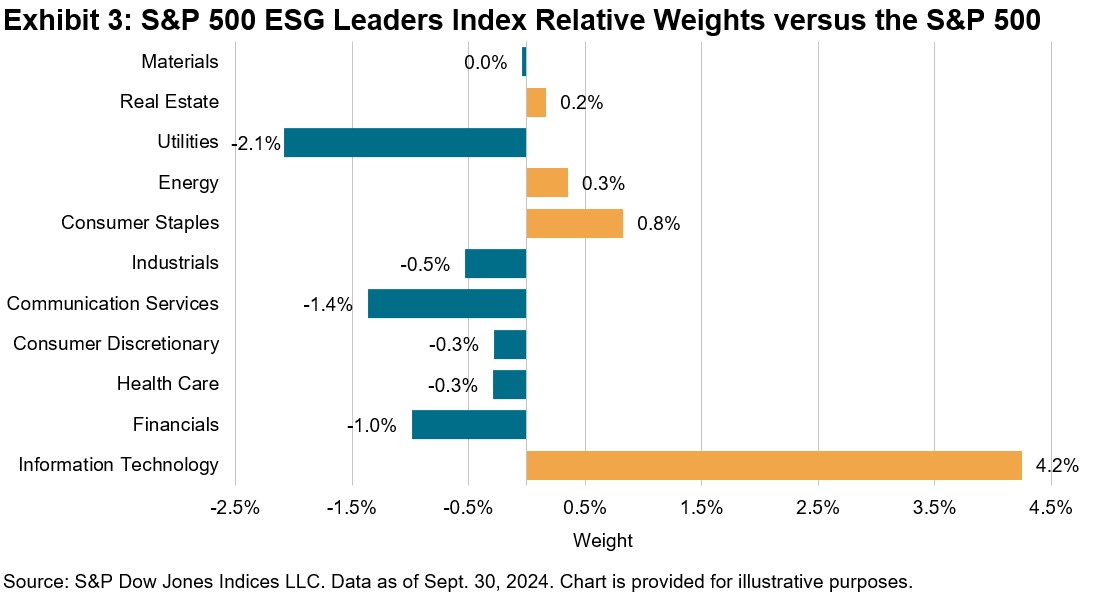
If this happens, excess industry weight is distributed proportionately among the remaining index constituents. If eligible constituents with higher FMC weighting are selected, any additional weight allocation may result in a sector overweight (see Exhibit 3). To prevent single-stock concentration, a constituent cap1 is integrated as per the S&P 500 ESG Leaders Indices methodology.
The S&P 500 ESG Leaders Index has provided a measurement of U.S. equities with an ESG lens and maintained similar industry group weights as the S&P 500. By utilizing index construction to maintain broad sector neutrality, the index historically reduced the impact of sector-driven performance, increased the impact of stock selection and produced low tracking error versus the S&P 500.3 Consequently, the success of the index is not solely measured through its performance but also by how closely its industry group weights—and, by extension, sector weights— remain similar to the S&P 500.
1 See Rowton, Stephanie and Maria Sanchez, “The S&P 500 ESG Index: 5 Years of Defining Core Through an ESG Lens,” S&P Dow Jones Indices LLC, Aug. 7, 2024.
2 A maximum single-company weight cap (5%, company weight in the S&P 500 ESG Index) is applied to the final index constituents.
3 Beyhan, Maya, “Understanding the Outperformance of the S&P 500 ESG Leaders Index through a Sectoral Lens,” S&P Dow Jones Indices’ Indexology® Blog, Oct. 24, 2024.
The posts on this blog are opinions, not advice. Please read our Disclaimers.The Taxing Effect of Taxes

“Be thankful I don’t take it all, cause I’m the taxman.”
George Harrison (The Beatles) in “Taxman”
For over 20 years, S&P Dow Jones Indices has compared index performance against actively managed funds and published the results in the SPIVA® Scorecards. Active funds have often struggled to match the returns of capitalization-weighted benchmarks like the S&P 500® or the S&P Composite 1500® (see the SPIVA Global Mid-Year 2024). But even outperforming active managers have faced headwinds, including typically higher fees and particularly taxes, which can significantly erode performance, leaving even fewer managers capable of outperforming in the long run.
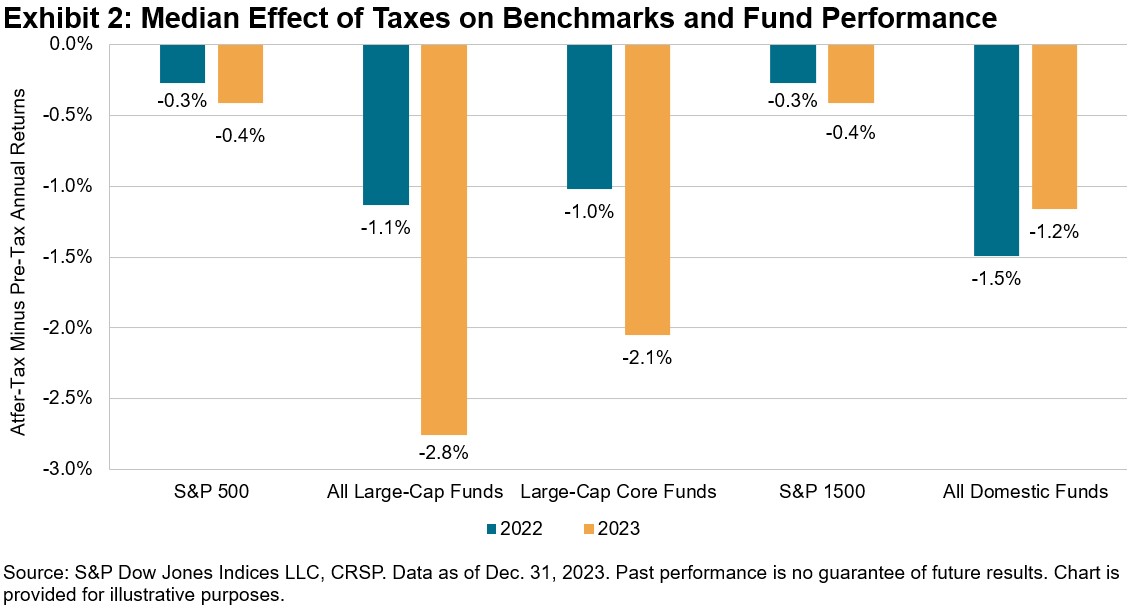
The SPIVA After-Tax Year-End 2023 Scorecard analyzes the cumulative effect of taxes on investor returns for broad U.S. domestic equity categories, demonstrating the improbability of beating a benchmark after accounting for taxes on capital gains and other distributions. In 2023, across the All Domestic Funds, All Large-Cap Funds and Large-Cap Core Funds categories, 79%, 66% and 74% of active managers underperformed their benchmarks after taxes, respectively. Fund manager underperformance rates worsened considerably compared to 2022, particularly for All Domestic Funds (see Exhibit 1).
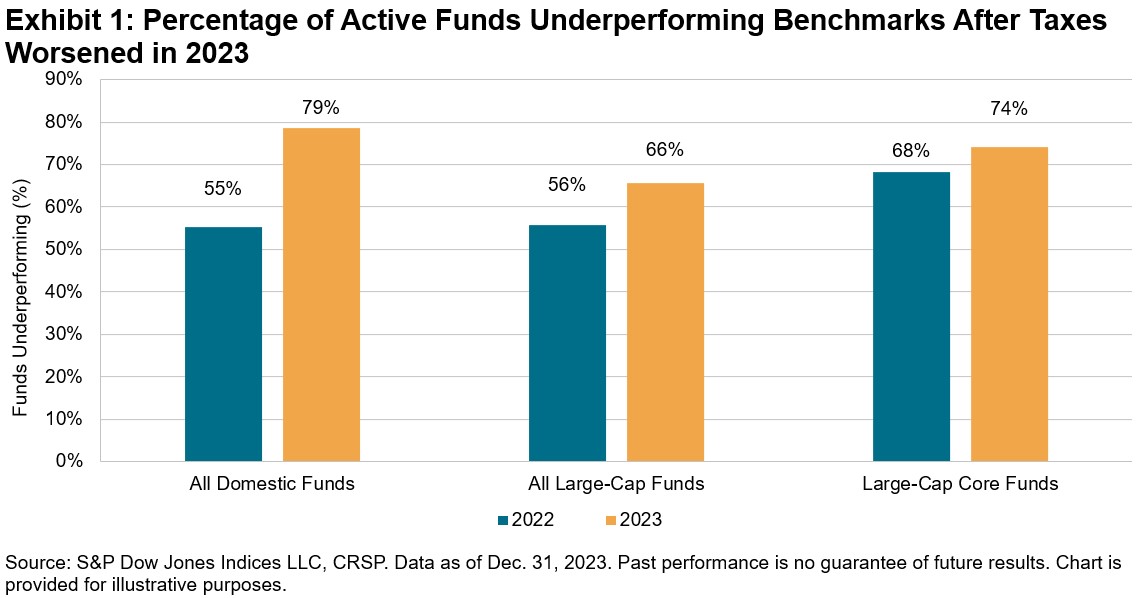
A key reason for the higher underperformance rates in 2023 is that the impact of taxes on the returns of active funds was generally greater compared to the equivalent tax impact on the respective benchmarks. The 2023 median after-tax returns for All Domestic Funds, All Large-Cap Funds and Large-Cap Core Funds lagged their pre-tax medians by 1.2%, 2.8% and 2.1%, respectively, compared to 1.5%, 1.1% and 1.0%, respectively, in 2022. These differentials were considerably larger compared to the less than 0.5% impact for both the benchmark S&P 1500® and S&P 500.
If the impacts of taxation on actively managed funds weren’t damaging enough, the sharp increase in long-term mutual fund outflows over the past couple years may have led to another unfortunate scenario for taxable investors. During 2022 and 2023, long-term U.S. mutual funds experienced a combined USD 1.765 trillion in net outflows.1 These persistent outflows may have triggered tax bills for investors even in strong-performing markets.
While 2023 was a much different market regime than 2022 (characterized by a sharp rise of 26.3% and a severe downturn of 18.1%, respectively, for the S&P 500), one thing was the same in both years: active managers in broad U.S. equity categories found it difficult to beat their benchmarks, particularly when tax bills came due. To learn more about the effect of taxes on fund performance, please see the SPIVA After-Tax Year-End 2023 Scorecard.
The author would like to thank Joe Nelesen, Davide Di Gioia and Grace Stoddart for their contributions to this post.
1 For more detail on long-term U.S. mutual fund flows, please see figures 3.3 and 3.4 (pages 46-48) in the 2024 Investment Company Fact Book.
The posts on this blog are opinions, not advice. Please read our Disclaimers.S&P/ASX 200 High Dividend Index: Q3 2024 Performance Attribution

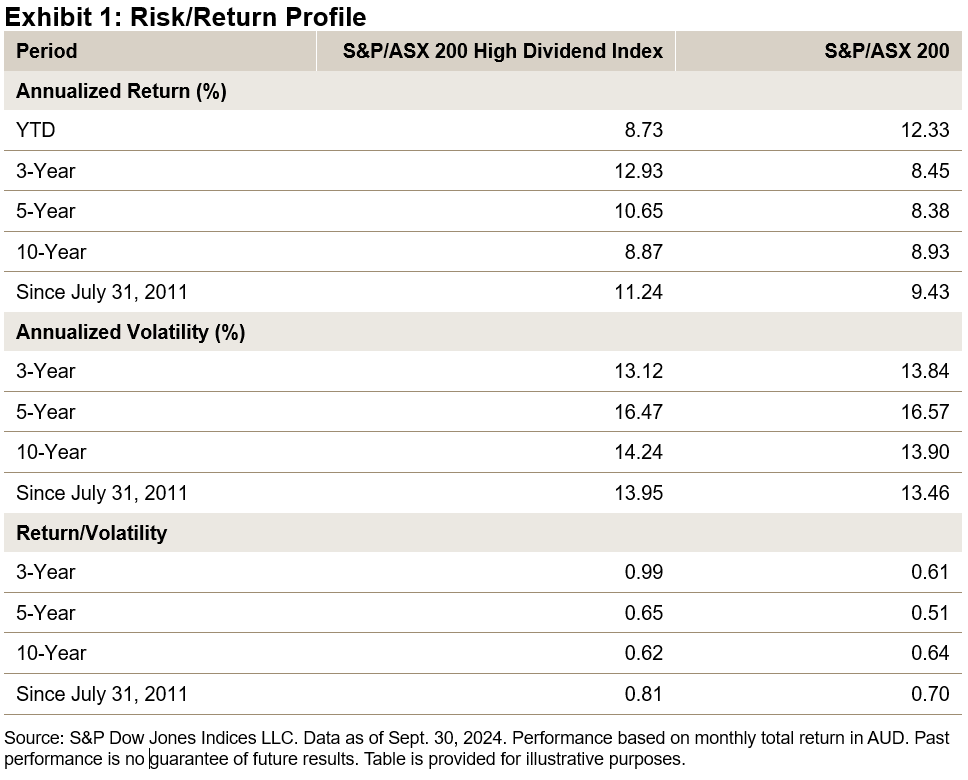
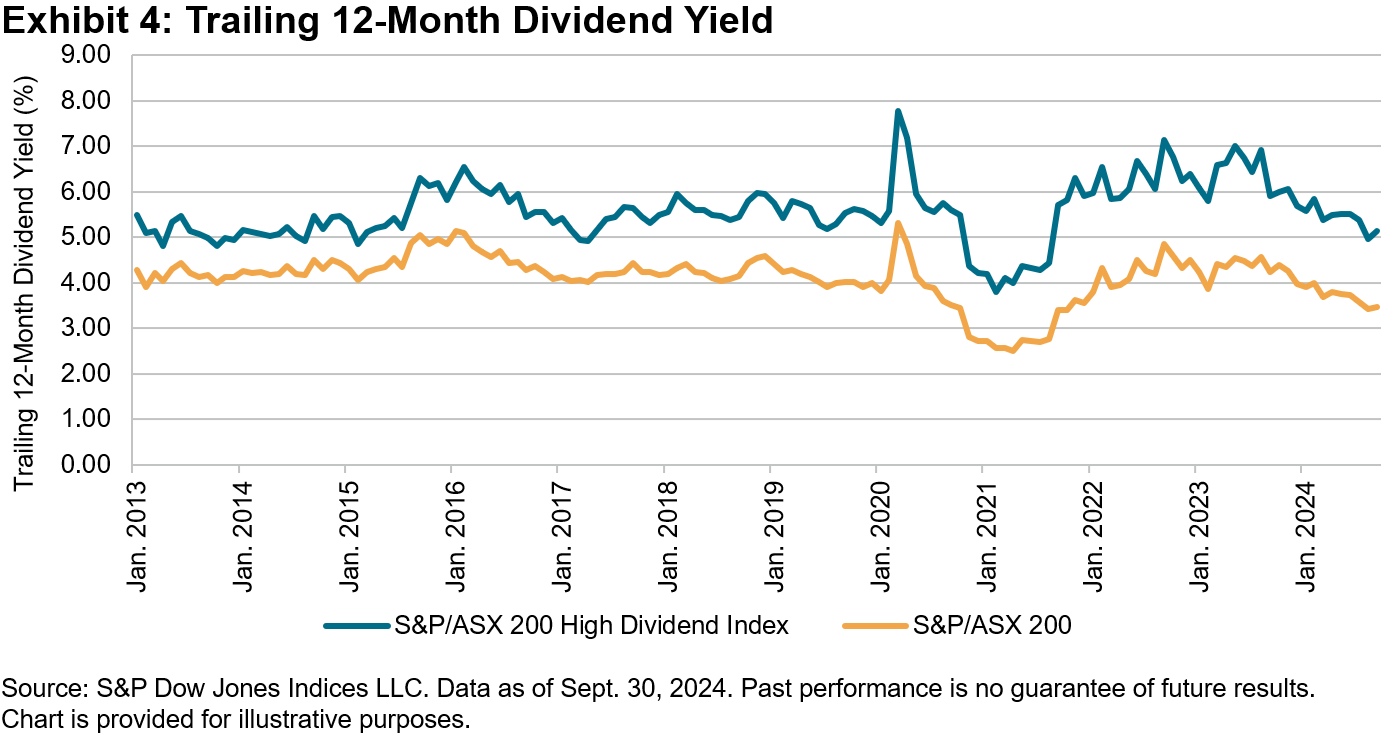
The S&P/ASX 200 High Dividend Index seeks to measure the performance of the 50 companies with the highest 12-month forecast dividend yield from the S&P/ASX 200. Historically, the index has consistently delivered higher-than-market dividend yield and long-term outperformance against its benchmark. From July 2011 to September 2024, the index had an average trailing 12-month gross dividend yield of 5.5% and an annual excess return of 1.8% compared with the S&P/ASX 200.
Exhibit 1 shows the historical performance of the S&P/ASX 200 High Dividend Index. Year-to-date, the index experienced short-term underperformance against the market, lagging the S&P/ASX 200 by 3.6% as of Sept. 30, 2024. To better understand the source of the excess return, we are taking a closer look at the index’s short-term and long-term performance.
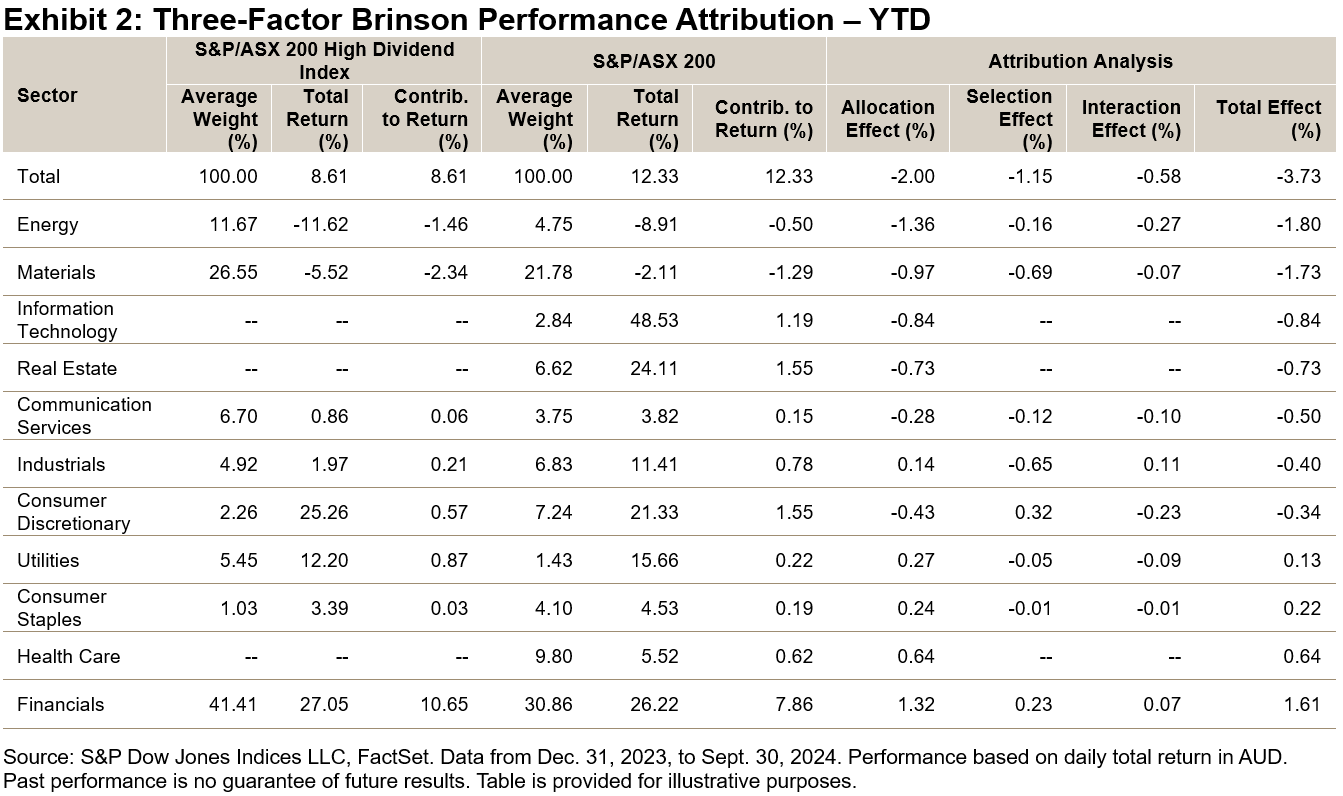
As Exhibit 2 shows, the YTD underperformance against the S&P/ASX 200 could be largely attributed to an overweight in the Energy and Materials sectors and an underweight in the Information Technology and Real Estate sectors. Increased weight in some high-yielding mega-caps such as Woodside Energy Group and Fortescue Ltd was the primary reason for the overweight in Energy and Materials. Lacking weight in Information Technology and Real Estate aligns with a high-dividend-yield strategy based on the S&P/ASX 200 Ex-A-REITs universe.
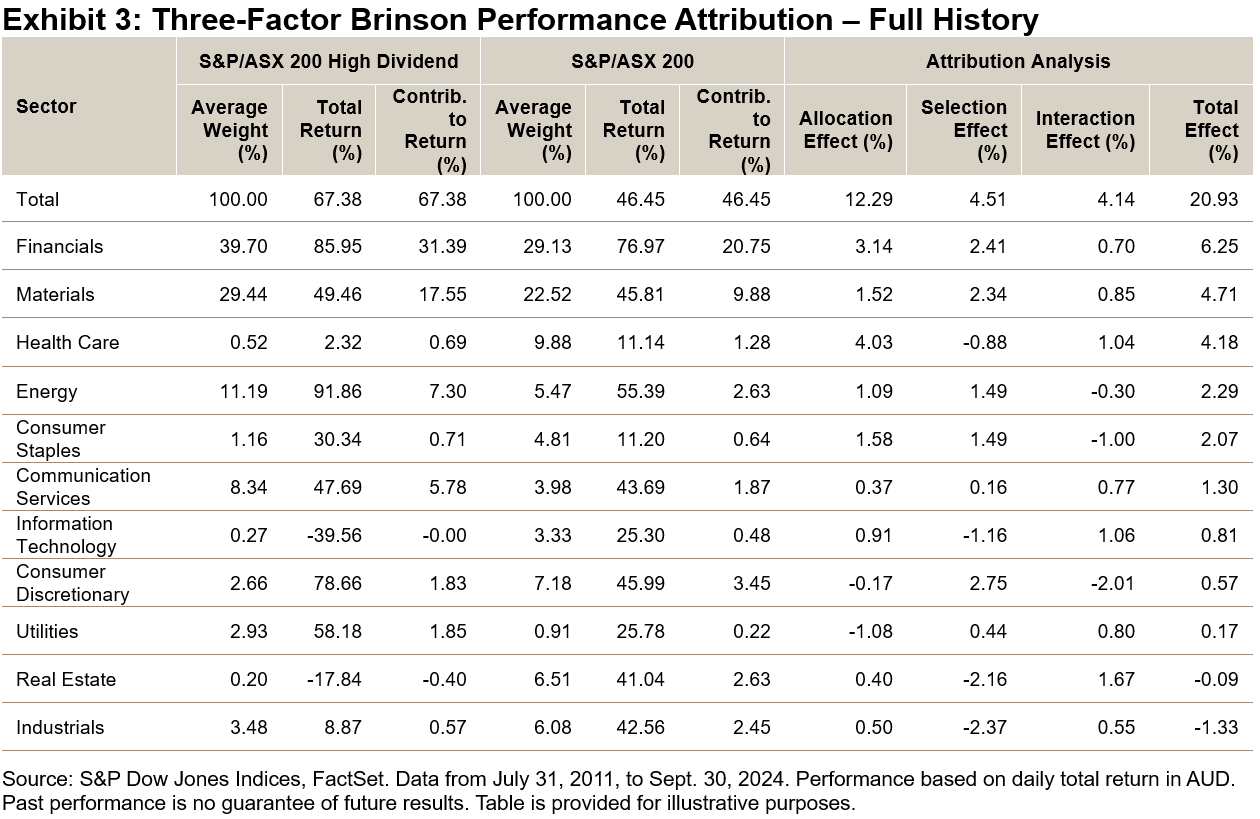
While overweighting Energy and Materials in the S&P/ASX 200 High Dividend Index has not delivered excess return YTD, it has been a major contributor to the long-term outperformance since 2021. From Dec. 31, 2020, to Sept. 30, 2024, the S&P/ASX 200 High Dividend Index had a total return of 68.2%1 in contrast to 46.5% from the S&P/ASX 200. We can mainly attribute the outperformance to allocation effect rather than selection effect (see Exhibit 3). Financials, Materials, Health Care, Energy and Consumer Staples were the largest contributors. Over the longer term, the S&P/ASX 200 Index underweighted Health Care and Consumer Staples, while overweighting Financials, Materials and Energy.
To sustain a higher-than-market dividend yield level, the index selects eligible stocks from the S&P/ASX 200 based on forecast dividend yield. Some familiar names may be excluded due to low yield ranking. As of the July 2024 rebalancing, Wesfarmers, Commonwealth Bank Australia and Macquarie Group had a forecast dividend yield of approximately 3.5%, which is relatively low compared with the weighted average dividend yield of 5.5% for the S&P/ASX 200 High Dividend Index.
As Exhibit 4 shows, the S&P/ASX 200 High Dividend Index has been able to maintain a dividend yield that is about 1.5% higher than the market level for the past 10 years. As of Sept. 30, 2024, the trailing 12-month dividend yield of the S&P/ASX 200 High Dividend Index is 5.14%, while that of the S&P/ASX 200 is 3.47%.
Like all factor indices, the S&P/ASX 200 High Dividend Index has experienced performance reversions during the short term. More importantly, the index consistently targets companies with high dividend yield and has historically delivered some excess return in the long term.
1 FactSet generated index return (see Exhibit 3) is 0.8% less than the official cumulative index total return of the S&P/ASX 200 High Dividend Index.
The posts on this blog are opinions, not advice. Please read our Disclaimers.Introducing the Dow Jones Developed Green Real Estate Index

A renewed interest in Real Estate has emerged as declining interest rates tend to bring more favorable conditions to the industry. For 16 of the last 31 years in developed markets, the Real Estate sector has outperformed the broader equity market as measured by relevant indices.1
The COVID-19 pandemic struck at the core of the Real Estate sector by shutting down offices, hotels, retail stores and more, while subsequent interest rate hikes by the U.S. Federal Reserve to mitigate inflation led to a divergence between these indices. Together, these challenges have hampered industry recovery efforts, keeping Real Estate index performance in negative territory over the past four years.
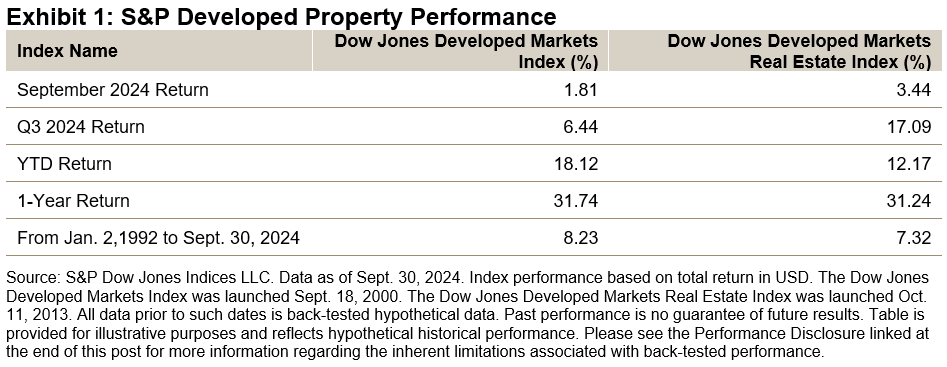
However, as the pandemic subsided, inflation was reduced to 2.4% in September 2024 from its peak of 9.1% in June 2022,2 and interest rates started to decrease, interest in Real Estate re-emerged. This past year, Real Estate indices have experienced a resurgence in performance, with the Dow Jones Developed Markets Real Estate up 31.2% for the one-year period ending September 2024 (see Exhibit 1).
“Green” Real Estate investments have attracted global market interest, especially as reports show that total energy consumption and CO2 emissions in 2021 surpassed pre-pandemic levels, falling short of 2050 decarbonization goals.3 This trend makes benchmarks like the Dow Jones Developed Green Real Estate Index a critical tool to denote the index constituents that have demonstrated improved sustainabilty credentials and reduce physical risk exposure at the index level as outlined in the index methodology. Exhibit 2 provides a closer look at the key methodology attributes and data sources used in the index.
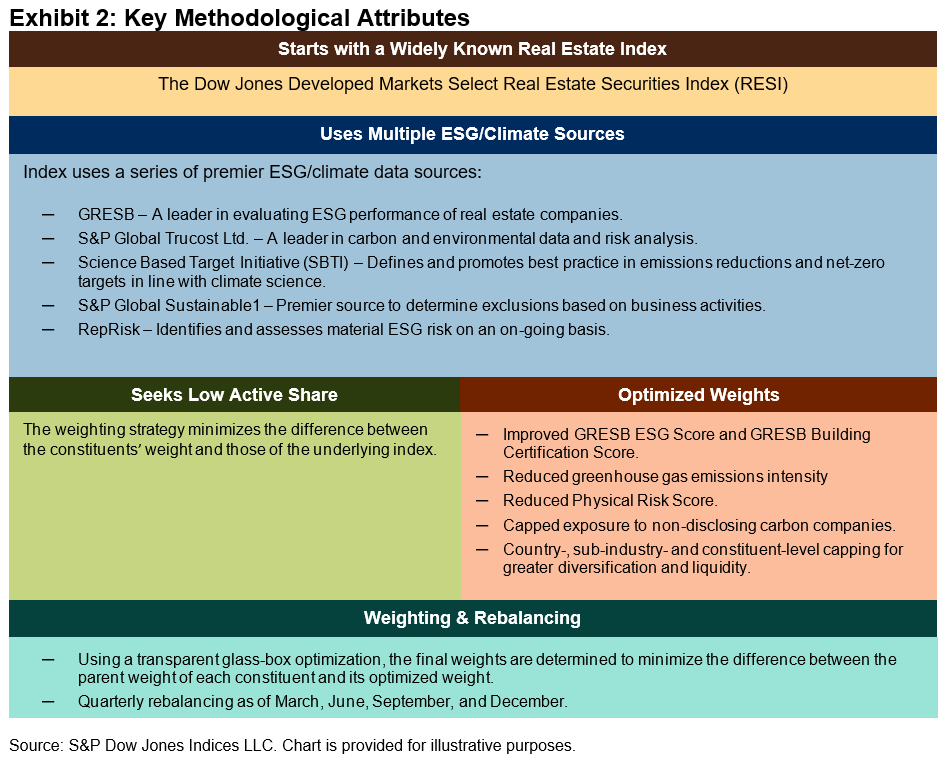
Exhibit 3 shows that the Dow Jones Developed Green Real Estate Index has historically tracked its benchmark, the Dow Jones Developed Markets Select RESI, very closely, which is consistent with a low tracking error.
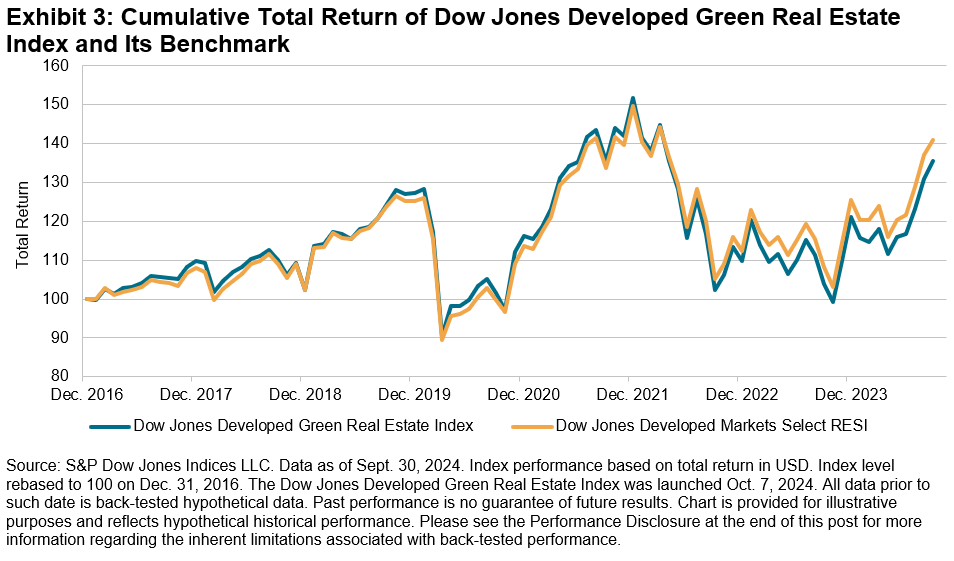
Similar to traditional Real Estate indices, the Dow Jones Developed Green Real Estate Index has historically performed better during periods of decreasing rates, and it has historically underperformed when rates rise. This could be expected, as rising rates tend to decrease the profitability of Real Estate investments. For example, between Dec. 31, 2021, and Oct. 24, 2023, when the 10-Year U.S. Treasury rate increased by 343 bps, the Dow Jones Developed Markets Select RESI (USD, TR) was down 32.1%. Conversely, between Oct. 31, 2023, and Sept. 30, 2024, when the 10-Year U.S. Treasury rate dropped 114 bps, the index was up 38.8%.
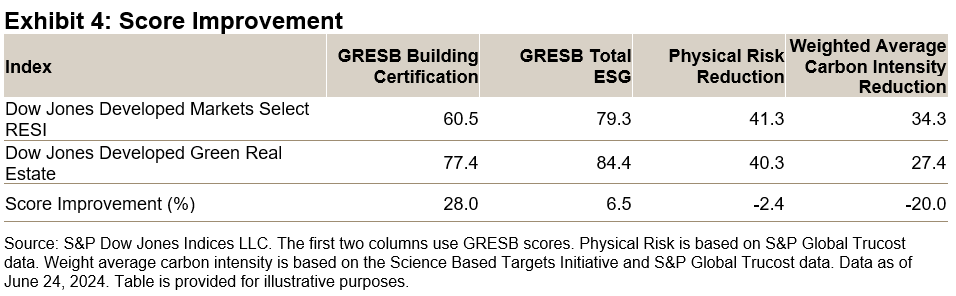
Historical performance that closely tracks its benchmark is only part of the story; Exhibit 4 shows that the Dow Jones Developed Green Real Estate Index reflects strong score improvements relative to the underlying index.
Conclusion
The Dow Jones Developed Green Real Estate Index measures Real Estate companies through an ESG lens. By integrating environmental data and rigorous selection criteria, the index serves as a benchmark for market participants to monitor not just Real Estate performance but also ESG improvements of the Real Estate sector as companies in the sector seek to align with developing global sustainable initiatives.
1 Reference is based on the Dow Jones Developed Markets Real Estate Index and the Dow Jones Developed Markets Index, which are sub-indices of the Dow Jones Global Index.
2 CPI Home : U.S. Bureau of Labor Statistics
3 Source: U.N. Environment 2022 Global Status Report for Buildings and Construction Towards a zero-emissions, efficient and resilient buildings and construction sector. 2022 Global Status Report for Buildings and Construction | UNEP – UN Environment Programme.
The posts on this blog are opinions, not advice. Please read our Disclaimers.