Get Indexology® Blog updates via email.

In This List

A Review of the Recent Strong Performance of the S&P 500 Quality, Value & Momentum Multi-Factor Index

A Measure of Success – The Evolution of ESG Scores in the S&P 500 ESG Index

Under the Hood of U.S. Equities: Perspectives on Size, Sectors and Style

S&P DJI’s Global Islamic Equity Benchmarks Rose 5% in Q3 2024, Underperforming Conventional Benchmarks

A VIX for Single Stocks Is Alive and Ticking

A Review of the Recent Strong Performance of the S&P 500 Quality, Value & Momentum Multi-Factor Index

Contributor Image
Hugo Barrera

Senior Analyst, Product Management

S&P Dow Jones Indices

S&P 500 Quality, Value & Momentum Multi-Factor Index

Multi-factor strategies offer a comprehensive approach to index-based investing by combining diverse factors that exhibit low correlations across different market environments. By integrating these factors, multi-factor indices have historically shown lower volatility and better performance, while avoiding the need to time individual factors to align with specific economic trends or market phases.

A notable example is the S&P 500® Quality, Value & Momentum (QVM) Multi-Factor Index, launched on Jan. 30, 2017, which has demonstrated notable performance. In this blog, we will explore the index’s methodology and examine its characteristics, risk/return profile and performance attribution.

Methodology Overview

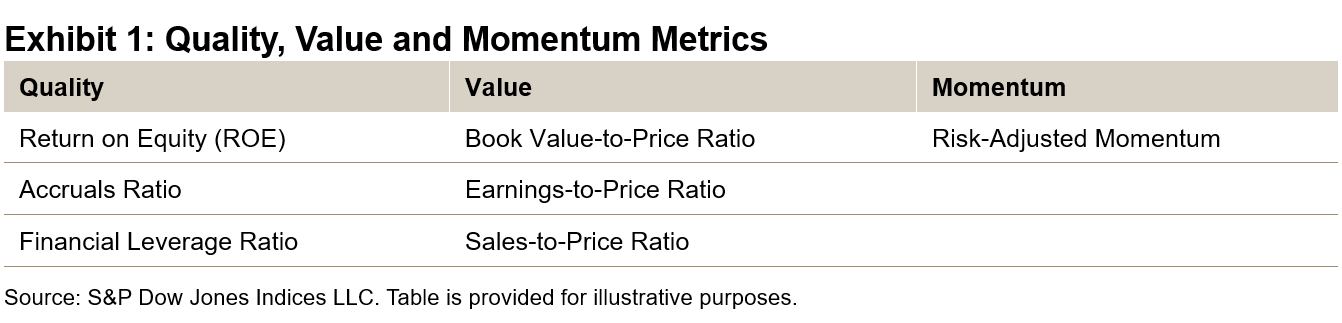
The S&P 500 QVM Multi-Factor Index tracks 100 stocks from the S&P 500 that exhibit the strongest combination of quality, value and momentum. Utilizing a bottom-up approach, the index selects “all-rounders” that have the highest scores, on average, across all three factors. The S&P 500 QVM Multi-Factor Index aims to provide a richer multi-factor exposure and help address the factor dilution often seen in top-down approaches.1

Selected constituents are weighted by the product of their market capitalization and multi-factor score. Exhibit 1 summarizes the metrics used to construct the S&P 500 QVM Multi-Factor Index.

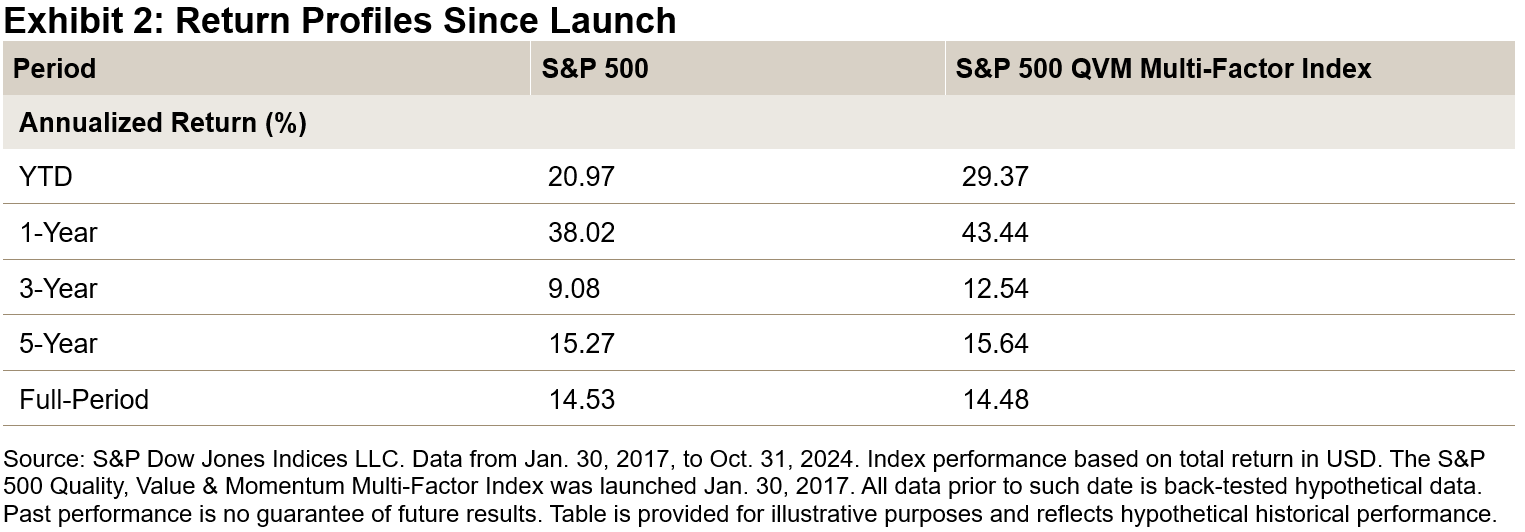
Live Performance of the S&P 500 QVM Multi-Factor Index

Since its launch date, the S&P 500 QVM Multi-Factor Index has shown strong performance, in line with its benchmark. Notably, its three-year return has exceeded that of the S&P 500 by 3.45% annualized, which is quite remarkable given the recent performance of this large-cap benchmark.

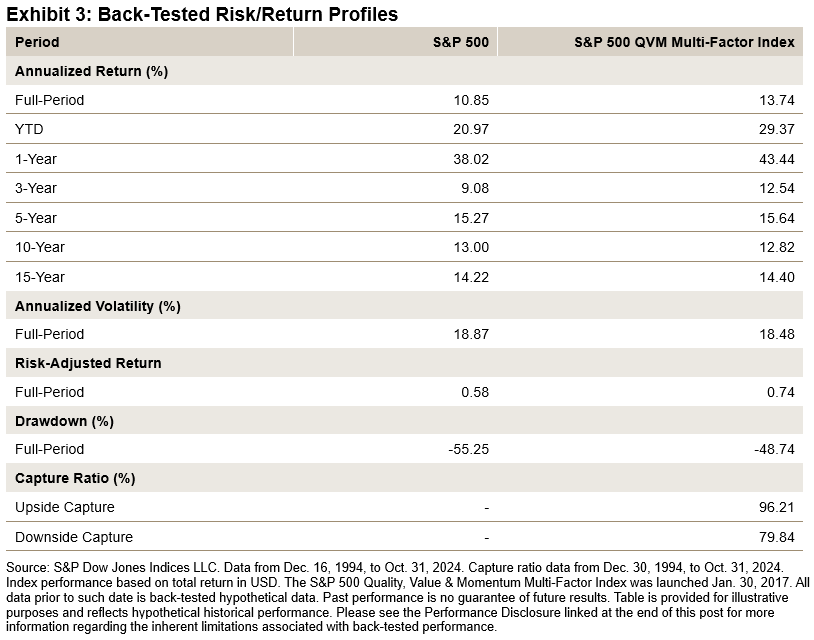
Back-Tested Performance of the S&P 500 QVM Multi-Factor Index

Over the longer term, including back-tested performance, the S&P 500 QVM Multi-Factor Index has outperformed its benchmark both in absolute and risk-adjusted terms. Additionally, the index has exhibited reduced volatility, lower drawdowns and lower downside capture.

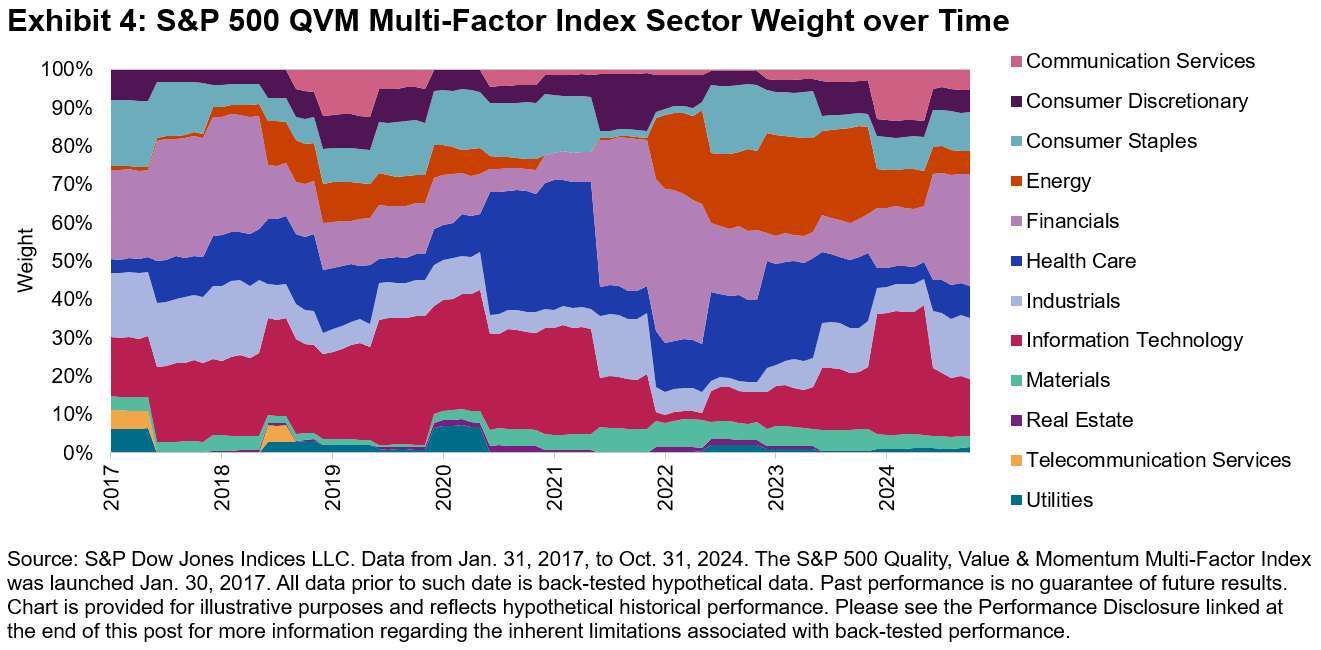
Live Sector Weights of the S&P 500 QVM Multi-Factor Index

Exhibit 4 shows how the sector weights of the S&P 500 QVM Multi-Factor Index have changed over time. On average, the largest sector weights in the index have been Information Technology, Financials and Health Care.

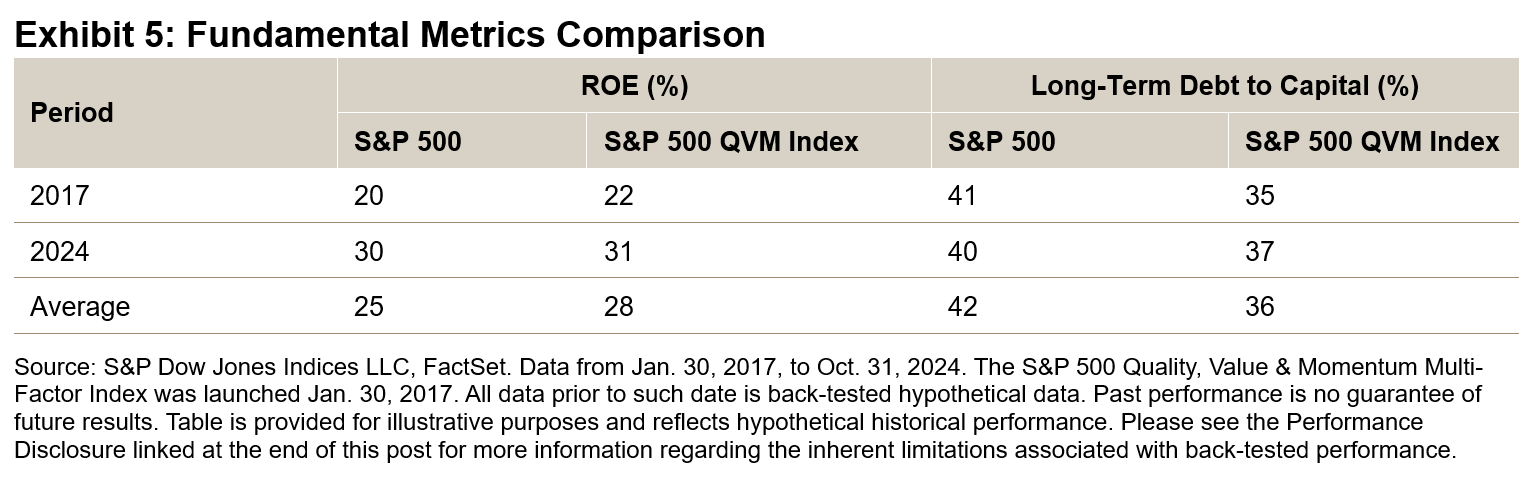
Fundamental Metrics of the S&P 500 QVM Multi-Factor Index

Exhibit 5 shows the ROE and long-term debt to capital metrics of the S&P 500 QVM Multi-Factor Index since its launch. On average, the index has shown a higher ROE and a lower long-term debt to capital ratio compared to its benchmark.

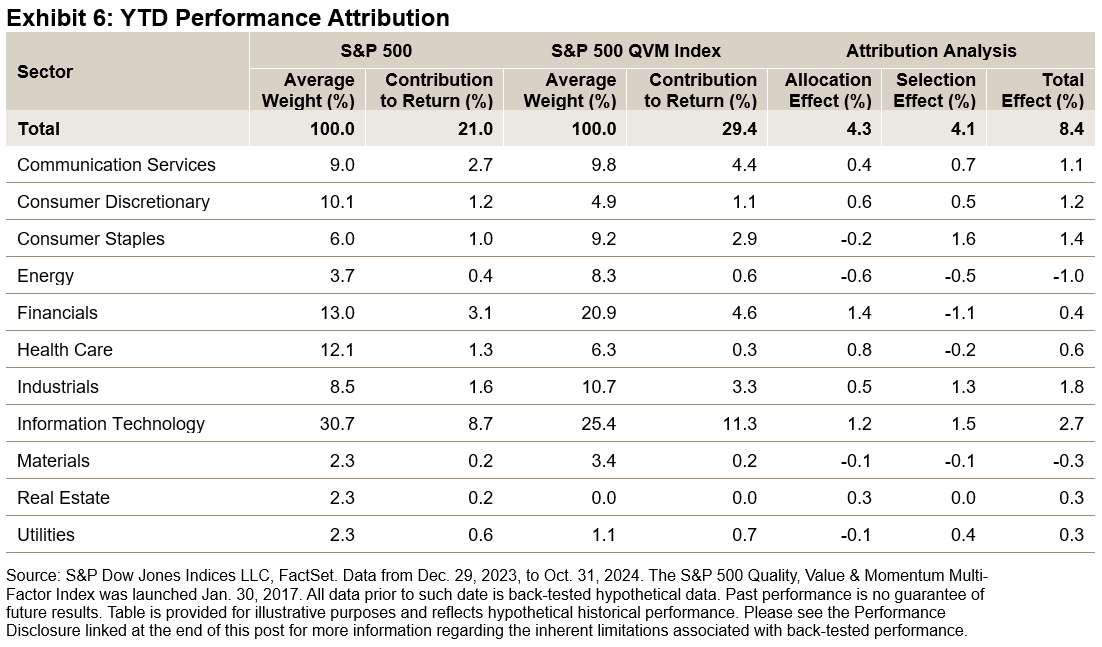
YTD Performance Attribution of the S&P 500 QVM Multi-Factor Index

Exhibit 6 evaluates the YTD performance of the S&P 500 QVM Multi-Factor Index using the Brinson attribution method. It reveals that the recent outperformance can be attributed to both allocation and selection effects, which contributed 4.3% and 4.1%, respectively. Notably, the selection effect played a significant role, showcasing the effect of a bottom-up multi-factor strategy based on a composite of quality, value and momentum factors.

Conclusion

Multi-factor strategies offer an approach to navigating the complexities of selecting and timing individual factors. These strategies have historically led to improved risk-adjusted returns and more stable excess return outcomes, thanks to their diverse factor makeup.

The S&P 500 QVM Multi-Factor Index employs a bottom-up methodology that selects stocks with high average multi-factor scores across quality, value and momentum. Over the long term, the index has beaten the S&P 500, demonstrating significant outperformance over the recent three-year period. With historical benefits such as long-term return outperformance, reduced volatility and enhanced multi-factor exposure, the S&P 500 QVM Multi-Factor Index is a unique index with a diversified factor makeup.


1Innes, Andrew, The Merits and Methods of Multi-Factor Investing,” S&P Dow Jones Indices, April 2018.

The posts on this blog are opinions, not advice. Please read our Disclaimers.

A Measure of Success – The Evolution of ESG Scores in the S&P 500 ESG Index

Contributor Image
Maria Sanchez

Director, Sustainability Index Product Management, U.S. Equity Indices

S&P Dow Jones Indices

When considering the success of an index, many often think in terms of performance metrics. However, the true measure of an index’s success lies in how well it meets its objectives. The S&P 500® ESG Index focuses on selecting and ranking index constituents using ESG scores compared to the underlying S&P 500.  The index achieves this by selecting the top 75% of companies by float-adjusted market capitalization (FMC) within each GICS® industry group based on their ESG score rankings. This blog examines the evolution of ESG scores within the index since its launch in January 2019.

In early 2024,1 a significant transition occurred from the S&P DJI ESG Scores to the S&P Global ESG Scores. This change of ESG scores was made due to the enhanced modeling approach used by the S&P Global ESG Scores and a desire to standardize the scoring framework across S&P Global.

For comparison purposes, we consider a hypothetical scenario using the composition effective after April 30, 2024, using S&P DJI ESG Scores, enabling an “apples-to-apples” comparison. By analyzing these hypothetical outcomes, stakeholders can gain insights into what the index ESG score would be with the former set (S&P DJI ESG Scores) and the current composition of the S&P 500 ESG Index. Over the past five years, the ESG score of the S&P 500 ESG Index has consistently improved relative to the S&P 500 (see Exhibit 1). On average, the index has historically achieved an absolute improvement of 8.5 points and a relative improvement of 13.4%.2 Considering the new S&P Global ESG Scores, the percentage improvement seems to have dropped; however, we still see an absolute improvement of 4.6 points, which corresponds to approximately a 10% relative improvement (see Exhibit 2).

As mentioned in the paper The S&P 500 ESG Index: 5 Years of Defining Core through an ESG Lens, the S&P Global ESG Scores3 have a more normalized distribution of scores compared to the S&P DJI ESG Scores, thanks to enhanced modeling approaches that minimize size and disclosure biases. Note the S&P DJI ESG Scores4 used S&P Global Corporate Sustainability Assessment (CSA) Scores that assigned a score of zero where relevant company data was undisclosed, skewing results. The methodology5 for the S&P Global ESG scores assigns modeled scores based on industry correlations, which is likely to be more representative of companies’ sustainability performance across industries, various sizes and regions. Consequently, fewer companies achieve high scores as the scoring system now reflects an assessment of ESG risks, opportunities and impacts informed by a combination of company disclosures, media and stakeholder analysis, modeling approaches, and in-depth company engagement via the S&P Global CSA. This shift effectively raises the bar for what constitutes a high score, resulting in a more competitive landscape (see Exhibit 3).

Additionally, the historical improvement of index-level ESG scores of the S&P 500 ESG Index compared to the S&P 500 is evident across various dimensions—environmental, social and governance—as illustrated in Exhibit 4.

Conclusion

Despite the scores transition, the S&P 500 ESG Index has still been able to improve index-level ESG scores compared to the S&P 500 by incorporating ESG factors into its construction process. This is also evident at the dimension level across environmental, social and governance criteria.

For more information on how the S&P 500 ESG Index measures the S&P 500 through an ESG lens, please refer to The S&P 500 ESG Index: 5 Years of Defining Core through an ESG Lens.

It should be noted that the S&P 500 ESG Index is a broad-based index that measures the performance of securities from the S&P 500 that meet specified sustainability criteria, while maintaining similar overall industry group weights as the S&P 500; consequently, securities that some may consider are not sustainable will be constituents of the S&P 500 ESG Index.

1https://www.spglobal.com/spdji/en/documents/indexnews/announcements/20240123-1470259/1470259_sp-glb-bis-glb-esg-scores-consult-results-1-23-2024.pdf

2 Using the S&P DJI ESG Scores

3 Transitioning S&P Sustainability Indices to S&P Global ESG Scores and Business Involvement Screens

4 S&P DJI ESG Score Methodology

5 S&P Global ESG Scores Methodology

The posts on this blog are opinions, not advice. Please read our Disclaimers.

Under the Hood of U.S. Equities: Perspectives on Size, Sectors and Style

Contributor Image
Sherifa Issifu

Associate Director, Global Exchanges

S&P Dow Jones Indices

Large-cap, growth and tech-oriented companies have led U.S. equity market performance so far in 2024. Investors’ optimism for the application of artificial intelligence on these companies’ growth prospects propelled the S&P 500® Top 50, S&P 500 Information Technology, S&P 500 Communication Services and S&P 500 Growth to more than 20% year-to-date gains through the end of August.

However, the year-to-date performance masks the fact that there has been a notable shift in leadership since the end of June. Indeed, market participants re-evaluated AI opportunities at the start of H2 2024, focusing on capacity demand for chips, potential opportunities for business use and whether the expectation from AI will translate into general economic growth in the short and medium term. This provided headwinds for H1’s performance leaders.

Instead, more domestically focused U.S. segments such as Real Estate, value and small size have led the way in Q3. The S&P SmallCap 600® is outperforming the S&P 500 by about 6%, with the S&P MidCap 400® and S&P 500 Equal Weight Index leading by 2% and 3%, respectively.

It’s difficult to know whether these trends will continue, but what we have seen historically is that rotations in market leadership across U.S. market cap indices, sectors and style segments are common. The differences in performance in the two parts of the year also show that segments of the U.S. equity market can perform distinctly from the S&P 500, creating opportunities for diversification within the U.S. equity universe.

Recent years have been marked by higher dispersion among sector, style and size, with sectors being the most elevated in comparison to history. In 2022, S&P 500 Sectors exhibited their highest calendar year dispersion on record, with a spread of 106% between the best-performing sector (Energy, 86%) and worst-performing sector (Communication Services, -40%), compared with the previous record of 98% from 2000. Sectors remain a useful tool regardless of whether market participants choose to be active or passive.1

Elevated sector dispersion has also been seen historically in U.S. presidential elections, with November election months exhibiting significantly higher dispersion than other months and non-election periods.2 Exhibit 4 shows dispersion at the sector level despite limited benchmark volatility. In 2016, sector effects accounted for over 40% of the S&P 500’s monthly dispersion; at the time markets priced in the anticipated impact of the then-incoming administration’s policies on different market segments. It will be interesting to see whether a similar trend emerges in the 2024 U.S. presidential election, but history points to sector effects playing an important role, amplifying the importance of sector choices.3

Recent changes to market leadership remind us that change is a constant of the markets. However, being equipped with a full range of index-based tools can help market participants manage and potentially mitigate risks across different market regimes.

1 Nelesen, Joseph and Edwards, Tim, “Natural Selection: Tactics and Strategy with Equity Sectors,” S&P Dow Jones Indices, July 2024.

2 Ganti, Anu and Lazzara, Craig, “Sector Effects During Elections,” S&P Dow Jones Indices, September 2020.

3 Preston, Hamish, “U.S. Equities and Sectors in Election Years,” S&P Dow Jones Indices, July 2024.

This post was originally published by Calcalist on Oct. 6, 2024.

The posts on this blog are opinions, not advice. Please read our Disclaimers.

S&P DJI’s Global Islamic Equity Benchmarks Rose 5% in Q3 2024, Underperforming Conventional Benchmarks

Contributor Image
Sue Lee

Director and APAC Head of Index Investment Strategy

S&P Dow Jones Indices

Global equities continued to trend higher in the third quarter of 2024, as central banks in many parts of the world moved to ease monetary policy on the back of moderating inflation. The S&P Global BMI rose 7.0% for the quarter and was up 18.1% YTD. Emerging market regions drove the market up, with an impressive 10.4% return, almost catching up with the performance of developed market regions YTD. MENA equities also turned around and joined in the global upward trend, with the S&P Pan Arab Composite rising 6.7%, led by UAE (up 11.9%) and Qatar (up 9.3%).

Meanwhile, Shariah-compliant global equity benchmarks fell short of their conventional counterparts; the S&P Global BMI Shariah and Dow Jones Islamic Market (DJIM) World Index both underperformed by about 2% in Q3 2024, narrowing their excess returns versus conventional benchmarks to 0.5% YTD (see Exhibit 1).

Drivers of Shariah Index Performance in Q3 2024

While the global equity market continued its upward trend into the third quarter, there were notable rotations underneath the surface. In contrast to the first half of 2024, which was characterized by the outperformance of large-cap Information Technology and Communication Services companies, the market strength broadened across smaller companies and other sectors in Q3, including Financials in particular. In more detail, a full 1.5% of the 1.9% return differential between the S&P Global BMI and S&P Global BMI Shariah was due to the latter’s relative underweight in the Financials sector, as shown in Exhibit 2. Communication Services also contributed negatively, as within the sector, Shariah-compliant, large-cap Media & Entertainment companies underperformed the non-compliant, indebted Telecommunication Services companies. Utilities, which was among the best-performing sectors in Q3, also contributed to the underperformance of the shariah indices through its reduced weightings.

Global Sukuk Rallied in Q3 2024

Fixed income markets witnessed a strong rally on the back of the global rate cycle taking a sharp turn downward. U.S. dollar-denominated investment grade bonds, as measured by the iBoxx $ Overall Index, and its sukuk equivalent—the Dow Jones Sukuk Index (ex-Reinvestment)—both gained 4.6% in the third quarter, as a larger compression in credit spreads offset the lower duration of sukuk. The sukuk benchmark’s yield fell to 4.4%, with a spread of 77 bps over the U.S. Treasury bonds, as of the end of September 2024.

This article was first published in IFN Volume 21 Issue 44 dated October 30, 2024.

The posts on this blog are opinions, not advice. Please read our Disclaimers.

A VIX for Single Stocks Is Alive and Ticking

Contributor Image
Tim Edwards

Managing Director, Index Investment Strategy

S&P Dow Jones Indices

For over 30 years, market participants have used the Cboe Volatility Index (VIX®) to gauge expectations for future volatility and measure short-term market sentiment. Today, VIX is a world-renowned measure that was linked to over USD 1 trillion in listed trading activity in 2023. However, it does not encompass all the risks in U.S. equities, or all the opportunities. For instance, if half of the S&P 500®’s constituents decline precipitously while the other half rise correspondingly, the benchmark may not change much due to diversification effects. Individual stocks exhibit distinct risk profiles compared to the index, and that can be particularly important when navigating around major market events – such as a U.S. election.

On Nov. 4, 2024, a new index, the Cboe S&P 500 Constituent Volatility Index (VIXEQ), was launched through a collaboration between S&P Dow Jones Indices and Cboe. A complementary measure reflecting single-stock risk in the S&P 500, VIXEQ uses options on S&P 500 constituent stocks and VIX’s methodology to build a one-month measure of expected volatility for each constituent; with index level equal to the capitalization-weighted, root mean square average of the single-stock VIX calculations.1  Exhibit 1 shows the current VIX levels for the stocks included in the calculation at the end of the first day of VIXEQ’s publication and Exhibit 2 shows the hypothetical (that is, back-tested) levels of the index since 2014.

VIXEQ’s launch may be particularly timely, because its inaugural closing level provides a concrete example of the kind of unique information it provides, in this case regarding the potential market reaction to the upcoming results of the U.S. presidential election. Specifically, Monday’s VIXEQ index level of 36.77, as compared to a VIX level of 21.98 suggests that, as well as overall moves in the S&P 500, there might be a significant mix of “winners” and “losers” among the benchmark’s constituents over the next 30 days.

To test whether this information might have been useful historically, we2 ran a basic case study on the five U.S. election periods included in Exhibit 2—the presidential elections of 2016 and 2020, as well as the Congress and Senate elections in 2014, 2018 and 2022.  Comparing the levels of “implied” and “realized” volatilities, VIX proved a poor predictor: the average realized S&P 500 index volatility in the month after the election day was on average over 8 points different from what VIX anticipated.  But while VIXEQ was also far from perfect, it was less inaccurate: on average, just 3 points different from the subsequent (weighted) average S&P 500 single stock volatility.  If that (admittedly small) sample is representative, we might expect individual stock movements to be relatively amplified over the next 30 days, both compared to historical norms and compared to the S&P 500’s concurrent fluctuations.

Of course, uncertainties remain regarding election outcomes and corresponding market reactions.  But indices like VIX and VIXEQ, as well as the related DSPX index for implied S&P 500 dispersion, offer valuable insights into market sentiment and the distribution of risks across individual stocks and shared market factors.


1 There are not quite sufficiently many liquid options on all the S&P 500’s constituents to build a VIX for every stock; instead, a subset of 86 stocks with particularly liquid options markets (precisely, the current constituents of the Cboe S&P 500 Dispersion Basket Index) are used.

2 The author is grateful to Will Kennedy for producing analysis and data underlying this post.

The posts on this blog are opinions, not advice. Please read our Disclaimers.