Get Indexology® Blog updates via email.

In This List

S&P DJI’s Global Islamic Equity Benchmarks Rose 5% in Q3 2024, Underperforming Conventional Benchmarks

A VIX for Single Stocks Is Alive and Ticking

Innovating Fixed Income: How Corporate Behavior Shapes New S&P DJI Fixed Income Benchmarks

Understanding the Outperformance of the S&P 500 ESG Leaders Index through a Sectoral Lens

Clash of Titans: Diverging Global and Emerging Market Mid-Year Active Performance

S&P DJI’s Global Islamic Equity Benchmarks Rose 5% in Q3 2024, Underperforming Conventional Benchmarks

Contributor Image
Sue Lee

Director and APAC Head of Index Investment Strategy

S&P Dow Jones Indices

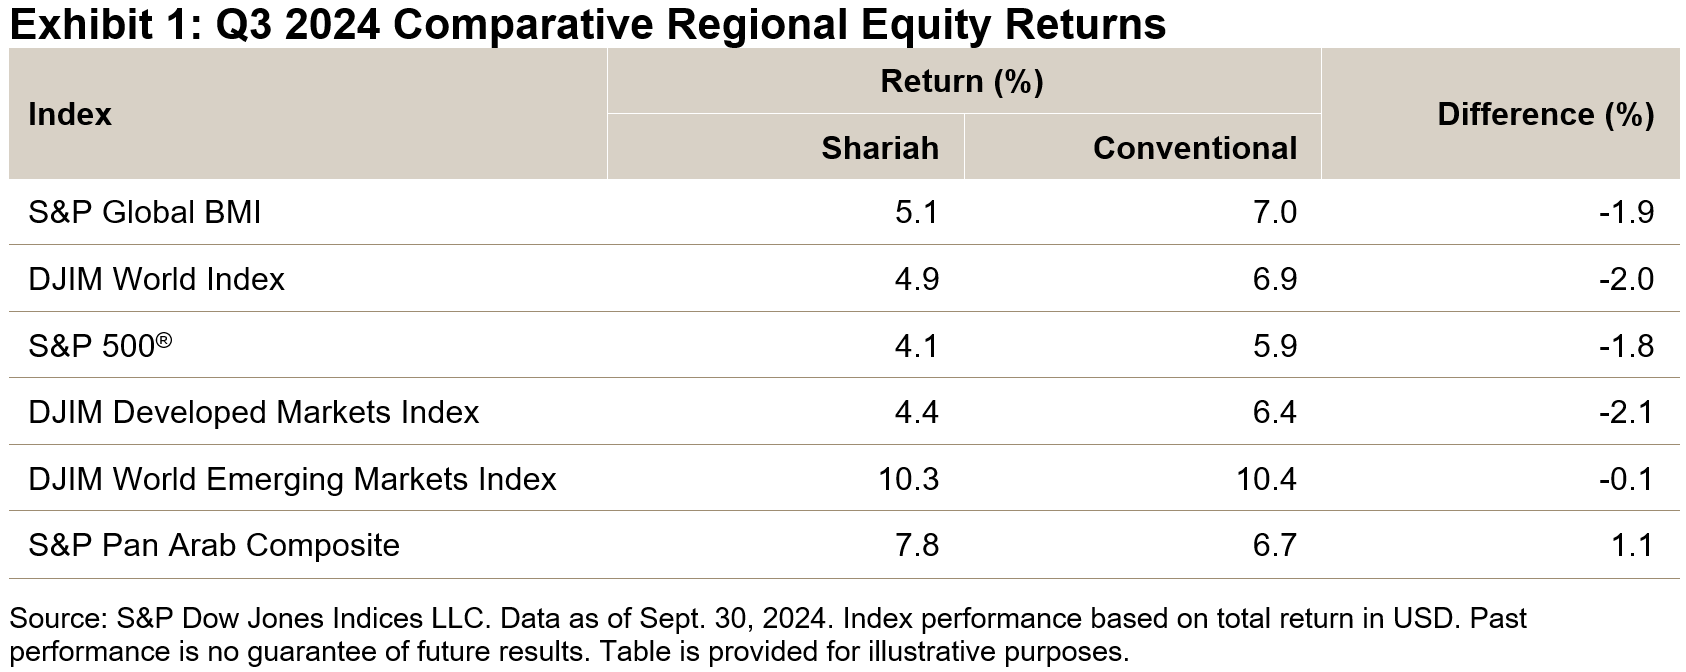
Global equities continued to trend higher in the third quarter of 2024, as central banks in many parts of the world moved to ease monetary policy on the back of moderating inflation. The S&P Global BMI rose 7.0% for the quarter and was up 18.1% YTD. Emerging market regions drove the market up, with an impressive 10.4% return, almost catching up with the performance of developed market regions YTD. MENA equities also turned around and joined in the global upward trend, with the S&P Pan Arab Composite rising 6.7%, led by UAE (up 11.9%) and Qatar (up 9.3%).

Meanwhile, Shariah-compliant global equity benchmarks fell short of their conventional counterparts; the S&P Global BMI Shariah and Dow Jones Islamic Market (DJIM) World Index both underperformed by about 2% in Q3 2024, narrowing their excess returns versus conventional benchmarks to 0.5% YTD (see Exhibit 1).

Drivers of Shariah Index Performance in Q3 2024

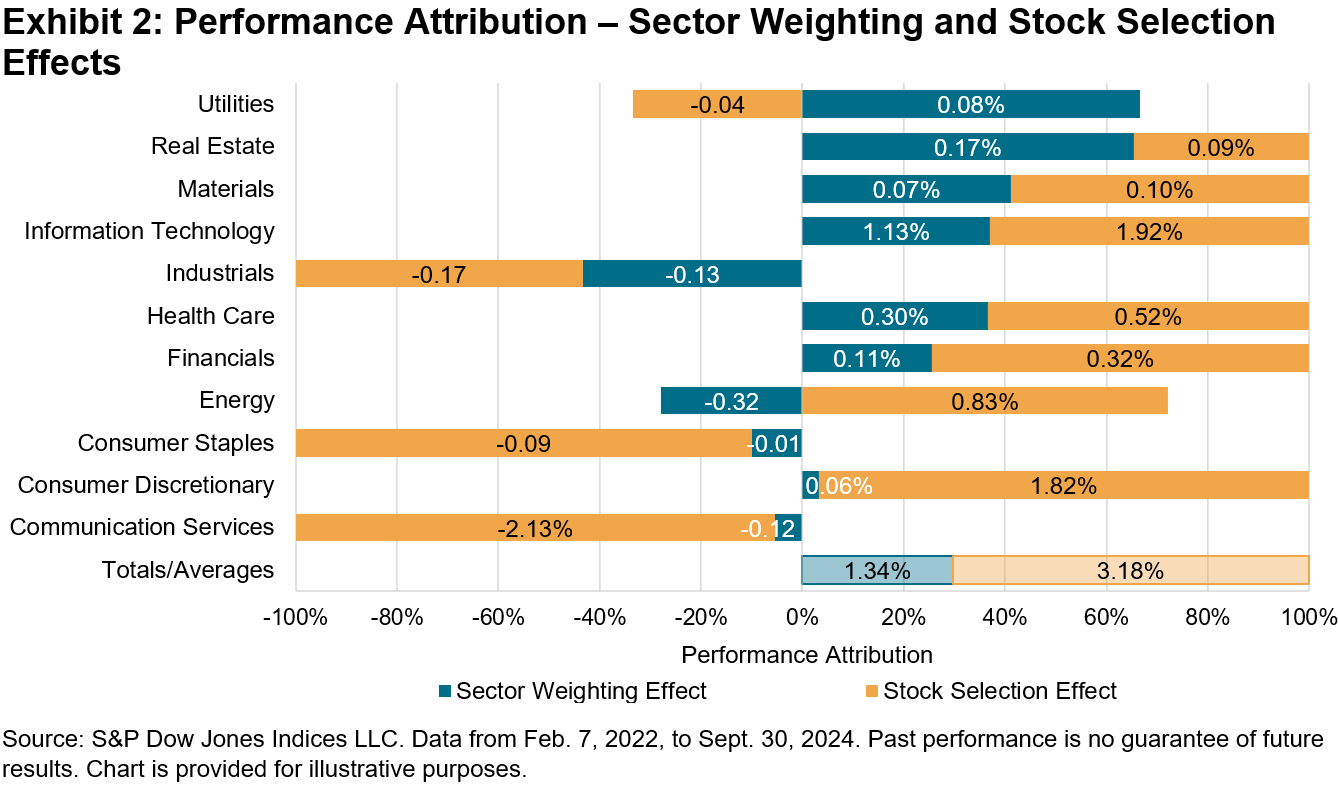
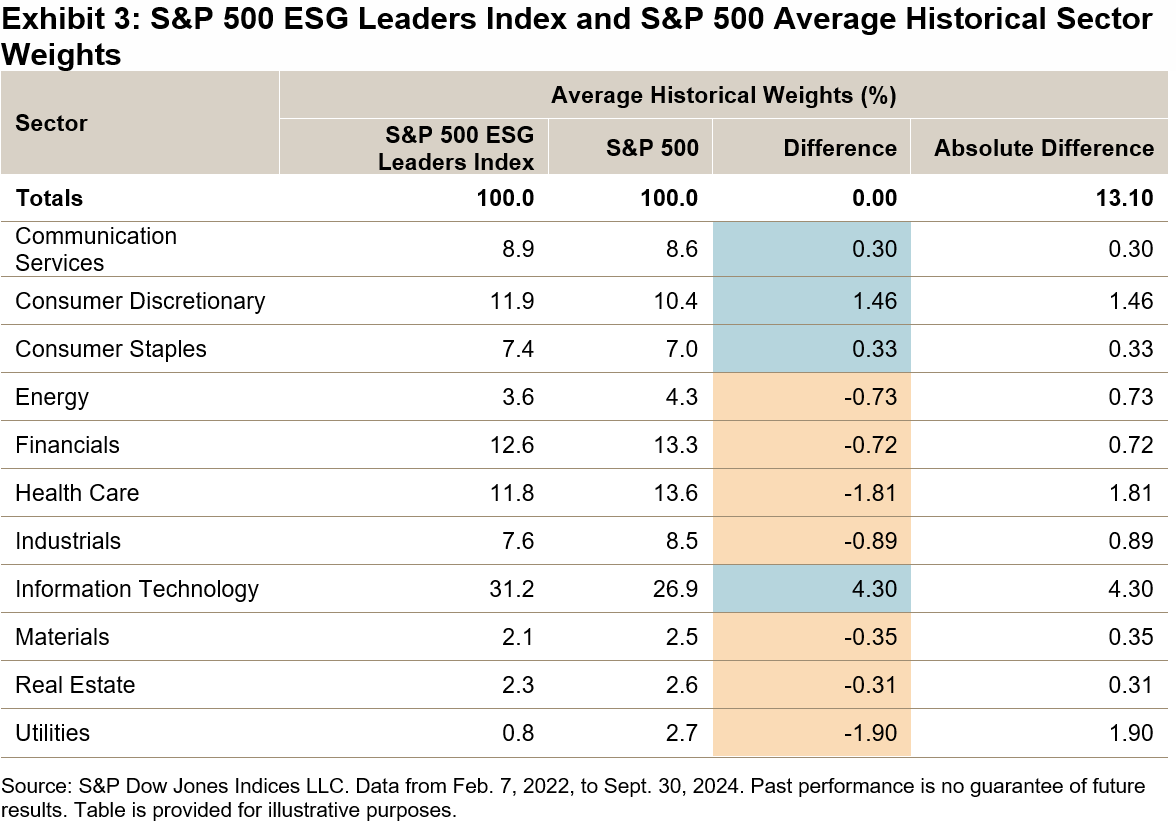
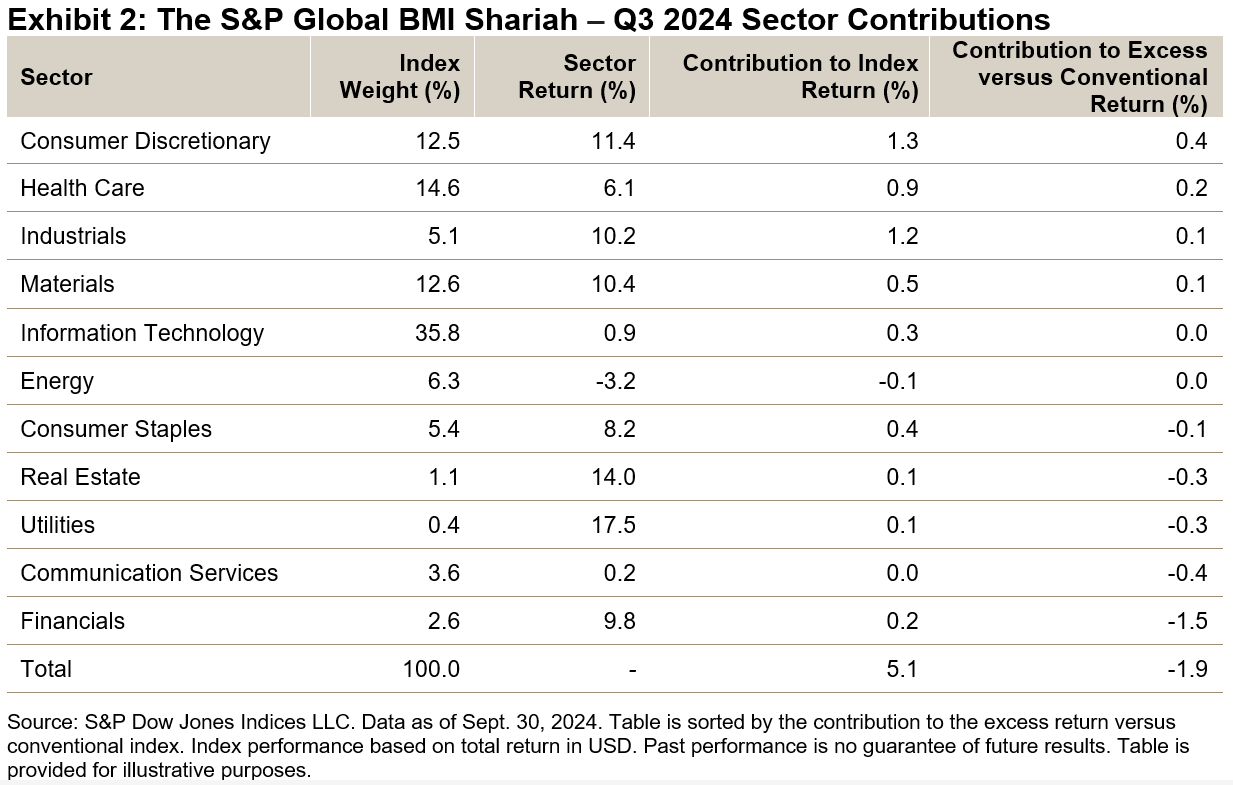
While the global equity market continued its upward trend into the third quarter, there were notable rotations underneath the surface. In contrast to the first half of 2024, which was characterized by the outperformance of large-cap Information Technology and Communication Services companies, the market strength broadened across smaller companies and other sectors in Q3, including Financials in particular. In more detail, a full 1.5% of the 1.9% return differential between the S&P Global BMI and S&P Global BMI Shariah was due to the latter’s relative underweight in the Financials sector, as shown in Exhibit 2. Communication Services also contributed negatively, as within the sector, Shariah-compliant, large-cap Media & Entertainment companies underperformed the non-compliant, indebted Telecommunication Services companies. Utilities, which was among the best-performing sectors in Q3, also contributed to the underperformance of the shariah indices through its reduced weightings.

Global Sukuk Rallied in Q3 2024

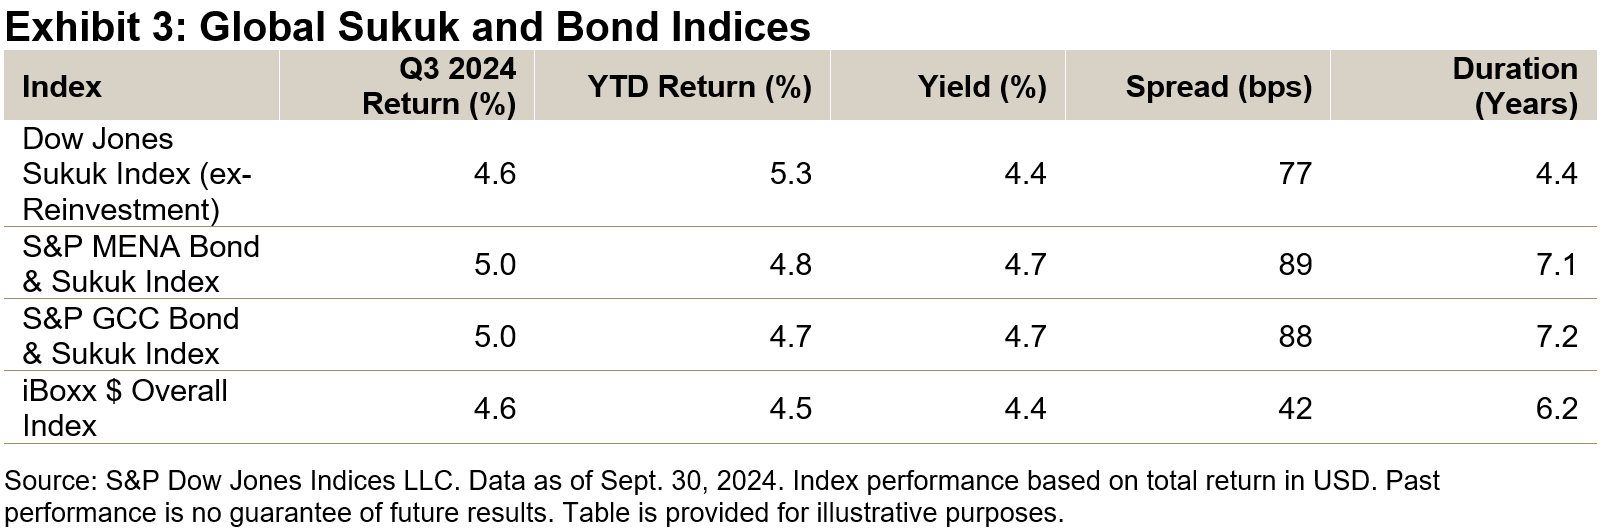
Fixed income markets witnessed a strong rally on the back of the global rate cycle taking a sharp turn downward. U.S. dollar-denominated investment grade bonds, as measured by the iBoxx $ Overall Index, and its sukuk equivalent—the Dow Jones Sukuk Index (ex-Reinvestment)—both gained 4.6% in the third quarter, as a larger compression in credit spreads offset the lower duration of sukuk. The sukuk benchmark’s yield fell to 4.4%, with a spread of 77 bps over the U.S. Treasury bonds, as of the end of September 2024.

This article was first published in IFN Volume 21 Issue 44 dated October 30, 2024.

The posts on this blog are opinions, not advice. Please read our Disclaimers.

A VIX for Single Stocks Is Alive and Ticking

Contributor Image
Tim Edwards

Managing Director, Index Investment Strategy

S&P Dow Jones Indices

For over 30 years, market participants have used the Cboe Volatility Index (VIX®) to gauge expectations for future volatility and measure short-term market sentiment. Today, VIX is a world-renowned measure that was linked to over USD 1 trillion in listed trading activity in 2023. However, it does not encompass all the risks in U.S. equities, or all the opportunities. For instance, if half of the S&P 500®’s constituents decline precipitously while the other half rise correspondingly, the benchmark may not change much due to diversification effects. Individual stocks exhibit distinct risk profiles compared to the index, and that can be particularly important when navigating around major market events – such as a U.S. election.

On Nov. 4, 2024, a new index, the Cboe S&P 500 Constituent Volatility Index (VIXEQ), was launched through a collaboration between S&P Dow Jones Indices and Cboe. A complementary measure reflecting single-stock risk in the S&P 500, VIXEQ uses options on S&P 500 constituent stocks and VIX’s methodology to build a one-month measure of expected volatility for each constituent; with index level equal to the capitalization-weighted, root mean square average of the single-stock VIX calculations.1  Exhibit 1 shows the current VIX levels for the stocks included in the calculation at the end of the first day of VIXEQ’s publication and Exhibit 2 shows the hypothetical (that is, back-tested) levels of the index since 2014.

VIXEQ’s launch may be particularly timely, because its inaugural closing level provides a concrete example of the kind of unique information it provides, in this case regarding the potential market reaction to the upcoming results of the U.S. presidential election. Specifically, Monday’s VIXEQ index level of 36.77, as compared to a VIX level of 21.98 suggests that, as well as overall moves in the S&P 500, there might be a significant mix of “winners” and “losers” among the benchmark’s constituents over the next 30 days.

To test whether this information might have been useful historically, we2 ran a basic case study on the five U.S. election periods included in Exhibit 2—the presidential elections of 2016 and 2020, as well as the Congress and Senate elections in 2014, 2018 and 2022.  Comparing the levels of “implied” and “realized” volatilities, VIX proved a poor predictor: the average realized S&P 500 index volatility in the month after the election day was on average over 8 points different from what VIX anticipated.  But while VIXEQ was also far from perfect, it was less inaccurate: on average, just 3 points different from the subsequent (weighted) average S&P 500 single stock volatility.  If that (admittedly small) sample is representative, we might expect individual stock movements to be relatively amplified over the next 30 days, both compared to historical norms and compared to the S&P 500’s concurrent fluctuations.

Of course, uncertainties remain regarding election outcomes and corresponding market reactions.  But indices like VIX and VIXEQ, as well as the related DSPX index for implied S&P 500 dispersion, offer valuable insights into market sentiment and the distribution of risks across individual stocks and shared market factors.


1 There are not quite sufficiently many liquid options on all the S&P 500’s constituents to build a VIX for every stock; instead, a subset of 86 stocks with particularly liquid options markets (precisely, the current constituents of the Cboe S&P 500 Dispersion Basket Index) are used.

2 The author is grateful to Will Kennedy for producing analysis and data underlying this post.

The posts on this blog are opinions, not advice. Please read our Disclaimers.

Innovating Fixed Income: How Corporate Behavior Shapes New S&P DJI Fixed Income Benchmarks

Contributor Image
Florian Guth

Associate Director, Fixed Income Product Management

S&P Dow Jones Indices

In recent years, fixed income indices have evolved to consider additional factors beyond traditional financial metrics. This evolution has led index providers to diversify their offering with more complex index constructions to cater to client needs. One such advancement is the inclusion of factors that reflect corporate behavior, where companies demonstrating responsible corporate practices are overweighted.

As a driver of fixed income index innovation, S&P Dow Jones Indices has partnered with JUST Capital to develop new benchmarks for the U.S. corporate bond market: the iBoxx JUST Capital USD Investment Grade Benchmark and the iBoxx JUST Capital USD High Yield Benchmark. The new benchmarks exclude any issuer with a rank in the bottom half of the JUST Capital annual ranking.

JUST Capital assesses companies based on key factors such as worker treatment, customer relations, community impact and governance practices using a comprehensive methodology. Their rankings are the result of an in-depth analysis that includes data from public sources, company reports and direct engagement with approximately 1,000 of the largest US-listed, publicly-traded companies (by market capitalization). To ensure their evaluations reflect broader societal values, JUST Capital conducts surveys that capture public sentiment regarding what matters most about corporate behavior. In 2024, the qualitative and quantitative survey yielded 20 issues and their relative importance to the U.S. public. The issues are classified into five groups based on the stakeholders they affect the most: Communities, Customers, Environmental, Shareholder & Governance and Workers.

Incorporating JUST Capital scores into fixed income indices offers an approach focused on corporate behavior. This approach may allow market participants to find a balance between benchmark performance and incorporating corporate behavior considerations.

In the JUST Capital ranking for 2024, the Utilities and Semiconductors & Equipment sectors lead the way, with an average ranking of 320 and 341, respectively.

Utilities companies have maintained their top position for Communities for the third consecutive year, with an average rank of 242. Meanwhile, the Computer Services sector has secured the highest average rank for Customers, at 205, for the second year running. Personal Products firms excel in Environmental considerations, showing an average rank of 187 for three years in a row. Additionally, Utilities companies again lead in Shareholders & Governance, achieving an impressive average rank of 330. Lastly, the Pharmaceuticals & Biotech sector ranks highest for Workers, with an average rank of 255, also for the second consecutive year.1

A comparison of the industry composition between the standard iBoxx $ Corporates Index and iBoxx USD High Yield Developed Markets Index and their JUST Capital counterparts tells a consistent story. The iBoxx JUST Capital USD Investment Grade Benchmark index shows a notable tilt toward the Consumer Services and Health Care sectors, with overweights of 3.7 and 3.4 percentage points, respectively. This trend becomes even more striking in the iBoxx JUST Capital USD High Yield Benchmark index, where the Consumer Services and Utilities sectors are over-represented by 21.0 and 5.7 percentage points, respectively. On the other hand, the most underweighted sectors include Energy, Consumer Goods and Core Financials, illustrating an adjustment in industry exposure between these indices.

While the rating composition of the iBoxx $ Corporates Index and the iBoxx JUST Capital USD Investment Grade Benchmark index shows similarities, the comparison within the high yield space presents a noteworthy distinction. The iBoxx JUST Capital USD High Yield Benchmark index shows a substantial 89.1% weight to BB-rated bonds, reflecting a significant increase of 35.3 percentage points compared to the iBoxx USD High Yield Developed Markets Index. In contrast, B rated and CCC rated bonds account for just 10.5% and 0.4%, respectively, with each representing decreases of 23.1 and 11.2 percentage points, respectively, underscoring a shift toward higher-quality credit within the iBoxx JUST Capital USD High Yield Benchmark index.

These new indices offer a unique approach to tracking corporate behavior and responsible practices, while measuring the broad fixed income market. As the landscape of fixed income continues to evolve, the iBoxx JUST Capital USD Investment Grade Benchmark index and iBoxx JUST Capital USD High Yield Benchmark index stand out as innovative tools that seek to reflect both market dynamics and corporate behavior.

1Please see the JUST Capital website for more information.


The posts on this blog are opinions, not advice. Please read our Disclaimers.

Understanding the Outperformance of the S&P 500 ESG Leaders Index through a Sectoral Lens

Contributor Image
Maya Beyhan

Global Head of Sustainability, Index Investment Strategy

S&P Dow Jones Indices

The financial landscape has transformed significantly in recent years, with market participants increasingly recognizing the value of sustainability characteristics. One embodiment of this shift is the S&P 500® ESG Leaders Index, launched on Feb. 7, 2022, which is a best-in-class ESG index designed to measure the performance of securities with stronger than average ESG characteristics, while excluding those with controversial business activities that have negative social or environmental impacts.

The S&P 500 ESG Leaders Index outperformed the S&P 500 over the past one- and two-year periods in annualized terms, while maintaining a tracking error of 2.0% (see Exhibit 1). Understanding the nuances behind this outperformance requires a critical analysis of the factors at play—specifically stock selection and sector weighting, akin to our earlier research1 on the S&P 500 ESG Index.

Exhibit 2 provides insights via a Brinson2 attribution framework, allowing us to quantify sector contributions to the S&P 500 ESG Leaders Index’s excess return relative to the S&P 500. To emphasize the relative impact of sector weighting and stock selection effects, Exhibit 2 shows the proportion of the total impact (so that their absolute values sum to 100%), with the actual return impact shown in the labels. The findings suggest that the outperformance of the S&P 500 ESG Leaders Index was predominantly driven by stock selection effects rather than sector weighting. Nearly 71% of the outperformance can be attributed to the stock selection effect, underscoring the index’s strategic focus on maintaining sector neutrality.

Diving deeper into sectoral effects, the analysis reveals that out of the 11 sectors included in the framework, only Utilities and Real Estate exhibited sector weighting effects that outpaced stock selection effects (see Exhibit 2). Furthermore, the average historical sector weights for the S&P 500 ESG Leaders Index and their differences from the S&P 500 are summarized in Exhibit 3.

The observations in Exhibits 2 and 3 underscore an important achievement for the S&P 500 ESG Leaders Index—it achieved a notable degree of sector neutrality compared to the S&P 500, thus helping to mitigate the risk associated with over-concentration in particular sectors. For market participants aiming to incorporate sustainability into their investment strategies, this level of sector neutrality can be attractive as it may contribute to minimizing tracking differences and maintaining a similar sector-risk profile.

With an increasing emphasis on sustainability, understanding how sustainability-focused indices can perform in relation to broad market benchmarks is essential. The S&P 500 ESG Leaders Index shows how a sustainability-focused index can adhere to a degree of sector neutrality and have similar performance to the S&P 500. Further studies and insights into various sustainability indices can be explored through S&P Dow Jones Indices’ Sustainability Index Dashboard, enriching our understanding of this significant shift in investment paradigms.

1 For a thorough analysis of the outperformance of the S&P 500 ESG Index compared to the S&P 500, see Beyhan, Maya, “Charting New Frontiers: The S&P 500 ESG Index’s Outperformance of the S&P 500,” S&P Dow Jones Indices LLC, Sept. 06, 2024.

2 For more information on this widely used performance attribution model, see Brinson, Gary P., Hood, L. Randolph, Beebower, Gilbert L., “Determinants of Portfolio Performance,” Financial Analysts Journal, July-August, 1986.

The posts on this blog are opinions, not advice. Please read our Disclaimers.

Clash of Titans: Diverging Global and Emerging Market Mid-Year Active Performance

Contributor Image
Anu Ganti

Head of U.S. Index Investment Strategy

S&P Dow Jones Indices

Much of recent market commentary has been focused on market concentration concerns,1 thanks to the dominance of mega-cap stocks in the U.S., with the S&P 500® Top 50 outperforming the S&P 500 by 5% for the 12 months ending in September 2024.

But as we’ve noted in our inaugural SPIVA® Global Mid-Year 2024 Scorecard, concentration trends can manifest at a broader level than individual securities, and more specifically at a country level. The U.S. has significantly outperformed the rest of the world over the past decade, with a 10-year annualized return for the S&P World Index of 10.6%, compared to an equivalent return of 6.2% for the S&P World Ex-U.S. Index.  As a result, the weight of the U.S. component of the S&P World Index has risen accordingly, from 47% in June 2009 to over 70% as of the end of September 2024.

Turning our attention to the superpower on the other side of the globe, China’s weight in our emerging market benchmark, the S&P/IFCI Composite, declined from a peak of 37% in 2020 to 24% in June 2024 given the market’s economic and real estate woes. Since then, its weight rebounded to 27% as of September 2024, as China’s market staged a dramatic rally, with the S&P China BMI outperforming the S&P Emerging Ex-China BMI by 8% YTD through September.

So how did global equity active managers fare in this environment of contrasting U.S. and China performances in the first half of 2024? Our report shows that 71% of U.S.-domiciled Global Equity funds underperformed the S&P World Index, consistent with what we would expect from funds that systematically underweight the U.S. Meanwhile, international managers who gained outside-benchmark U.S. exposures may have benefited, as only 56% of U.S.-based international funds underperformed the S&P World Ex-U.S. Index.

Exhibit 2 shows that underperformance rates for the Global Equity (USD) category historically tended to worsen with U.S. outperformance. For global funds domiciled in Europe, Japan, Canada and Australia, the results were even bleaker, with 72%-82% of funds underperforming, perhaps because they were even more underweight the U.S. than their U.S.-domiciled counterparts. Underweighting the U.S. by these managers could potentially be due to home bias tendencies2 and a greater proclivity for domestic exposures.

Conversely, country dynamics were likely more accommodating for emerging market equity managers. Despite stock-level concentration headwinds consistent with those observed in the U.S., emerging market managers who were underweight to China may have benefited from the country’s poor performance. The S&P Emerging BMI underperformed the S&P Emerging Ex-China BMI by 2.5% in H1 2024.

In addition, Exhibit 3 illustrates that managers who tilted outside of their emerging market universe into developed markets, including the outperforming U.S. market, could have benefited considerably, as the S&P Developed BMI outperformed the S&P Emerging BMI by 2.6% over the same period. Perhaps capitalizing on both of these tailwinds, the U.S. Emerging Market Funds category posted majority outperformance, with 54% outperforming the benchmark S&P/IFCI Composite. The European-domiciled emerging market category fared slightly worse, with 55% of funds underperforming the benchmark.

Overall, the stellar performance of the U.S. compared to the rest of the world, coupled with China’s underperformance, may have led to mixed results across the Global Equity and Emerging Market Equity active fund categories during the first half of 2024. Although China’s rally has pulled back recently, if its turnaround is sustained, the tailwinds from an underweight to China may turn into potential headwinds for emerging market managers, the results of which we will have to wait to uncover once our year-end scorecards are released. Until then, dig deeper into how active funds across our reported categories and across regions fared in our SPIVA Global Mid-Year 2024 Scorecard.

1 Iacurci, Greg, “Is the U.S. stock market too ‘concentrated’? Here’s what to know,” CNBC, July 1, 2024.

2 Issifu, Sherifa, “Connecting the S&P/ASX 200 to U.S. Equity Icons,” S&P Dow Jones Indices LLC, June 2023.

The posts on this blog are opinions, not advice. Please read our Disclaimers.