Get Indexology® Blog updates via email.

In This List

Understanding the Outperformance of the S&P 500 ESG Leaders Index through a Sectoral Lens

Clash of Titans: Diverging Global and Emerging Market Mid-Year Active Performance

Did Stock Pickers Struggle? Can Bond Managers Boast? The Mid-Year SPIVA Results Are In!

The S&P/BMV IPC during Each Presidential Administration in Mexico

Creative Cacophony

Understanding the Outperformance of the S&P 500 ESG Leaders Index through a Sectoral Lens

Contributor Image
Maya Beyhan

Global Head of Sustainability, Index Investment Strategy

S&P Dow Jones Indices

The financial landscape has transformed significantly in recent years, with market participants increasingly recognizing the value of sustainability characteristics. One embodiment of this shift is the S&P 500® ESG Leaders Index, launched on Feb. 7, 2022, which is a best-in-class ESG index designed to measure the performance of securities with stronger than average ESG characteristics, while excluding those with controversial business activities that have negative social or environmental impacts.

The S&P 500 ESG Leaders Index outperformed the S&P 500 over the past one- and two-year periods in annualized terms, while maintaining a tracking error of 2.0% (see Exhibit 1). Understanding the nuances behind this outperformance requires a critical analysis of the factors at play—specifically stock selection and sector weighting, akin to our earlier research1 on the S&P 500 ESG Index.

Exhibit 2 provides insights via a Brinson2 attribution framework, allowing us to quantify sector contributions to the S&P 500 ESG Leaders Index’s excess return relative to the S&P 500. To emphasize the relative impact of sector weighting and stock selection effects, Exhibit 2 shows the proportion of the total impact (so that their absolute values sum to 100%), with the actual return impact shown in the labels. The findings suggest that the outperformance of the S&P 500 ESG Leaders Index was predominantly driven by stock selection effects rather than sector weighting. Nearly 71% of the outperformance can be attributed to the stock selection effect, underscoring the index’s strategic focus on maintaining sector neutrality.

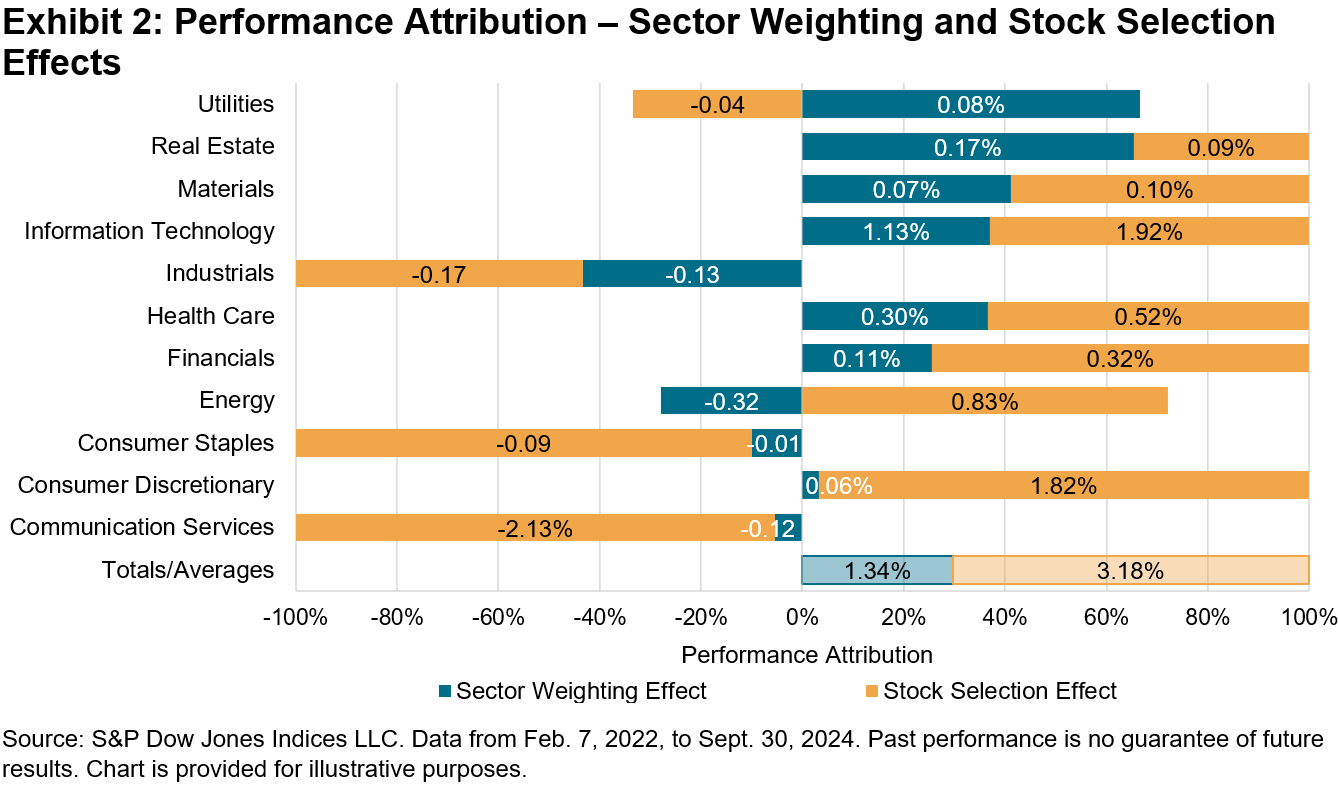
Diving deeper into sectoral effects, the analysis reveals that out of the 11 sectors included in the framework, only Utilities and Real Estate exhibited sector weighting effects that outpaced stock selection effects (see Exhibit 2). Furthermore, the average historical sector weights for the S&P 500 ESG Leaders Index and their differences from the S&P 500 are summarized in Exhibit 3.

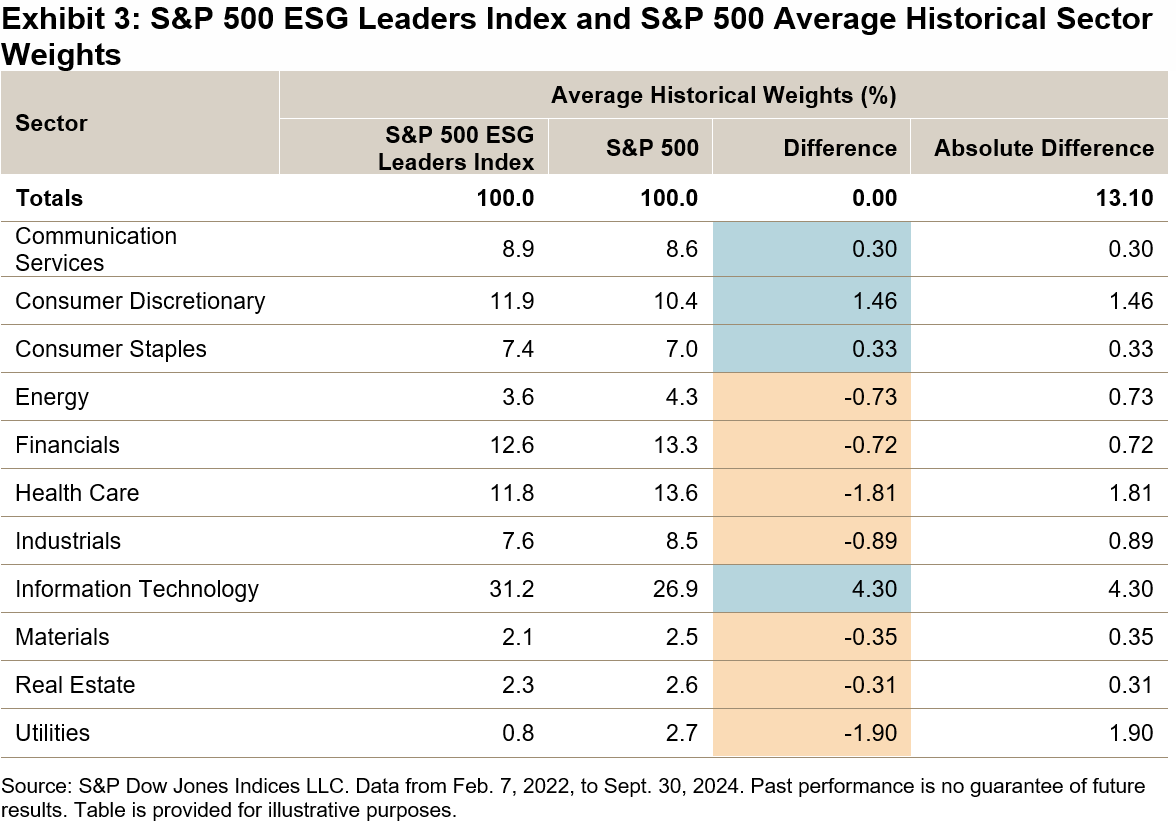
The observations in Exhibits 2 and 3 underscore an important achievement for the S&P 500 ESG Leaders Index—it achieved a notable degree of sector neutrality compared to the S&P 500, thus helping to mitigate the risk associated with over-concentration in particular sectors. For market participants aiming to incorporate sustainability into their investment strategies, this level of sector neutrality can be attractive as it may contribute to minimizing tracking differences and maintaining a similar sector-risk profile.

With an increasing emphasis on sustainability, understanding how sustainability-focused indices can perform in relation to broad market benchmarks is essential. The S&P 500 ESG Leaders Index shows how a sustainability-focused index can adhere to a degree of sector neutrality and have similar performance to the S&P 500. Further studies and insights into various sustainability indices can be explored through S&P Dow Jones Indices’ Sustainability Index Dashboard, enriching our understanding of this significant shift in investment paradigms.

1 For a thorough analysis of the outperformance of the S&P 500 ESG Index compared to the S&P 500, see Beyhan, Maya, “Charting New Frontiers: The S&P 500 ESG Index’s Outperformance of the S&P 500,” S&P Dow Jones Indices LLC, Sept. 06, 2024.

2 For more information on this widely used performance attribution model, see Brinson, Gary P., Hood, L. Randolph, Beebower, Gilbert L., “Determinants of Portfolio Performance,” Financial Analysts Journal, July-August, 1986.

The posts on this blog are opinions, not advice. Please read our Disclaimers.

Clash of Titans: Diverging Global and Emerging Market Mid-Year Active Performance

Contributor Image
Anu Ganti

Head of U.S. Index Investment Strategy

S&P Dow Jones Indices

Much of recent market commentary has been focused on market concentration concerns,1 thanks to the dominance of mega-cap stocks in the U.S., with the S&P 500® Top 50 outperforming the S&P 500 by 5% for the 12 months ending in September 2024.

But as we’ve noted in our inaugural SPIVA® Global Mid-Year 2024 Scorecard, concentration trends can manifest at a broader level than individual securities, and more specifically at a country level. The U.S. has significantly outperformed the rest of the world over the past decade, with a 10-year annualized return for the S&P World Index of 10.6%, compared to an equivalent return of 6.2% for the S&P World Ex-U.S. Index.  As a result, the weight of the U.S. component of the S&P World Index has risen accordingly, from 47% in June 2009 to over 70% as of the end of September 2024.

Turning our attention to the superpower on the other side of the globe, China’s weight in our emerging market benchmark, the S&P/IFCI Composite, declined from a peak of 37% in 2020 to 24% in June 2024 given the market’s economic and real estate woes. Since then, its weight rebounded to 27% as of September 2024, as China’s market staged a dramatic rally, with the S&P China BMI outperforming the S&P Emerging Ex-China BMI by 8% YTD through September.

So how did global equity active managers fare in this environment of contrasting U.S. and China performances in the first half of 2024? Our report shows that 71% of U.S.-domiciled Global Equity funds underperformed the S&P World Index, consistent with what we would expect from funds that systematically underweight the U.S. Meanwhile, international managers who gained outside-benchmark U.S. exposures may have benefited, as only 56% of U.S.-based international funds underperformed the S&P World Ex-U.S. Index.

Exhibit 2 shows that underperformance rates for the Global Equity (USD) category historically tended to worsen with U.S. outperformance. For global funds domiciled in Europe, Japan, Canada and Australia, the results were even bleaker, with 72%-82% of funds underperforming, perhaps because they were even more underweight the U.S. than their U.S.-domiciled counterparts. Underweighting the U.S. by these managers could potentially be due to home bias tendencies2 and a greater proclivity for domestic exposures.

Conversely, country dynamics were likely more accommodating for emerging market equity managers. Despite stock-level concentration headwinds consistent with those observed in the U.S., emerging market managers who were underweight to China may have benefited from the country’s poor performance. The S&P Emerging BMI underperformed the S&P Emerging Ex-China BMI by 2.5% in H1 2024.

In addition, Exhibit 3 illustrates that managers who tilted outside of their emerging market universe into developed markets, including the outperforming U.S. market, could have benefited considerably, as the S&P Developed BMI outperformed the S&P Emerging BMI by 2.6% over the same period. Perhaps capitalizing on both of these tailwinds, the U.S. Emerging Market Funds category posted majority outperformance, with 54% outperforming the benchmark S&P/IFCI Composite. The European-domiciled emerging market category fared slightly worse, with 55% of funds underperforming the benchmark.

Overall, the stellar performance of the U.S. compared to the rest of the world, coupled with China’s underperformance, may have led to mixed results across the Global Equity and Emerging Market Equity active fund categories during the first half of 2024. Although China’s rally has pulled back recently, if its turnaround is sustained, the tailwinds from an underweight to China may turn into potential headwinds for emerging market managers, the results of which we will have to wait to uncover once our year-end scorecards are released. Until then, dig deeper into how active funds across our reported categories and across regions fared in our SPIVA Global Mid-Year 2024 Scorecard.

1 Iacurci, Greg, “Is the U.S. stock market too ‘concentrated’? Here’s what to know,” CNBC, July 1, 2024.

2 Issifu, Sherifa, “Connecting the S&P/ASX 200 to U.S. Equity Icons,” S&P Dow Jones Indices LLC, June 2023.

The posts on this blog are opinions, not advice. Please read our Disclaimers.

Did Stock Pickers Struggle? Can Bond Managers Boast? The Mid-Year SPIVA Results Are In!

Contributor Image
Tim Edwards

Managing Director, Index Investment Strategy

S&P Dow Jones Indices

After global equity and bond markets soared in 2023, this year began on somewhat rockier ground. Valuations were more stretched, dispersion was rising and roughly half of the world’s population was facing uncertain election results. Many concluded that, among other predictions, active management was set to shine in 2024.

The performance of actively managed funds is assessed in S&P Dow Jones Indices’ regular SPIVA® Scorecards, and the results for the first half of this year are now available in a single, global report. In two of the largest fund categories —namely global and U.S. equities—it seems that the wait for the long-promised “stock-pickers’ market” continues.

Equity markets, admittedly, did not offer easy pickings in H1 2024: a whopping 75% and 73% of S&P 500® and S&P World Index constituents, respectively, had a lower return than the indices themselves. Active fund managers operating within those markets did not fare much better. Exhibit 1 shows the percentage of underperforming active equity funds in both categories. Although U.S.-domiciled funds came closest to changing the story, in both global and U.S. equity categories, a majority of actively managed funds underperformed.

But bond managers did have more to boast about. The winds were more in their favor, too. At the start of 2024, the U.S. and major European sovereign yield curves were inverted, meaning an intermediate-term manager could seek higher yields at typically lower risk (if measured by duration) by holding shorter-dated bonds. Further, both investment grade and high yield credit spreads compressed in H1 2024, meaning that managers taking on a little more credit risk than their benchmark could have expected to be rewarded. In many (but not all) of the largest fixed income categories, a majority of actively managed funds outperformed.

To learn more about the market factors and dynamics that helped to determine these results, and to dig deeper into more than 50 different global active fund categories, the full results are available in the SPIVA Global Mid-Year 2024 Scorecard 

The posts on this blog are opinions, not advice. Please read our Disclaimers.

The S&P/BMV IPC during Each Presidential Administration in Mexico

Contributor Image
Eduardo Olazabal

Associate Director, Global Exchange Indices

S&P Dow Jones Indices

On Oct. 1, 2024, a new presidential administration took office in Mexico amid a series of constitutional reforms and a new political landscape. Political change can create uncertainty, so it is useful to analyze past periods to identify trends and gain insights on the effects of similar events.

How did the S&P/BMV IPC and the MXN/USD exchange rate perform during the outgoing administration and how did this compare to other periods? Exhibit 1 shows a summary of the performance of the S&P/BMV IPC and the MXN/USD exchange rate since 2000.

The S&P/BMV IPC has delivered varied but positive returns in the past four administrations. We can observe that the annualized performance of the S&P/BMV IRT increased significantly in the past administration, going from 1.9% to 7.2%, though still below what we saw in the 2000s. In terms of volatility, the past six years saw a slight increase compared to the previous period; however, if we look at the return/risk ratio, the additional risk was offset by higher returns.

The exchange rate closed with a marginal appreciation when compared to its 2018 level, although just before the 2024 elections, it had appreciated by over 16%. In any case, this is noteworthy as this was the first administration in which the Mexican peso did not depreciate.

From a sector perspective, there have been notable changes in the largest sectors these past six years. Communication Services continued to shrink in share, from a high of 37% in 2006 to 10% in 2024. In the period from 2018-2024, Materials and Industrials gained 6% and 4%, respectively, while Financials decreased by 3% and Consumer Staples remained flat at 33%.

The first year of a new administration in Mexico tends to be eventful, as there are often major changes in policy. In addition, this can be exacerbated by external events, such as a global financial downturn or the U.S. presidential elections.

In Exhibit 3 we see the cumulative performance of the S&P/BMV IRT during the first year of each administration since 2000. Though each administration faced its own challenges, one thing they all have in common is that the S&P/BMV IRT ended their first year with positive returns.

Exhibit 4 illustrates the exchange rate volatility during the first year of each administration. While many factors influence exchange rates it is interesting that the level of MXN/USD volatility ended each administration’s first year roughly where it started, despite some short-term bouts of volatility during the year. The most volatile first year of an administration was seen in the period from 2012-2013, where annualized 21-day volatility reached 21%.

In conclusion, an administration’s effect on the equity market and the exchange rate in Mexico is better observed from a long-term perspective, as high levels of volatility, which tend to be short-lived, can create uncertainty but not necessarily mark a trend. Insights gained from these analyses could help market participants make informed decisions in the face of change.

The posts on this blog are opinions, not advice. Please read our Disclaimers.

Creative Cacophony

Contributor Image
Anu Ganti

Head of U.S. Index Investment Strategy

S&P Dow Jones Indices

The ETF industry has hit a major milestone, reaching USD $10 trillion in assets under management in the U.S. Commentary on the rise of index-based or passive investing may be widespread, but it is harder to find estimates of how truly “passive” their holders are. Secondary market volumes offer a fascinating, important and complementary perspective.

Our new paper “The Liquidity Landscape: Trading Linked to S&P DJI Indices,” shows that volumes associated with listed products tracking S&P DJI’s indices dramatically exceed the corresponding USD 6.6 trillion level of listed index-linked assets,1 with volumes almost doubling from four years ago to exceed USD 246 trillion in 2023.2 Index-based products are increasingly among the most traded securities, with ETFs representing 42% of the most-traded U.S.-listed equity securities by U.S. dollar volumes as of 2023.

The S&P 500® was the primary contributor to the volumes cited above and was associated with the largest number of distinct products. Volumes associated with the S&P 500 totaled approximately USD 224 trillion, the bulk of which was contributed by options and futures, as we observe from the left side of Exhibit 1. The right side of the exhibit shows volumes in indices derived from the S&P 500 such as our suite of sector or factor indices.

The S&P 500 ecosystem stands out because of its liquidity globally. The network of products tied to the S&P 500 or indices derived from it can form an interconnected web of pricing and trading activity through arbitrage mechanics or risk transference. For example, market makers in S&P 500-linked ETFs, which are listed in markets ranging from New Zealand to Brazil, might use futures to hedge their inventory positions. Or a holder of S&P 500 sector ETFs can weight them accordingly to replicate exposure to the benchmark. This same holder could use options to manage their downside risk or generate income from call overwriting. The resulting benefits in transparency and pricing efficiency stemming from these connections demonstrate the potential network effects of liquidity.

To better understand the behavior of such users of index-linked products, we can divide assets by volumes to arrive at an estimate of the average holding period among market participants.4 For example, for a fund with assets of USD 100 million, an aggregate annual trading volume of USD 200 million would imply an average holding period of six months. Exhibit 2 shows the distribution of assets across the S&P DJI universe by their respective trading frequencies: products with an average holding period of more than one year, one month to one year, one week to one month, and those with an average holding period of less than one week.

Exhibit 2 illustrates several notable observations. First, approximately 60% of assets were associated with products with an average holding period of less than one month, confirming the presence of some relatively active users. Second, options and futures along with leveraged ETPs tended to have shorter average holding periods, indicating heavier usage of these product types among shorter-frequency investors. Finally, while ETPs tended to have longer holding periods, only roughly 20% of ETP assets were associated with products with an average holding period of more than one year. The holders of index funds should not always be equated with “passive” investors.

The S&P DJI ecosystem has benefited from the network effects of liquidity offered by market participants operating on a wide range of trading frequencies, resulting in a creative cacophony of perspectives. This may provide long-term investors with greater confidence in the prices they experience, while more active traders may benefit from increased liquidity. Find out more about how our robust trading ecosystems are promoting price transparency, market efficiency and confidence all around the world in “The Liquidity Landscape: Trading Linked to S&P DJI Indices.”

1 See S&P Dow Jones Indices Annual Survey of Assets, Dec. 31, 2023.

2 See “A Window on Index Liquidity: Volumes Linked to S&P DJI Indices,” S&P Dow Jones Indices, Aug. 29, 2019.

3 Index equivalent trading volume (IET) reflects the economic exposure to the index that is being transacted at the time a trade occurs; it is determined by the instrument’s short-term responsiveness to movements in the underlying index. See Appendix of “The Liquidity Landscape: Trading Linked to S&P DJI Indices”, S&P Dow Jones Indices, Sept. 16, 2024.

4 We caution that any security can have a mix of investors who trade with different frequencies.

The posts on this blog are opinions, not advice. Please read our Disclaimers.